
Okay, the preceding steps tell us something about individual players. There is always the argument that team X is always better than everyone else. What if we could get a hit percentage by team and compare the results?
In this example, we are grouping the players by team and then computing an average hit percentage for the entire team:
teamhitpct <- summarize(group_by(pct, team), mean(hitpct, na.rm = TRUE))
names(teamhitpct) <- c("team", "hitpct")
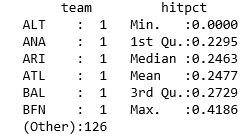
summary(teamhitpct)
So, who were the best teams ever? We can order the data by the teams' hit percentages (the -teamhitpct clause means that the results should be arranged in descending order) using:
teamhitpct <- teamhitpct[order(-teamhitpct$hitpct) , ] head(teamhitpct)
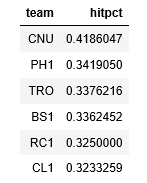
I'm not sure what the CNU team is; I assume it is an earlier Chicago team. The others are recognizable as Philadelphia, Toronto, and Boston.
We can find the top percentile of teams using the quantile function that we used previously for player hit performance:
quantile(teamhitpct$hitpct, probs = 0.99)
This gives us the following result:
99%: 0.340577141193618
Comparing this to the previous table, we can see that only two teams (out of 130) are in the top performance group (which is about the 1% mark).