
A common tool for data analysis is gathering the data from a public source such as a website. Python is adept at scraping websites for data. Here, we look at an example that loads stock price information from Google Finance data.
In particular, given a stock symbol, we want to retrieve the last year of price ranges for that symbol.
One of the pages on the Google Finance site will give the last years' worth of price data for a security company. For example, if we were interested in the price points for Advanced Micro Devices (AMD), we would enter the following URL:
https://www.google.com/finance/historical?q=NASDAQ:AMD
Here, NASDAQ is the stock exchange that carries the AMD security. On the resultant Google page, there is a table of data points of interest, as seen in the following partial screenshot.
Like many sites that you will be attempting to access, there is a lot of other information on the page as well, like headers and footers and ads, as you can see in the following screenshot. The web pages are built for human readers. Fortunately, Google and these other companies realize you are scraping their data and keep the data in the same format, so you will not have to change scripts.
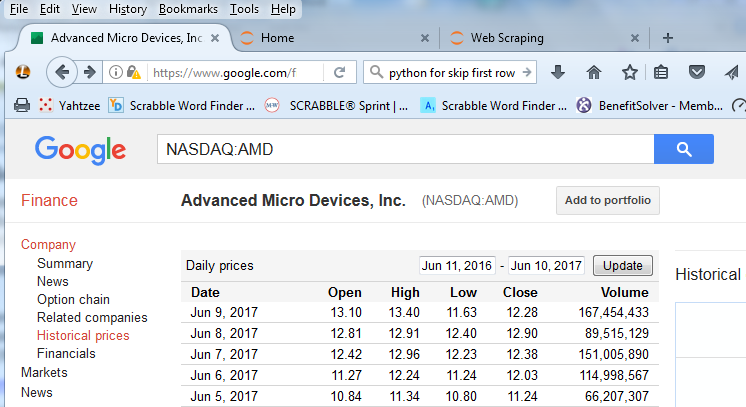
There is a clear table on that web page. If we look at the underlying HTML used to generate the web page, we find a lot of header, footer, and sidebar information but, more importantly, we find an HTML div tag with the id price_data. Within that div tag, we see an HTML table where each row has the value of date, opening price, high, low, close, and volume for that data as seen on screen.
We can use a standard Python library package, lxml, to load and parse the web page text into constituent HTML Python components that we can work with.
Then, for each day of data, we pull out the columns information and add it to our data list.
Typically, you might run this script once a day and store the newest day's information in your local database for further analysis. In our case, we are just printing out the last day's values on screen.
The Python script used is as follows:
from lxml import html
import requests
from time import sleep
# setup the URL for the symbol we are interested in
exchange = "NASDAQ"
ticker = "AMD"
url = "https://www.google.com/finance/historical?q=%s:%s"%(exchange,ticker)
# retrieve the web page
response = requests.get(url)
print ("Retrieving prices for %s from %s"%(ticker,url))
# give it a few seconds in case there is some delay
sleep(3)
# convert the text into an HTML Document
parser = html.fromstring(response.text)
# find the HTML DIV tag that has id 'prices'
price_store = parser.get_element_by_id("prices")
# we will store our price information in the price_data list
price_data = []
# find the HTML TABLE element within the prices DIV
for table in price_store:
    #every row (skip first row headings) of table has
    #  date, open, high, low, close, volume
    for row in table[1:]:
        #store tuples for a day together
        day = {"date":row[0].text.strip('
'),
               "open":row[1].text.strip('
'),
               "high":row[2].text.strip('
'),
               "low":row[3].text.strip('
'),
               "close":row[4].text.strip('
'),
               "volume":row[5].text.strip('
')}

        #add day's information to our set
        price_data.append(day)
print ("The last day of pricing information we have is:")
print (price_data[0])
Running this script in a Jupyter console, we see results as in the following partial screenshot:
