We take the example from a presentation I made at www.dantoomeysoftware.com/Using_R_for_Marketing_Research.pptx looking at the effectiveness of different ad campaigns for grape fruit juice.
The code is as follows:
#library(s20x)
library(car)
#read the dataset from an existing .csv file
df <- read.csv("C:/Users/Dan/grapeJuice.csv",header=T)
#list the name of each variable (data column) and the first six rows of the dataset
head(df)
# basic statistics of the variables
summary(df)
#set the 1 by 2 layout plot window
par(mfrow = c(1,2))
# boxplot to check if there are outliers
boxplot(df$sales,horizontal = TRUE, xlab="sales")
# histogram to explore the data distribution shape
hist(df$sales,main="",xlab="sales",prob=T)
lines(density(df$sales),lty="dashed",lwd=2.5,col="red")
#divide the dataset into two sub dataset by ad_type
sales_ad_nature = subset(df,ad_type==0)
sales_ad_family = subset(df,ad_type==1)
#calculate the mean of sales with different ad_type
mean(sales_ad_nature$sales)
mean(sales_ad_family$sales)
#set the 1 by 2 layout plot window
par(mfrow = c(1,2))
# histogram to explore the data distribution shapes
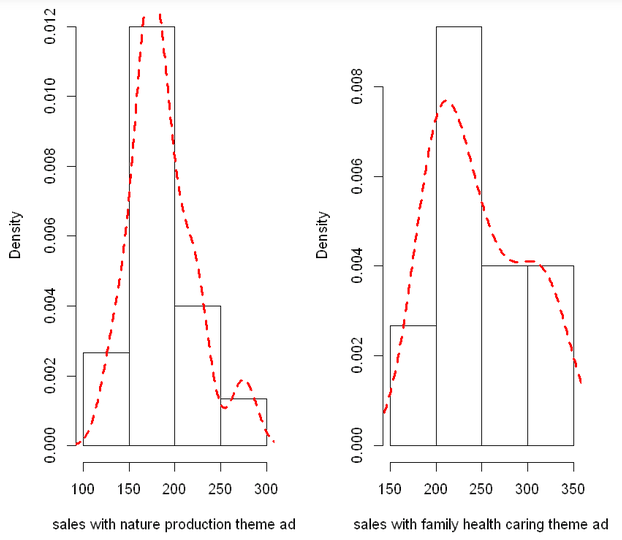
hist(sales_ad_nature$sales,main="",xlab="sales with nature production theme ad",prob=T)
lines(density(sales_ad_nature$sales),lty="dashed",lwd=2.5,col="red")
hist(sales_ad_family$sales,main="",xlab="sales with family health caring theme ad",prob=T)
lines(density(sales_ad_family$sales),lty="dashed",lwd=2.5,col="red")
With output (several sections):
(raw data from file, first 10 rows):
|
sales |
price |
ad_type |
price_apple |
price_cookies |
|
|
1 |
222 |
9.83 |
0 |
7.36 |
8.8 |
|
2 |
201 |
9.72 |
1 |
7.43 |
9.62 |
|
3 |
247 |
10.15 |
1 |
7.66 |
8.9 |
|
4 |
169 |
10.04 |
0 |
7.57 |
10.26 |
|
5 |
317 |
8.38 |
1 |
7.33 |
9.54 |
|
6 |
227 |
9.74 |
0 |
7.51 |
9.49 |
Statistics on the data are as follows:
         sales           price           ad_type     price_apple
     Min.   :131.0   Min.   : 8.200   Min.   :0.0   Min.   :7.300
     1st Qu.:182.5   1st Qu.: 9.585   1st Qu.:0.0   1st Qu.:7.438
     Median :204.5   Median : 9.855   Median :0.5   Median :7.580
     Mean   :216.7   Mean   : 9.738   Mean   :0.5   Mean   :7.659
     3rd Qu.:244.2   3rd Qu.:10.268   3rd Qu.:1.0   3rd Qu.:7.805
     Max.   :335.0   Max.   :10.490   Max.   :1.0   Max.   :8.290
     price_cookies
     Min.   : 8.790
     1st Qu.: 9.190
     Median : 9.515
     Mean   : 9.622
     3rd Qu.:10.140
     Max.   :10.580
The data shows the effectiveness of each campaign. Family sales are more effective:
- 186.666666666667//mean of nature sales
- 246.666666666667//mean of family sales
The difference is more pronounced on the histogram displays: