
With interpolation, we are taking a guess at a value for a function given a set of discrete points. For example, suppose that your test results showed something like this:
%matplotlib inline
import matplotlib.pyplot as plt

x = [1, 3, 5, 7]
y = [0.5, 0.4, 0.35, 0.29]
plt.plot(x,y)
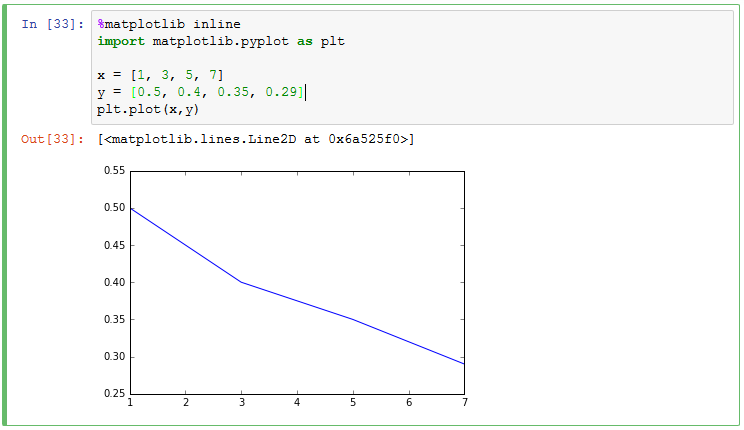
In this case, we could interpolate the result of the function when x is 4 using a script like this:
from scipy.interpolate import interp1d
g = interp1d(x, y)
print (g(4))
This gives us the result of 0.375, which sounds correct.
