
We load the libraries to use rpart and caret. rpart has the decision tree modeling package. caret has the data partition function:
library(rpart)
library(caret)
set.seed(3277)
We load in our mpg dataset and split it into a training and testing set:
carmpg <- read.csv("car-mpg.csv")
indices <- createDataPartition(carmpg$mpg, p=0.75, list=FALSE)
training <- carmpg[indices,]
testing <- carmpg[-indices,]
nrow(training)
nrow(testing)
33
9
We develop a model to predict mpg acceptability based on the other factors:
fit <- rpart(mpg ~ cylinders + displacement + horsepower + weight + acceleration +
             modelyear + maker, method="anova", data=training)
fit
n= 33

node), split, n, deviance, yval
      * denotes terminal node

1) root 33 26.727270 1.909091
2) weight>=3121.5 10  0.000000 1.000000 *
3) weight< 3121.5 23 14.869570 2.304348
6) modelyear>=78.5 9  4.888889 1.888889 *
7) modelyear< 78.5 14  7.428571 2.571429 *
The display is a text display of the decision tree. You can see the decision tree graphically as follows:
plot(fit)
text(fit, use.n=TRUE, all=TRUE, cex=.5)

It appears to be a very simple model. There must have been a change to mileage for the 1980 year as that is the main driver for the decision tree.
Finally, we predict values and compare them against our testing set:
predicted <- predict(fit, newdata=testing)
predicted
testing
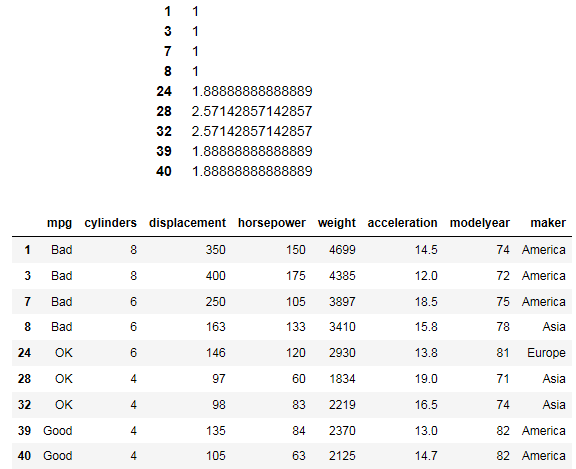
It looks like the package has converted Bad, OK, and Good into a numerical equivalent where 1 is Bad and others are OK or Good. Overall, we are not sure if we have a good model. There is clearly not much data to work with. A larger test set would clear up the model.