
The pivot() function allows you to translate rows into columns while performing aggregation on some of the columns. If you think about it you are physically adjusting the axes of a table about a pivot point.
I thought of an easy example to show how this all works. I think it is one of those features that once you see it in action you realize the number of areas that you could apply it.
In our example, we have some raw price points for stocks and we want to convert that table about a pivot to produce average prices per year per stock.
The code in our example is:
from pyspark import SparkContext
from pyspark.sql import SparkSession
from pyspark.sql import functions as func

sc = SparkContext.getOrCreate()
spark = SparkSession(sc)

# load product set
pivotDF = spark.read.format("csv")
        .option("header", "true")
        .load("pivot.csv");
pivotDF.show()
pivotDF.createOrReplaceTempView("pivot")

# pivot data per the year to get average prices per stock per year
pivotDF
    .groupBy("stock")
    .pivot("year",[2012,2013])
    .agg(func.avg("price"))
    .show()
This looks as follows in Jupyter:

All the standard includes what we need for Spark to initialize the SparkContext and the SparkSession:

We load the stock price information from a CSV file. It is important that at least one of the stocks have more than one price for the same year:
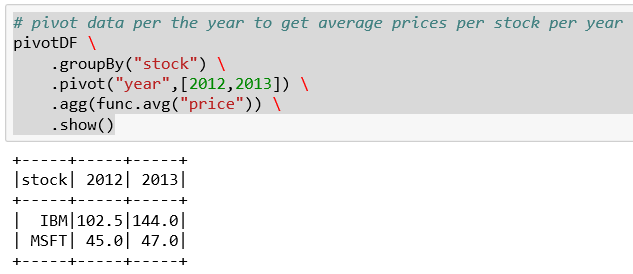
We are grouping the information by stock symbol. The pivot is on the year that has two values, 2012 and 2013, in our dataset. We are computing an average price for each year.