NumPy is a package in Python providing multidimensional arrays and routines for array processing. We bring in the NumPy package using import * from numpy statement. In particular, the NumPy package defines the array keyword, referencing a NumPy object with extensive functionality.
The NumPy array processing functions run from the mundane, such as min() and max() functions (which provide the minimum and maximum values over the array dimensions provided), to more interesting utility functions for producing histograms and calculating correlations using the elements of a data frame.
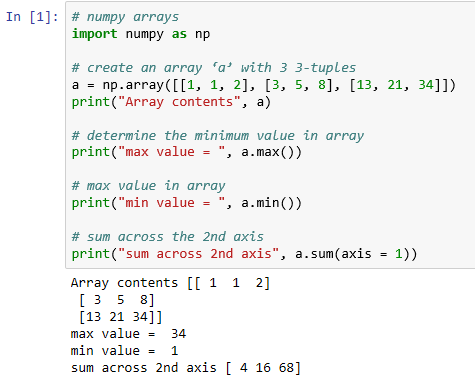
With NumPy, you can manipulate arrays in many ways. For example, we will go over some of these functions with the following scripts, where we will use NumPy to:
- Create an array
- Calculate the max value in the array
- Calculate the min value in the array
- Determine the sum across the second axis
# numpy arrays
import numpy as np

# create an array 'a' with 3 3-tuples
a = np.array([[1, 1, 2], [3, 5, 8], [13, 21, 34]])
print("Array contents", a)

# determine the minimum value in array
print("max value = ", a.max())

# max value in array
print("min value = ", a.min())

# sum across the 2nd axis
print("sum across 2nd axis", a.sum(axis = 1))
If we transfer this script into a Python notebook, we see a display like the following when we execute the cell:
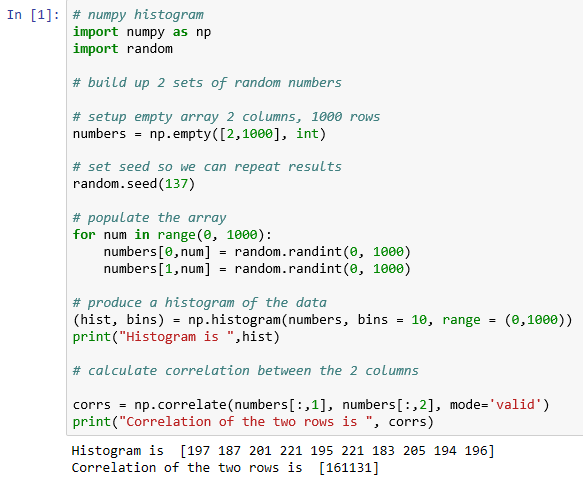
We can use the use the following script to work over arrays with the more interesting histogram and correlate functions:
import numpy as np
import random

# build up 2 sets of random numbers

# setup empty array 2 columns, 1000 rows
numbers = np.empty([2,1000], int)

# set seed so we can repeat results
random.seed(137)

# populate the array
for num in range(0, 1000):
    numbers[0,num] = random.randint(0, 1000)
    numbers[1,num] = random.randint(0, 1000)

# produce a histogram of the data
(hist, bins) = np.histogram(numbers, bins = 10, range = (0,1000))
print ("Histogram is ",hist)

# calculate correlation between the 2 columns

corrs = np.correlate(numbers[:,1], numbers[:,2], mode='valid')
print ("Correlation of the two rows is ", corrs)
In this script, we are:
- Populating a two-column array with random numbers
- Producing a histogram of the values from both columns within 100 point ranges
- And, finally, determining the correlation between the two columns (which should be a very high correlation)
After entering this script into a Jupyter Notebook and executing the cell, we have an output as follows. It makes sense that the buckets are very close in size: