
As promised, the rest of this chapter will get you rolling with hands-on exercises for learning BI Publisher. Here, the goal is to step through the critical parts for setting up a BI Publisher 12c environment, creating a report or two, and preparing a report for delivery. Along the way, we will highlight features that you should keep an eye out for, research on your own at a later date, or simply understand to make your development cycles easier.
Let's start with administration. Because without that, there isn't much else you, or any of your users, will be able to do.
This section gets away from the theory and core explanations that you've read so far. You will take a step-by-step journey through a real-world implementation. This includes how to assess the Fusion Middleware Security application roles, create several data sources, and ensure that application roles have access to the desired data sources. All of this effort prepares you for creating an actual BI Publisher--sorry (!)--Published Reporting report.
Getting to the Administration page is the first step in this process. Start by following these steps:
- Log in to the Oracle BI Analytics portal:
http://<server_ name>:<default_port>/analytics/,with the WebLogic administrator user credentials. - Click on the Administration link in the global header section that we showed you in a previous screenshot.
- In the subsection labeled as BI Publisher, click on the Manage BI Publisher link.
From the BI Publisher Administration page, verify the existing application roles available from FMW Security. Again, FMW Security aims to manage all privileges by application roles as a more streamlined way of organizing users from multiple identity providers. It is also an open standard way of authorization:
- Click on the Security Configuration link under the Security Center subsection.
- Scroll down to the bottom of the page and notice that, as per the default installation configuration, BI Publisher security has been set up to use the Oracle Fusion Middleware authorization model:

- Scroll back to the top of the page and click on the Roles and Permissions tab:

- Review the application roles available under this tab. These are the same application roles that were created in Chapter 6, Understanding the Systems Management Tools.
Notice how an application role, which doesn't show here, is the authenticated user role. This application role has special properties within Fusion Middleware Security. Special consideration should be taken before removing this role from the Enterprise Manager Fusion Middleware Control application roles panel. But if your project's security calls for stringent control and you need to remove this role, please note that this will immediately affect the BI Consumer application role and all other principals related to it.
As a prerequisite to this chapter, you should have already deployed a database to your relational database management system. This exercise will make reference to the database dump conducted against OBIEE. The JDBC connection information should be similar if you are using a MySQL database, or in our case, an SQl Server DB:
- Navigate back to the BI Publisher Administration page.
- Click on JDBC Connection.
- On the JDBCtab, click on the Add Data Source button.
- Enter your database connection information in the fields available under the Generalsection of the Add Data Source page.
- In the Data Source Name field, enter
AdventureDB. - Click on the Test Connection button to validate that the information entered is accurate and returns a successful test message:

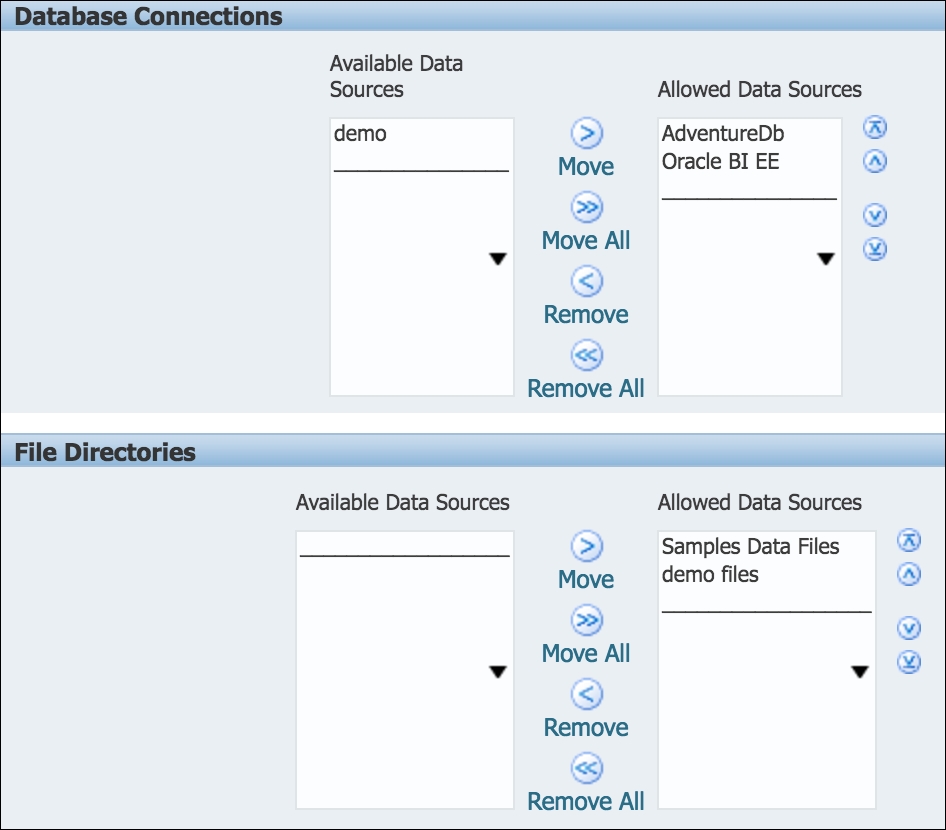
- Scroll down to the bottom of the page and focus on the Securitysection.
- Select BI Content Author in the Available Roles column and use the Movebutton to add this role to the Allowed Roles column:

- Scroll back to the top of the Add Data Source page.
- Click on the Apply button located towards the right of the page.
In order to use any type of file as a data source with BI Publisher, the potential data source filesystem location must be declared as a data source, using the same principle as creating any other connection. The interesting thing about the filesystem data source is that you have to assign a top-level filesystem directory as the source, and not the individual file itself, in the Administration page. At a later time, this allows you to either upload the file or leverage a file that exists in the data source directory as a feed for your reports. To keep it simple, let's create a File data source in a readily available path on your server:
- In the BI Publisher Administration page, click on the File link under the Data Sources subsection.
- We will use OBIEE sample data that we can see if data source name and file directory:

Alternatively, if we had our own file we could click on the Add Data Source button and add a name in the Data Source Name field. Then in the Full Path of the Top-level Directory field, enter the folder that is located on the server where you have installed Oracle BI Publisher. On a Linux system, this may be
/home/<user>/, for example.Tip
If you are using an MS Windows OS, it may be necessary to enter the directory path using forward slashes and not the standard back slashes. This is usually due to the Java OS agnostic escaping of special characters of which a Nix system is already compliant when it comes to the handling of a directory path syntax.
- Click on the Data Source Name. In the Security subsection, select BI Content Author in the Available Roles column and use the Move button to add this role to the Allowed Roles column.
- Click on the Apply button located towards the right of the page.
After creating several data sources, there is a simple way to verify the data source assignment privileges for each application role:
- On the BI Publisher Administration page, click on the Roles and Permissions link under the Security Centre subsection.
- On the BI Author Role row, click on the key image under the Add Data Sources column:

- The resulting page, Add Data Sources: BI Author Role, shows all assigned data source privileges from the data sources created so far:
- Scroll back to the top of this page and click on the Cancel button towards the top-right of the page.
Be aware that the session timeout settings differ in BI Publisher when compared to Oracle BI Foundation Presentation services. You may be conducting configurations in the BI Publisher Administration page via Oracle BI Presentation services and notice that some commands don't function properly. This may be due to your BI Publisher session timing out. If so, click on the Administration link in the global header again and navigate to Manage BI Publisher once more.
Now that the data sources have been created, the data model modeling can begin. Th following is a standard initial process:
- Plan and select the data sources.
- Create a data model.
During the creation of data sources, enter proper descriptions, and keep notes as to why the data sources were created. Due to the ease of adding data sources without enterprise top-down guidance, as in the Oracle BI metadata repository RPD, it is easy to have superfluous or nonutilized data sources cluttering the tool. Part of a BI Publisher administrator's duties may be to design a solid security model that restricts the number of users who can build a data model in order to keep the number of data models in the system manageable. On that note, let's get cracking with creating our first simple data model.
Tip
This exercise and the remainder of the development exercises will take place in the Oracle BI Presentation Services portal. Although the BI Publisher environment /xmlpserver application can be used for development, our examples follow the principle that the two environments are fully integrated and the most common entry point to the system will be the OBIEE Presentation services.
As with Object Orient Programming (OOP), all Oracle BI artefacts should be organized in a way that common artefacts are grouped together and made able to be easily repurposed whenever possible. Oracle BI Publisher 12c provides this capability to reuse data models across multiple reports. Let's begin by creating the container folder:
- Log in to the Oracle BI /analytics portal with the WebLogic or BI Admin administrator user credentials.
- Click on the Cataloglink in the global header.
- On the Catalogpage, click on the Shared Folders folder in the Folders pane.
- Click on the New icon from the menu bar and click on the new Folder icon to create a new folder:

- Name the folder as
BI Publisher Reportswhen the New Folder prompt appears. - You should now have a folder named
BI Publisher Reportsunder theShared Folderscatalog directory. In the next step, we will create a data model and add it to this folder.
In this section, you will create a single data model for the finance reports that we will create soon:
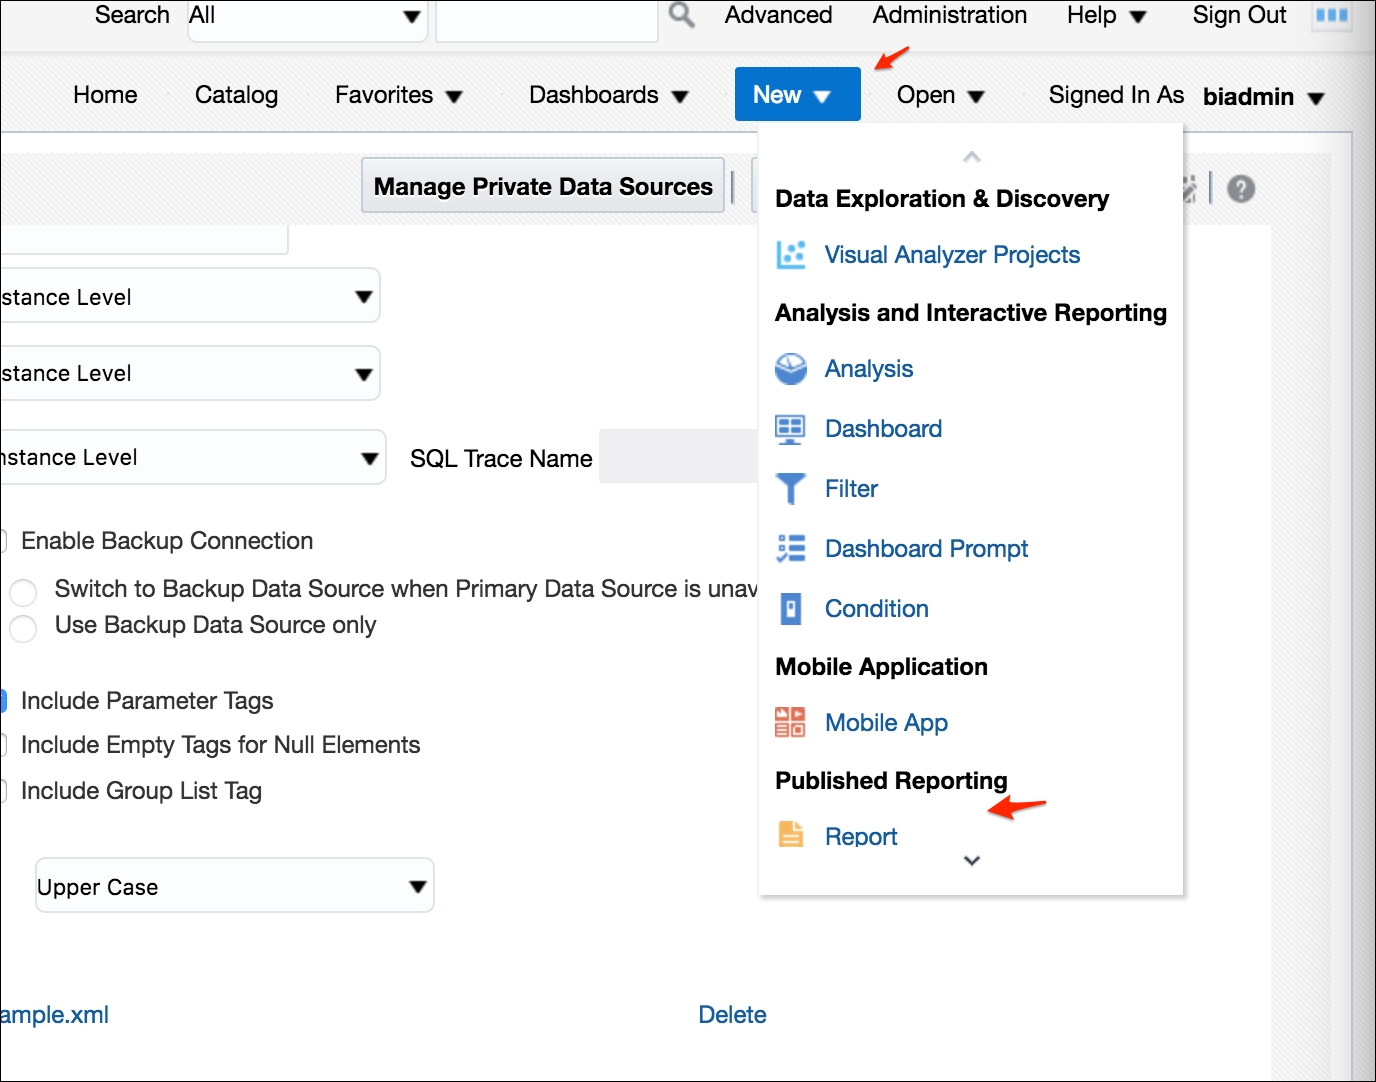
- Click on the New dropdown from the Global Header section and select the Data Model option under the Published Reporting section:

- On the resulting page (or under Properties), several fields are available to begin entering metadata for the data model.
- In the Descriptionfield, enter
Finance. - In the Default Data Source field, change the drop-down field value to AdventureDB:

- Click on the Save disk icon in the upper-right corner of the web page. It is located underneath the Sign Out link area. The Save As dialog box will appear.
- In the Namefield, change the
Untitledvalue toFinance. - Select the
BI Publisher Reportsfolder, which you created in the previous exercise, from the the dialog box on the left-hand side of the page. - Click on the OKbutton in the Save As dialog box to complete the operation.
Tip
A data model can hold one or more related or unrelated data sets. Data sets are the means to which the data we wish to populate reports is organized. The first data set to create is one that allows the data in our AdventureWorks database to be joined logically. Even though a relationship may exist at the physical database via a primary key/ foreign key relationship, it must still be logically represented in BI Publisher. This logical representation of the relationships allows the GUI interface to manage and optimize queries, parameterization, and so on. Follow the next steps to create a simple data set for the main report that you will create.
- Open the Finance1 data model, created while following the steps mentioned in the preceding section, if it is not already open.
- Expand the Data Model node in the left pane of the Data Model Editor and click on the Data Sets option:

- The main editor window will show that the Diagram tab is selected and the Global Level Functions layout node is available.
- Click on the new data set icon and select the SQL Query option:

- In the New Data Set - SQL Query prompt:
- Enter
Financein the Namefield. - Select the AdventureDBoption from the Data Source drop-down list.
- Click on the Query Builder button in order to select the SQL tables that will comprise the data set.
The Query Builder window will open and the data source's available objects will be listed on the left pane of the window:

Note that we can see the warehouse physical tables. You can also swap between DB catalogs and schema, and search for objects in the left pane. Click on the following tables in the left pane of the window to bring them into the main panel of the Query Builder: FactFinance, DimOrganization, DimDate, DimScenario, DimDepartmentGroup, and DimAccount.
Join the tables with their respective relationships by clicking on the empty box corresponding to the column of each table where a relationship exists:
- Click on the empty box besides the OrganizationKey column of the
DimOrganizationtable. - Now click on the empty box besides the OrganizationKey column in the
FactFinancetable. - This creates the join between the two tables. The join is indicated by a light blue line:

- Check the checkbox next to OrganizationName in the
DimOrganizationtable. - The join will be successful, but the columns that will be retrieved from that table will not be defined. For defined surface columns in a dataset, the checkbox corresponding to the desired column of each table must be checked.
- Using the same join routine as mentioned in the preceding step, join the following table (column) references below the respective columns in the
FactFinancetable:- DimDate (DateKey) to DateKey
- DimScenario (ScenarioKey) to ScenarioKey
- DimDepartmentGroup (DepartmentGroupKey) to DepartmentGroupKey
- DimAccount (AccountKey) to AccountKey
- To surface the correct column fields that we wish to use in a report, click on the checkbox corresponding to the following table (column) references:
- DimDate (CalendarYear)
- DimScenario (ScenarioName)
- DimDepartmentGroup (DepartmentGroupName)
- DimAccount (AccountType)
- Click on the Savebutton in the Query Builder window.
- This will return you to the New Data Set - SQL Query window. This window will show the joins that have been made during your interaction with the Query Builder. However, the generated syntax is not always the best syntactically or the most optimized for your specific database. So when you click OK, you may experience an error. Advanced queries should leverage a predefined SQL to save time and ensure accuracy. Create your SQL in a SQL IDE, such as Oracle SQL Developer first, and then copy and paste it into the SQL Query field. This is often a best practice. As a shortcut, remove the content from the SQL Query field and type or paste in the following more advanced SQL statement. This will give us a simple data set to play with:
select dg.DepartmentGroupName, d.CalendarYear, sum(f.Amount) from DimDepartmentGroup dg, DimDate d, FactFinance f where ( dg.DepartmentGroupKey = f.DepartmentGroupKey and d.DateKey = f.DateKey ) group by dg.DepartmentGroupName, d.CalendarYear - Click on the OK button to close the Create Data Set - SQL window.
- The resulting data set will be displayed in the main editor pane and also in the left pane with the name that we have defined:

Each data set has the ability to represent columns with an alias just like in a standard SQL. Using the Query Builder, the names that would ultimately be shown to report developers and report viewers are the physical data source column names. However, they can be changed in the data set, so that these business names are there by default when development starts:
- In the column under the Business View header, the Display Name column shows the value displayed for this data set column. Click in the field for each of the Display Name columns and change the values to the following business name representations.
- Make sure the Table View option is selected.
- Click on the Structure tab in the main editor window. The tabs are located directly above the option you selected earlier to create a data set:
nulltoRevenueDepartmentGroupNametoDepartmentCalendarYeartoYear

- Click on the save disk icon to save the data model. The save disk icon is located under the Sign Out link in the upper-right corner of the web page.
By default, an SQL data set is static. That is to say that the current logic you have coded in your SQL statement will not change or be dynamically filtered. Static reports are too rigid to be effective in today's enterprise. So, parameterization or the ability to change a data set by passing a variable to replace a filtered value within the query creates a dynamic result. One or more parameter variables can be created for a data model. A parameter can be created explicitly just as you created a data set by selecting the option in the left pane and then creating the parameter in the main editor, or it can be done using the Data Set Editor itself. Now we'll conduct an exercise using the latter approach:
- Return to the Finance1 dataset.
- Click on the Diagram tab in the Data Model Editor
- Click on the data set to select it.
- Click on the pencil icon for editing a data set from the menu under the Diagram tab.
- In the SQL Query field, in the SQL statement, find the WHERE clause with the following syntax:
where
d.CalendarYear = 2013

- Click OK to check that your syntax is correct. Now edit the SQL query again and change the SQL syntax to the following by modifying the value 2001 to
:p_yearandd.CalendarYear=:p_year. - Ensure that the syntax is correct (that is, a colon
:beforep_year) and click on the OK button. - Notice that after you click on the OK button, you are prompted with the following question: Please select one or more bind variables to create corresponding parameters.
- Check the box by p_year:

- Click on the OK button to accept and you will be navigated to the Parameters tab of the Data Model. Notice that under the Parameters option, a new item now exists:
p_year:
- Make sure you save your Data Model before moving on.
A parameter is now in place to dynamically adjust the SQL query result set. A good idea is to provide a drop-down list, or similar, to allow for selecting one or more values to manipulate our new dynamic query. In BI Publisher, this is commonly referred to as a list of values. A list of values can be a hardcoded static list defined once, or it can stem from a data source query. This example uses the former approach. To create a static list of values follow these instructions:
- Enter new values in the following column fields.
- Click on the plus icon to add a new list of values.
- Click on the List of Values option on the left-hand side pane of the data model:
- Enter
LOV_YEARin the Name field. - Select Fixed Data from the Typedropdown.
- Enter
- A new sublevel appears after selecting the Fixed Data value from the Type dropdown.
- Click on the plus icon in the sublevel table to create the first record of the static data. This will become a value in a drop-down list containing years that will get passed into the dataset.
- Click on the green plus icon again to confirm the preceding input and create a new record.
- Repeat steps 5 and 6 to enter values for years 2007 to 2017.
- Click on the Save button icon to save the data model:

- The
p_yearparameter is associated with the dataset, but now the list of values,LOV_YEAR, needs to be associated to the parameter. This is fairly straightforward and one of the last steps in wrapping up this data model exercise:- Change the Data Type column to Integer.
- Enter
2006in the Default Value column field. - Select Menu from the Parameter Type dropdown.
- Click on the parameter
p_yearon the left pane of the Data Model Editor. - On the
p_yearrow:- Change the Display Label value from the default value to
Year - Change the List of Values dropdown to LOV_YEAR
- Change the Display Label value from the default value to
- Deselect the Multiple Selection and Can select all checkbox options.
- Save the data model:

Once you are satisfied that the data model is complete for your data requirements (or even during the course of your iterative development), it is always a good idea to look at the data that now stems from your creation. BI Publisher looks at this as sampling your data. This sample data has three purposes. The first allows you to see that your data set has been created correctly and allows you to test your parameterizations and other properties on a small scale. The second allows you to see your data represented in XML format, which is ultimately how BI Publisher data is put together so that it can then leverage open standards for formatting, and so on. The third, is that, a sample data file will be saved in XML format, so that it can then be used to assist you in creating your reports without having to send repetitive queries back to the underlying data source.
Tip
The third point highlights a key distinction from report development with OBIEE's ad-hoc analysis tool versus the production reporting of BI Publisher. With OBIEE's Interactive Reporting, the focus is mostly on the consumption of data. So, even when developing the report, the query attempts to ping the underlying data source each time the analysis request is displayed. BI Publisher has a heavier focus on aesthetics. So, leveraging a sample data file prevents overhead and keeps an emphasis on production report development.
To get at the sample data, follow these instructions:
- From the Data Model Editor, click on the View Data in the upper-right corner of the web page.
- The resulting page shows the parameter for Year at the top of the page and also provides an option to select the number of rows that should be returned:

- Change the Year dropdown to 2013.
- Change the number of Rows to return to 50.
- Click on the View button.
- The results are returned in the XML format and this sample set of data is ready to be saved as our sample data.
- Select the Save As Sample Data option:

- Review the Data Model Editor main page. Click on the data model parent level in the left-pane hierarchy, if not taken to this area by default. Under the Attachment section, you should see a listing for a
sample.xmlfile:
- Save your data model again. You've successfully created a data model that provides some dynamic functionality. You should now have a good idea of how the baseline data source configurations are put together. Let's wrap up by creating a simple report, using the web-based GUI.
Just like the Data Model Editor, which handles the configuration of data sources by using a Dynamic HyperText Markup Language (DHTML) web-based interface, a complementing report design tool within BI Publisher--Layout Editor--also uses DHTML. Historically,BI Publisher users were relegated to using software suite (for example, MS Word) plugins in order to create templates to layout reports and ultimately publish those reports for consumption. Now, the same pixel-perfect layout and design efforts can be achieved in full Web 2.0 glory using the Layout Editor.
Some argue that using the software plugins to develop BI Publisher templates provides more control than what the Layout Editor currently provides. This is debatable.
Each time you attempt to create a published report in Oracle BI 12c, you will be prompted to select an existing data model, create a new one, or upload a spreadsheet to leverage as the data model.
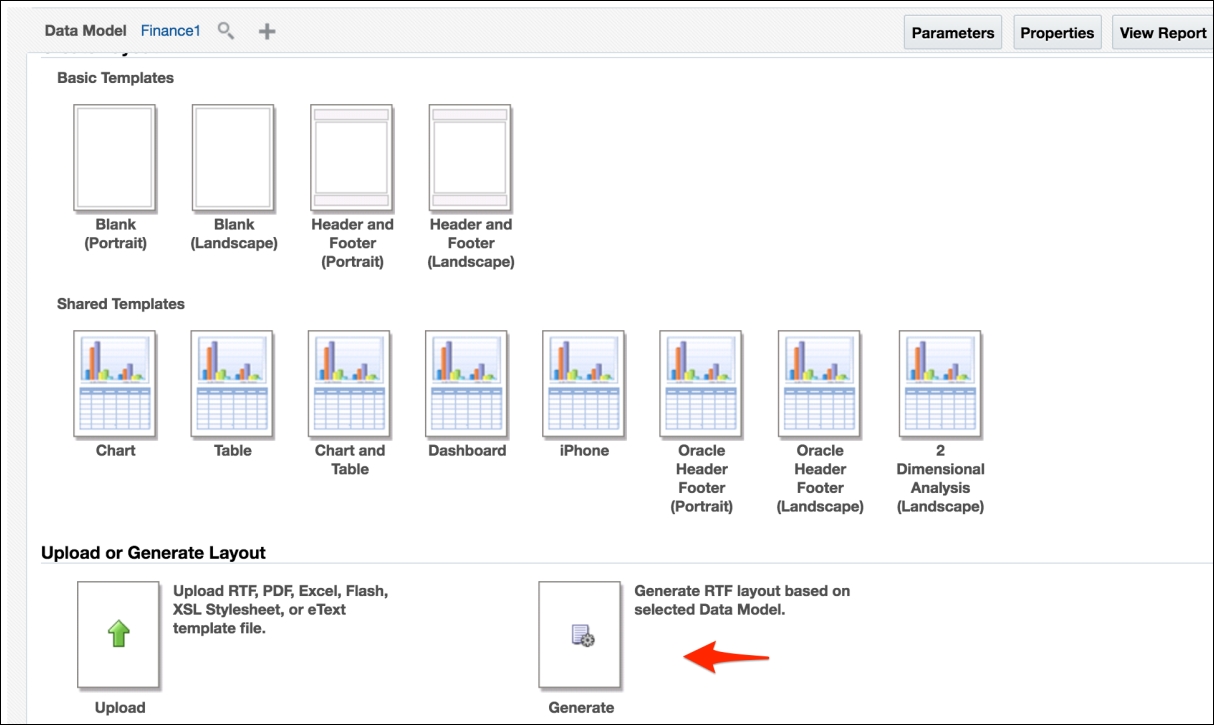
You've created a simple data model in the exercise shown in the preceding section, so that it won't be a problem. After that selection is made, you'll be prompted to select a layout that defines the initial format of your report. You can create a new template, select from a set of very generic starter templates, upload an existing template, or have BI Publisher generate the layout for you based on the structure of the selected data model. You will use the latter option by following these steps:
- From the global header, select New | Report under the Published Reporting section of the drop-down list:
- Select the Use Data Model option from the prompt that appears:

- In the Save In dialog box.
- Select the Use Report Editor option and click on the Finishbutton.
- Select the
Finance1file and click on the OK button. - Click on the magnifying glass and locate the
Finance1data model file from theShared Folders/BI Publisher Reportsfolder:- Save the file in the
BI Publisher Reportsfolder. Of course, you should organize folders in a manner that is logical to your individual project requirements. - Enter
Departmental Finance Reportin the Namefield by replacing any existing default text.
- Save the file in the
- Click on the OK button to close the dialog box.
- Click on the Generate page image under the Uploador Generate Layout section:
- The Auto Generate Layout prompt will appear.
- Enter
Revenue per Groupin the Template Name field:
- Click on the Generate button to confirm and initiate the autogenerate layout process. The resulting page shows the report's layout inventory page with a single autogenerated layout.
- Most of what needs to be done next requires that you now save the report. Click on the save icon in the upper-right corner of the web page. As you may have guessed from the number of prompts in this walkthrough, you should frequently save reports as you develop to prevent loss of work!
- Click on the View Report icon/link next to the save icon to display the autogenerated report:

- The Revenue per Group layout of the Departmental Finance Report is displayed in all of its very basic data grid glory, along with the parameterized List of Values dropdown at the top of the page.
- Change the value in the Year dropdown to 2013 and click on the Apply button:

- Notice that the report changes.
The report is now at a stage where we could start modifying column names and representation to make the report more meaningful. We could also add charts. Using the basic functionality and nice autogenerate feature of the Layout Editor, you saw how easy it is to leverage an existing data model to build a quick report. You can see that a published report can contain one or more layouts. Those layouts can stem from templates designed using the Layout Editor or from an uploaded template from one of the software plugins. The standard data format for a template is a Rich Text Format (RTF) file noted by the RTF file extension. This published report could now be embedded in an Oracle BI dashboard in the /analytics portal for user consumption or for quick export to MS Excel, if one is only after the data.
We have gone through a basic example in creating and publishing a report. Go ahead and experiment!
Oracle BI Publisher 12c has the capability to retrieve and analyze data on the way users interact with the tool. As a mainly web- based consumption tool for reporting, users are always logging in to the system, viewing reports, and spending time analyzing data. It's clear that there is a need, from both security compliance and performance improvement perspectives, to collect information regarding how users are using the tool. Since BI Publisher 12c is integrated with Oracle Fusion Middleware, it can leverage the Fusion Middleware Audit Framework.
Spelunking through log files for this information is in the past. The auditing system information can be dumped to a file's system log or a relational database. Clearly with the relational database as the repository, BI Publisher, or some other reporting tool, can easily consume that data feed and put up some quality auditing analytics. This is fairly straightforward to set up and configure. This exercise will walk you through how to achieve this ancillary configuration.
This is fairly straightforward. Two files need to be configured so that BI Publisher can recognize the change for capturing and writing the audit information. The following steps should take place on the server where BI Publisher and the Oracle BI server are installed:
- Locate the
xmlp-server-config.xmlfile. This file is located down the long directory path of$BI_HOMEuser_projectsdomainsbifoundation_ domainconfigbipublisherrepositoryAdminConfiguration. - Edit the
xmlp-server-config.xmlfile using WordPad or a similar program. - Set the following element value properties to true from their default value of false:
MONITORING_ENABLED AUDIT_ENABLED - Add the following element and syntax to the
xmlp-server-config.xmlfile directly before the closing</xmlpConfig>tag:<property name="AUDIT_JPS_INTEGTRATION" value="true" /> - Save and close the
xmlp-server-config.xmlfile.
Your file should look a bit like this:
<?xml version="1.0" encoding="UTF-8" standalone="no"?>
<xmlpConfigxmlns="http://xmlns.oracle.com/oxp/xmlp">
<property name="SAW_SERVER" value=""/>
<property name="SAW_SESSION_TIMEOUT" value="90"/>
 <property name="DEBUG_LEVEL" value="exception"/>
 <property name="SAW_PORT" value=""/>
 <property name="SAW_PASSWORD" value=""/>
 <property name="SAW_PROTOCOL" value="http"/>
 <property name="SAW_VERSION" value="v4"/>
 <property name="SAW_USERNAME" value=""/>
<property name="MONITORING_ENABLED" value="true"/>
<property name="AUDIT_ENABLED" value="true"/>
<property name="AUDIT_JPS_INTEGRATION" value="true"/>
</xmlpConfig>
The FMW Audit Framework will now need to have reference to how BI Publisher handles the collection of its auditing information. Copying the existing BI Publisher audit events file to the common directory, where auditing information can be read, is done in a few simple steps:
- Locate the directory path
$BI_HOMEoracle_commonmodulesoracle. iau_12.2.2components. - N.B. - This path may change depending on your OBIEE version.
- Create a new directory called
xmlpserverin this path and using the native OS make a directory command, for example,mkdir xmlpserver. - If on a Nix OS, be sure to set the read/write permissions according to the same folders existing in this directory.
- Locate the
component_events.xmlfile from$BI_HOMEuser_projects domainsbifoundation_domainconfigbipublisherrepository AdminAudit. - Copy the
component_events.xmlfile to thexmlpserverdirectory created in step 2.