
"It's all about the database" - Anonymous.
No book on Oracle BI would be complete without introducing the concepts of a reporting database.
Just to be clear, Oracle Business Intelligence Enterprise Edition (OBIEE) is neither a database nor a storage system for data. OBIEE grabs data from a source (which is normally a database), and sends it to your screen (or e-mail, PDF, and so on) in a presentable format.
As discussed in previous chapters, the source data can be held in a variety of formats including, but not limited to, spreadsheets, tables, and XML. However, for most large implementations, a database is the only suitable source. If there are millions or even billions of data items, then a database is crucial. Moreover, a well-structured and well-maintained database is essential for the very survival of an OBIEE project. Size matters when it comes to design: the bigger the database, the better the design needs to be; otherwise it will be impossible for your clients to run the reports.
The new big data paradigm challenges our assumption that it is all about the database. This is because of the huge amount of data capture that is taking place in non-structured form. Databases give us nice structured data, but data is now held in semi-structured form, for example in XML documents, or XML streaming of data. Data is also held in unstructured form, such as simple text files, PDF, MS Word documents, and so on. These new formats add to the reporting complexity and may seem exciting now, but do not take away the fundamental fact that structured data in a database is still the easiest to use for reporting.
This chapter can only introduce the main concepts of a reporting database, because the process of creating an efficient database is the subject of dozens of books and blogs (see the recommended reading list). However, the following details should provide enough information to create a database that is fit for use in an Oracle Business Intelligence system.
This chapter is split into three parts:
- A brief introduction to the theory
- Guidelines for creating a warehouse
- Creating a warehouse example
It is said that creating a database is more about art than it is about science. I tend to agree with this. However, a number of theories and rules have evolved over the last 40 years that are worth understanding before attempting to build a database for an Oracle Business Intelligence system.
From an overall design perspective, there are two scientific types of database:
- Transactional databases
- Reporting databases
A transactional database is designed for the input and update of data, usually in small, high volume changes to the data; whereas a reporting database is designed for fast access to data, which can be transformed into useful information for decision-making. The common name for a reporting database is the data warehouse (a phrase originally coined by Bill Inmon, the inventor of data warehousing).
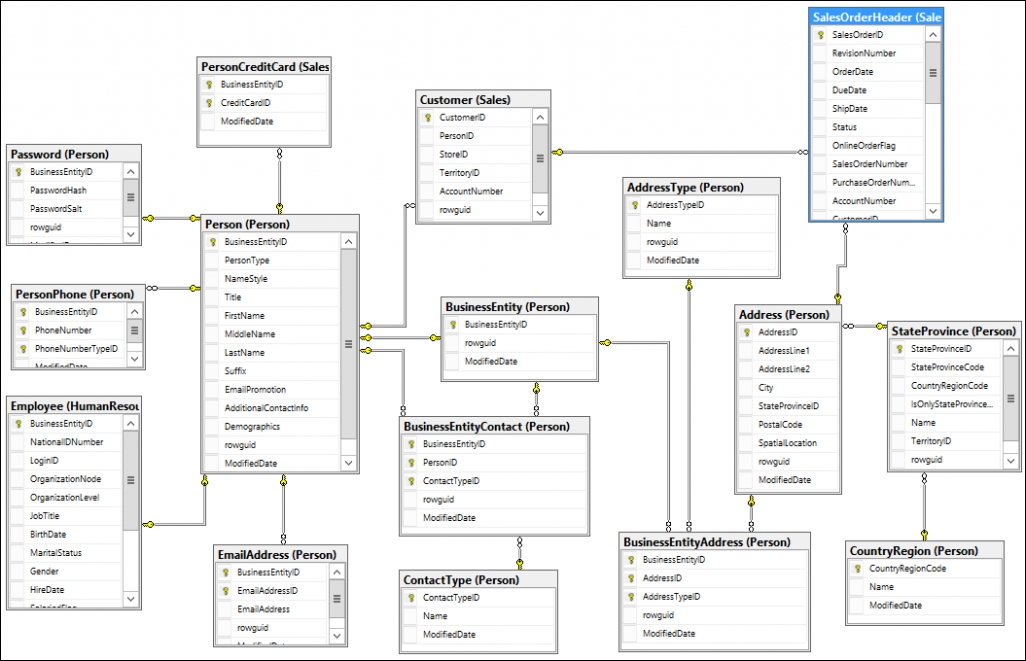
The following diagram shows how tables in a transactional model are laid out. It shows a small extract of the system that will be used throughout this book, and is based on a Microsoft AdventureWorks system:
The following diagram shows an example of the structure of a reporting database. You can see how it contrasts in the way the tables are joined together. There are fewer tables, all joined via a single table (known as the Fact table), in this example the FactFinance table:

There are two main theories for the design of a reporting database:
- Relational modeling
- Dimensional modeling
The layout of data in relational modeling is similar to that of a transactional system, that is, third normal form. These types of warehouse are normally intended to populate smaller databases for operational reporting, or Operational Data Store (ODS). An Operational Data Store is a type of database that is usually used as an interim storage area prior to loading a corporate warehouse or for processing data and then loading data back into a source system. They are often multi-departmental level and typically data is checked against a set of rules, and updated in batches. They do not contain history and are not designed for large scale reporting.
Note
A note on normalization:The early development of theories of database design is dominated by E. Codd, whose works in the 1970s inspired a generation of new databases, including Oracle. In 1969, Codd proposed a relational model, which essentially ensured that tables in the database contain specialist data, such as customer names or sale orders, and that these tables relate to each other using a key field. In 1970 he expanded the theory to include normalization. The process of normalizing a database consists of reducing tables down to their smallest size, both in columns and rows, by breaking them down into smaller tables. The objective is to remove data replication. Codd's theories on normalization and the 12 rules of database construction that he created in the 1980s still apply today. I recommend that anyone serious about building large scale Oracle BI systems read his work; or at least the summaries! Sources:
http://en.wikipedia.org/wiki/E.F._Codd
http://en.wikipedia.org/wiki/Database_normalization
http://www.dbnormalization.com/difinitions-of-the-normal-forms
Dimensional modeling was proposed by Ralph Kimball in the mid-1990s as a method of speeding up report production and simplifying the database layer. The model is a response to the large complex relational databases (also known as Entity Relational or ER databases).
Kimball published papers that showed why ER databases are not suitable for reporting:
"In our zeal to make transaction processing efficient, we have lost sight of our original, most important goal. We have created databases that cannot be queried! Even a simple order-taking system creates a database of dozens of tables that are linked together by a bewildering spider web of joins."
Kimball, 'A Dimensional Modeling Manifesto,'Kimball Group - http://www.kimballgroup.com/1997/08/a-dimensional-modeling-manifesto/
The main advantage of Kimball's dimensional modeling is that it reduces the number of tables and joins, which in theory, results in a faster query run-time, and a much simpler model for report developers to work with.
Dimensional modeling actually consists of tables of dimensions and a table of facts:
- Dimension tables hold information that is largely non-numeric, that is, descriptive text, dates, references, and so on. The records are related to an entity, such as a tennis player and usually represent an aspect of the data stored in the Fact table.
- The table of facts holds data that can be aggregated, for example, counted, summed, averaged, or some other calculation. The facts records are normally transaction or activity-related, such as person's holiday record.
The Date table is an example of a table of the dimension type. It contains a list of dates, each of which is defined by a number of descriptive fields, or attributes, which could include Month Name and Year, for example.
Dimension tables can also contain columns that are structured to represent a hierarchy, that is, the relationship between different attributes within the dimension. For example, one possible hierarchy in the Date table is represented by the fields Year Number, Quarter Number, Month Name, and Date. This hierarchy has four levels, with Year at the top and Date at the bottom (most detailed) level.
An example of a Fact table is a table recording Daily Sales by Store. In this example, the Fact table might contain three columns recording the Date, Store Name, and Sales Amount.
Tables in a dimensional database are normally joined together by linking the dimensions to the facts. This is known as a star schema model, and is shown in the following diagram. The joins between the tables are using key fields. The key field on the dimension will be the primary key for that table, and the key fields on the facts are foreign keys.
As you can see, dimensional modeling enables a much less complicated layout than the relational modeling system, and has fewer joins. The Dimension tables (labeled with the prefix Dim) only join to the Fact table, which sits centrally:

The introduction to the theories behind the relational database may seem a little dry, and you may be wondering why we are looking at the theories of databases in an OBIEE book. But for every single project you undertake, it is essential that you have a good understanding of the data structures that you will be using, particularly when designing the OBI repository. If you want your project to succeed, then speed is crucial; but this is only achievable with the correct design. Choosing the correct design is therefore crucial, which means understanding the theory.
In this book, you are using dimensional modeling in the OBIEE configuration. It is also worth mentioning that there are other models that can help certain types of reporting. This includes OLAP cube models and column-based databases, both of which are worth reading up on, but are not covered in this book.