
Let's look at how to animate a bubble plot. This is useful when you want to visualize data that's transient and dynamic.
- Create a new Python file, and import the following packages:
import numpy as np
import matplotlib.pyplot as plt
from matplotlib.animation import FuncAnimation
- Let's define a
trackerfunction that will dynamically update the bubble plot:def tracker(cur_num): # Get the current index cur_index = cur_num % num_points - Define the color:
# Set the color of the datapoints datapoints['color'][:, 3] = 1.0 - Update the size of the circles:
# Update the size of the circles datapoints['size'] += datapoints['growth'] - Update the position of the oldest datapoint in the set:
# Update the position of the oldest datapoint datapoints['position'][cur_index] = np.random.uniform(0, 1, 2) datapoints['size'][cur_index] = 7 datapoints['color'][cur_index] = (0, 0, 0, 1) datapoints['growth'][cur_index] = np.random.uniform(40, 150) - Update the parameters of the scatterplot:
# Update the parameters of the scatter plot scatter_plot.set_edgecolors(datapoints['color']) scatter_plot.set_sizes(datapoints['size']) scatter_plot.set_offsets(datapoints['position']) - Define the
mainfunction and create an empty figure:if __name__=='__main__': # Create a figure fig = plt.figure(figsize=(9, 7), facecolor=(0,0.9,0.9)) ax = fig.add_axes([0, 0, 1, 1], frameon=False) ax.set_xlim(0, 1), ax.set_xticks([]) ax.set_ylim(0, 1), ax.set_yticks([]) - Define the number of points that will be on the plot at any given point of time:
# Create and initialize the datapoints in random positions # and with random growth rates. num_points = 20 - Define the datapoints using random values:
datapoints = np.zeros(num_points, dtype=[('position', float, 2), ('size', float, 1), ('growth', float, 1), ('color', float, 4)]) datapoints['position'] = np.random.uniform(0, 1, (num_points, 2)) datapoints['growth'] = np.random.uniform(40, 150, num_points) - Create the scatterplot that will be updated every frame:
# Construct the scatter plot that will be updated every frame scatter_plot = ax.scatter(datapoints['position'][:, 0], datapoints['position'][:, 1], s=datapoints['size'], lw=0.7, edgecolors=datapoints['color'], facecolors='none') - Start the animation using the
trackerfunction:# Start the animation using the 'tracker' function animation = FuncAnimation(fig, tracker, interval=10) plt.show() - The full code is in the
dynamic_bubble_plot.pyfile that's already provided to you. If you run this code, you will see the following figure: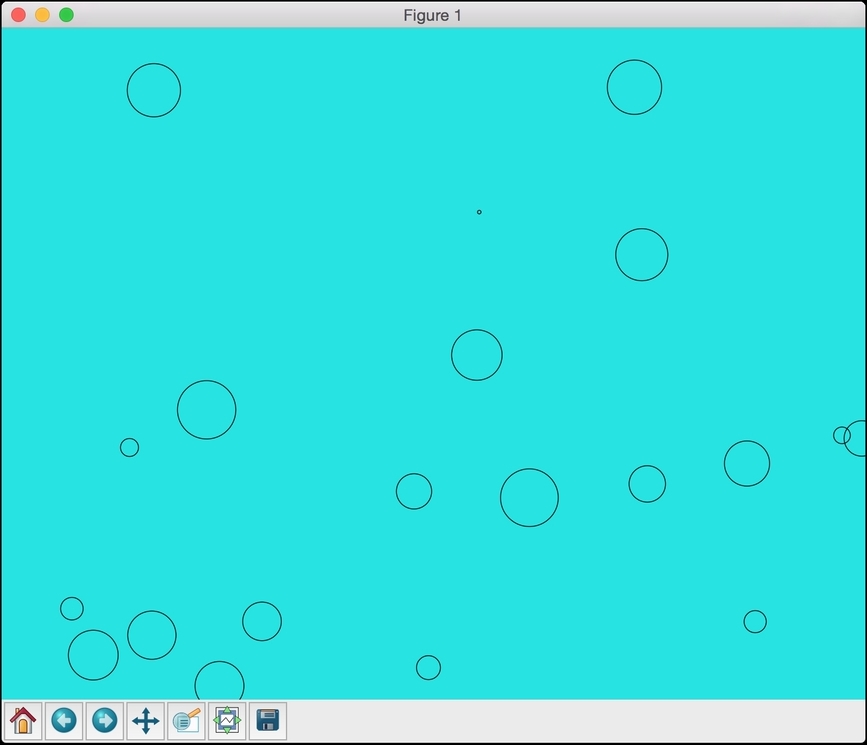
..................Content has been hidden....................
You can't read the all page of ebook, please click here login for view all page.