
Are all the features equally important? In this case, we used 13 input features, and they all contributed to the model. However, an important question here is, "How do we know which features are more important?" Obviously, all the features don't contribute equally to the output. In case we want to discard some of them later, we need to know which features are less important. We have this functionality available in scikit-learn.
- Let's plot the relative importance of the features. Add the following lines to
housing.py:plot_feature_importances(dt_regressor.feature_importances_, 'Decision Tree regressor', housing_data.feature_names) plot_feature_importances(ab_regressor.feature_importances_, 'AdaBoost regressor', housing_data.feature_names)The regressor object has a callable
feature_importances_method that gives us the relative importance of each feature. - We actually need to define our
plot_feature_importancesfunction to plot the bar graphs:def plot_feature_importances(feature_importances, title, feature_names): # Normalize the importance values feature_importances = 100.0 * (feature_importances / max(feature_importances)) # Sort the index values and flip them so that they are arranged in decreasing order of importance index_sorted = np.flipud(np.argsort(feature_importances)) # Center the location of the labels on the X-axis (for display purposes only) pos = np.arange(index_sorted.shape[0]) + 0.5 # Plot the bar graph plt.figure() plt.bar(pos, feature_importances[index_sorted], align='center') plt.xticks(pos, feature_names[index_sorted]) plt.ylabel('Relative Importance') plt.title(title) plt.show() - We just take the values from the
feature_importances_method and scale it so that it ranges between 0 and 100. If you run the preceding code, you will see two figures. Let's see what we will get for a decision tree-based regressor in the following figure: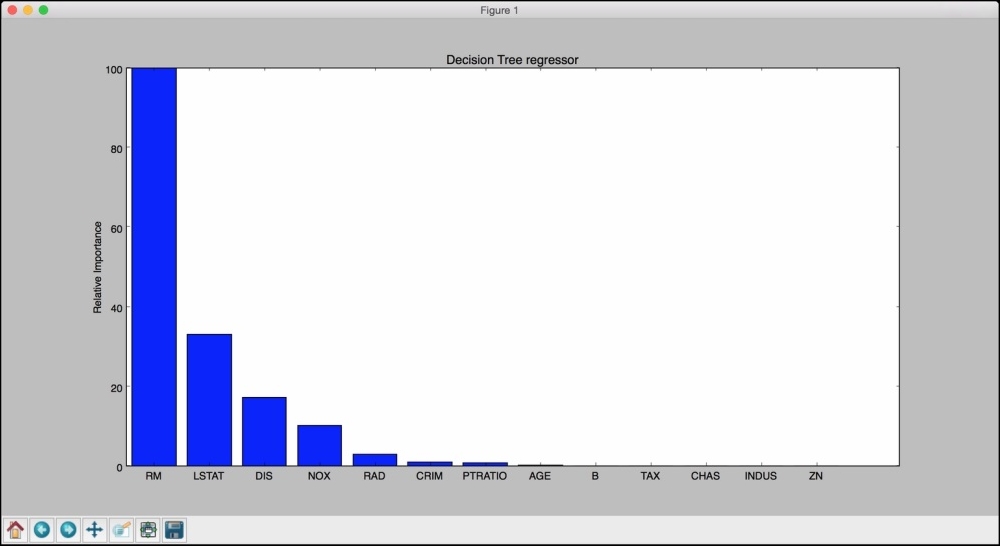
- So, the decision tree regressor says that the most important feature is RM. Let's take a look at what AdaBoost has to say in the following figure:
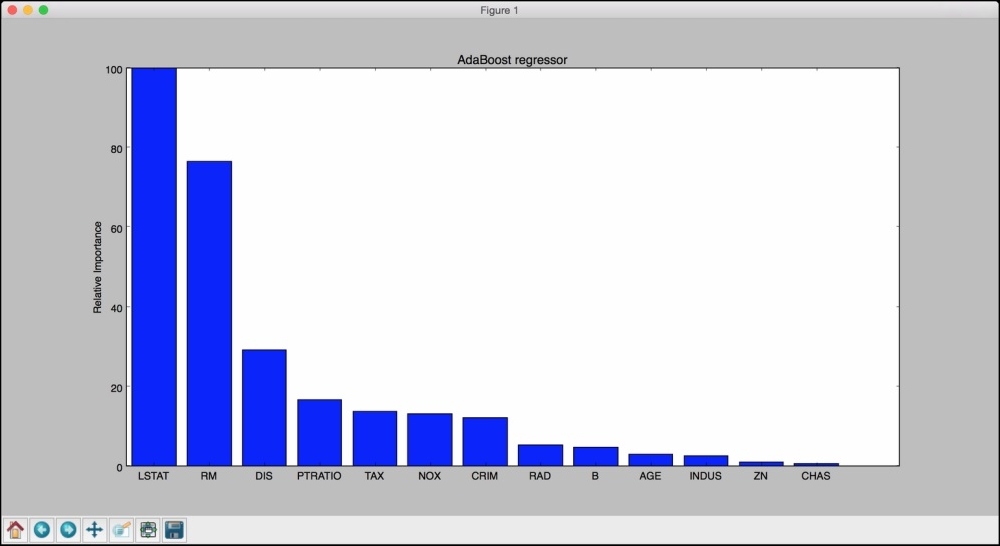
According to AdaBoost, the most important feature is LSTAT. In reality, if you build various regressors on this data, you will see that the most important feature is in fact LSTAT. This shows the advantage of using AdaBoost with a decision tree-based regressor.