We used random forests to build a classifier in the previous recipe, but we don't exactly know how to define the parameters. In our case, we dealt with two parameters: n_estimators and max_depth. They are called hyperparameters, and the performance of the classifier depends on them. It would be nice to see how the performance gets affected as we change the hyperparameters. This is where validation curves come into picture. These curves help us understand how each hyperparameter influences the training score. Basically, all other parameters are kept constant and we vary the hyperparameter of interest according to our range. We will then be able to visualize how this affects the score.
- Add the following code to the same Python file, as in the previous recipe:
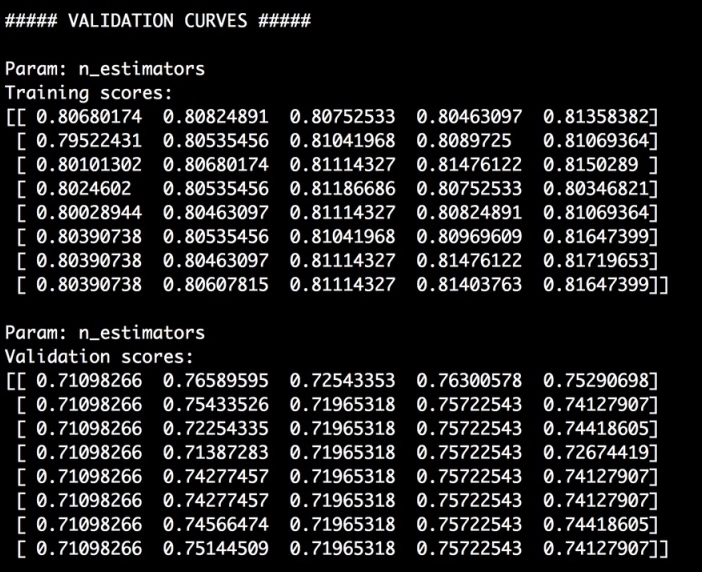
# Validation curves

from sklearn.learning_curve import validation_curve

classifier = RandomForestClassifier(max_depth=4, random_state=7)
parameter_grid = np.linspace(25, 200, 8).astype(int)
train_scores, validation_scores = validation_curve(classifier, X, y,
        "n_estimators", parameter_grid, cv=5)
print "
##### VALIDATION CURVES #####"
print "
Param: n_estimators
Training scores:
", train_scores
print "
Param: n_estimators
Validation scores:
", validation_scores
In this case, we defined the classifier by fixing the
max_depthparameter. We want to estimate the optimal number of estimators to use, and so have defined our search space usingparameter_grid. It is going to extract training and validation scores by iterating from 25 to 200 in eight steps. - If you run it, you will see the following on your Terminal:
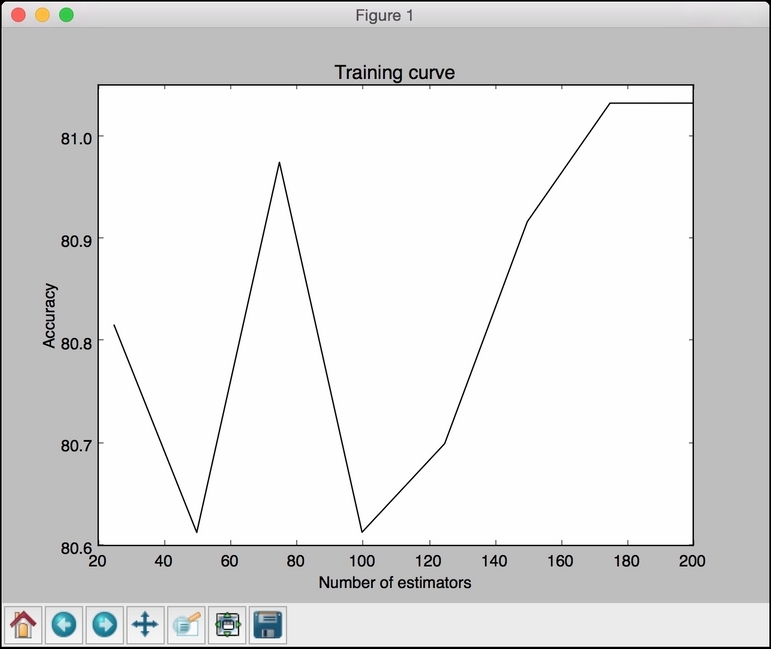
- Let's plot it:
# Plot the curve plt.figure() plt.plot(parameter_grid, 100*np.average(train_scores, axis=1), color='black') plt.title('Training curve') plt.xlabel('Number of estimators') plt.ylabel('Accuracy') plt.show() - Here is the figure that you'll get:
- Let's do the same for the
max_depthparameter:classifier = RandomForestClassifier(n_estimators=20, random_state=7) parameter_grid = np.linspace(2, 10, 5).astype(int) train_scores, valid_scores = validation_curve(classifier, X, y, "max_depth", parameter_grid, cv=5) print " Param: max_depth Training scores: ", train_scores print " Param: max_depth Validation scores: ", validation_scoresWe fixed the
n_estimatorsparameter at 20 to see how the performance varies withmax_depth. Here is the output on the Terminal: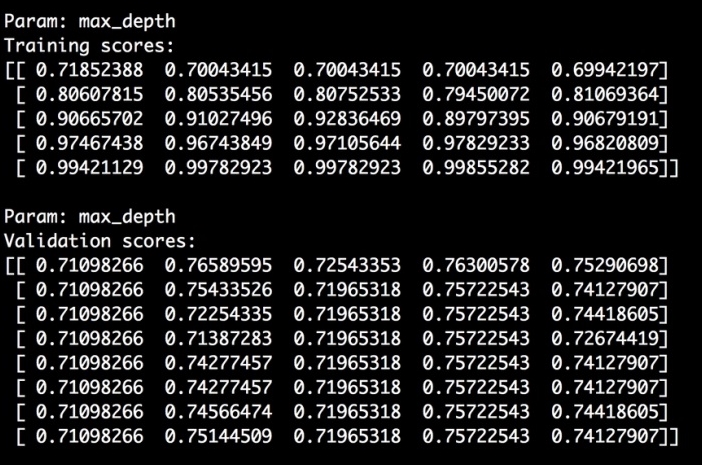
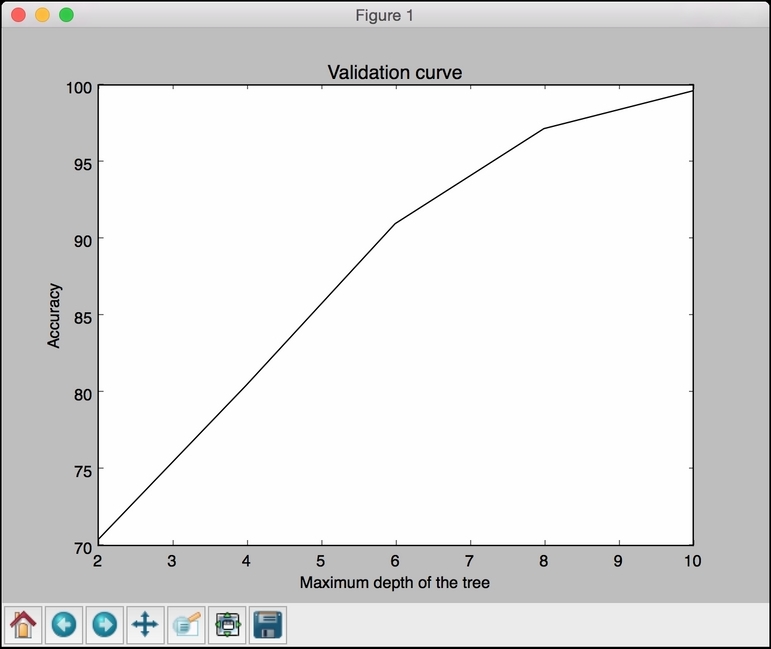
- Let's plot it:
# Plot the curve plt.figure() plt.plot(parameter_grid, 100*np.average(train_scores, axis=1), color='black') plt.title('Validation curve') plt.xlabel('Maximum depth of the tree') plt.ylabel('Accuracy') plt.show() - If you run this code, you will get the following figure: