
In iWork, charts, graphs, and tables can be created in Numbers and Pages.
If you start using iWork with Pages and ignore the other two components of iWork—Keynote (presentations) and Numbers (spreadsheets)—just because you may not need them, it may not even occur to you that they work together, not separately.
Charts can be created without leaving Pages.
- Click on the Charts icon in the toolbar and choose the type of chart you want.
- From Insert, in the top menu of the screen, choose Chart and the type of chart.
Charts come in either 2D or 3D styles. When you type in data, the chart updates its appearance automatically.
However, the templates and tools included in Numbers may make it easier to create your chart in Numbers and then copy and paste it into your Pages document.
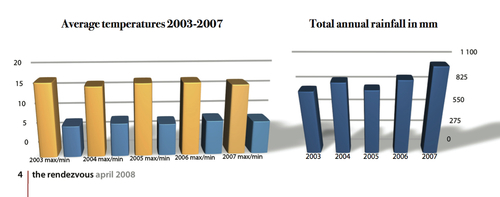
You may only discover this when actually working on your project. In our magazine, there was a feature on local weather patterns. We had created a rather boring spreadsheet in Numbers. But when we added the chart and copied and pasted it into the magazine page—which was being laid out as a Pages document—and then resized and moved it into place, it looked great!
The current version, iWork '09, gives Charts in Pages practically the same tools that you find in Numbers, including the impressive choice of colors and textures. However, you may find it easier to open a Numbers document, create a chart, and then paste it into a Pages project. This way you can avoid clutter and have the advantage of using a more specialized toolbar.
A chart created in Numbers and pasted into Pages stays linked to data entered while you were working in Numbers. To update the chart in Pages:
- Go back to Numbers.
- Edit data.
- Save the document.
- Go to Pages and click on the Refresh button. No need to copy and paste the updated chart again.
What is interesting here is that the graphic images created in Numbers files display the same high quality as Pages once they have been converted into press-quality PDFs.
The charts printed on glossy paper in our magazine, the Rendezvous, looked stunning, showcasing the wonderfully mild and stable Normandy climate.