
When you run a Spark application on YARN, there is an option that you can enable by modifying yarn-env.sh:
YARN_OPTS="-agentlib:jdwp=transport=dt_socket,server=y,suspend=n,address=4000 $YARN_OPTS"
Now, the remote debugging will be available through port 4000 on your Eclipse or IntelliJ IDE. The second option is by setting the SPARK_SUBMIT_OPTS. You can use either Eclipse or IntelliJ to develop your Spark applications that can be submitted to be executed on remote multinode YARN clusters. What I do is that I create a Maven project on Eclipse or IntelliJ and package my Java or Scala application as a jar file and then submit it as a Spark job. However, in order to attach your IDE such as Eclipse or IntelliJ debugger to your Spark application, you can define all the submission parameters using the SPARK_SUBMIT_OPTS environment variable as follows:
$ export SPARK_SUBMIT_OPTS=-agentlib:jdwp=transport=dt_socket,server=y,suspend=y,address=4000
Then submit your Spark job as follows (please change the values accordingly based on your requirements and setup):
$ SPARK_HOME/bin/spark-submit
--class "com.chapter13.Clustering.KMeansDemo"
--master yarn
--deploy-mode cluster
--driver-memory 16g
--executor-memory 4g
--executor-cores 4
--queue the_queue
--num-executors 1
--executor-cores 1
--conf "spark.executor.extraJavaOptions=-agentlib:jdwp=transport=dt_socket,server=n,address= host_name_to_your_computer.org:4000,suspend=n"
--driver-java-options -agentlib:jdwp=transport=dt_socket,server=y,suspend=y,address=4000
 KMeans-0.0.1-SNAPSHOT-jar-with-dependencies.jar
Saratoga_NY_Homes.txt
After running the preceding command, it will wait until you connect your debugger, as shown in the following: Listening for transport dt_socket at address: 4000. Now you can configure your Java remote application (Scala application will work too) on the IntelliJ debugger, as shown in the following screenshot:
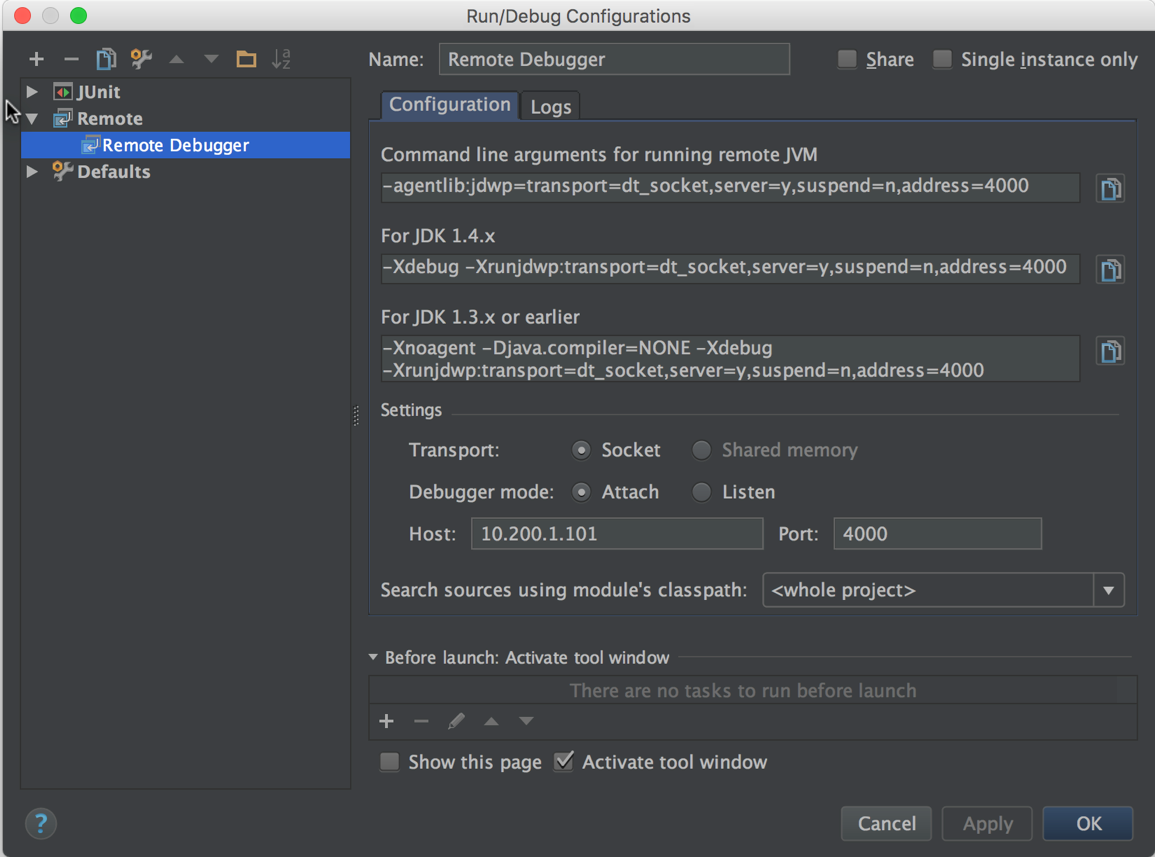
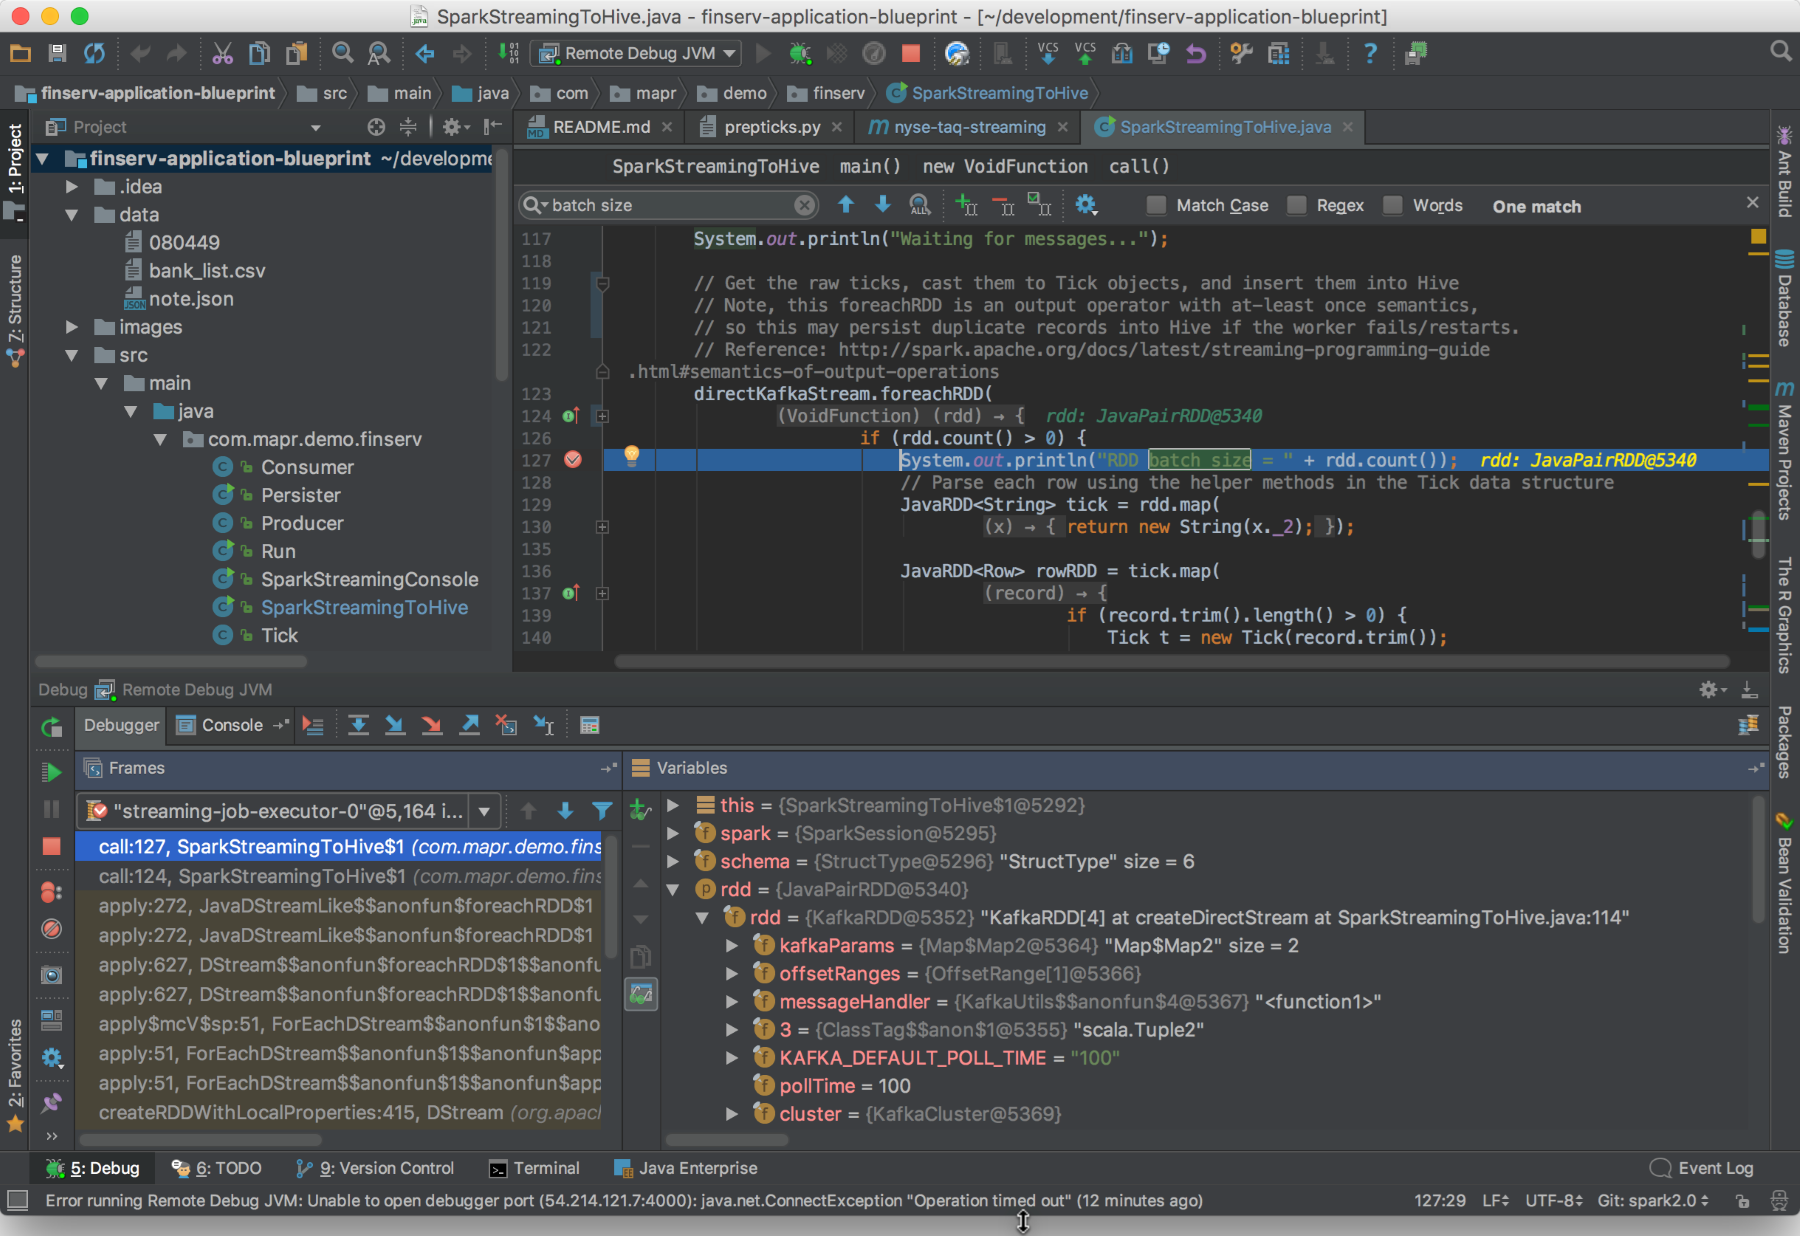
For the preceding case, 10.200.1.101 is the IP address of the remote computing node where your Spark job is basically running. Finally, you will have to start the debugger by clicking on Debug under IntelliJ's Run menu. Then, if the debugger connects to your remote Spark app, you will see the logging info in the application console on IntelliJ. Now if you can set the breakpoints and the rests of them are normal debugging. The following figure shows an example how will you see on the IntelliJ when pausing a Spark job with a breakpoint:
Although it works well, but sometimes I experienced that using SPARK_JAVA_OPTS won't help you much in the debug process on Eclipse or even IntelliJ. Instead, use and export SPARK_WORKER_OPTS and SPARK_MASTER_OPTS while running your Spark jobs on a real cluster (YARN, Mesos, or AWS) as follows:
$ export SPARK_WORKER_OPTS="-Xdebug -Xrunjdwp:server=y,transport=dt_socket,address=4000,suspend=n"
$ export SPARK_MASTER_OPTS="-Xdebug -Xrunjdwp:server=y,transport=dt_socket,address=4000,suspend=n"
Then start your Master node as follows:
$ SPARKH_HOME/sbin/start-master.sh
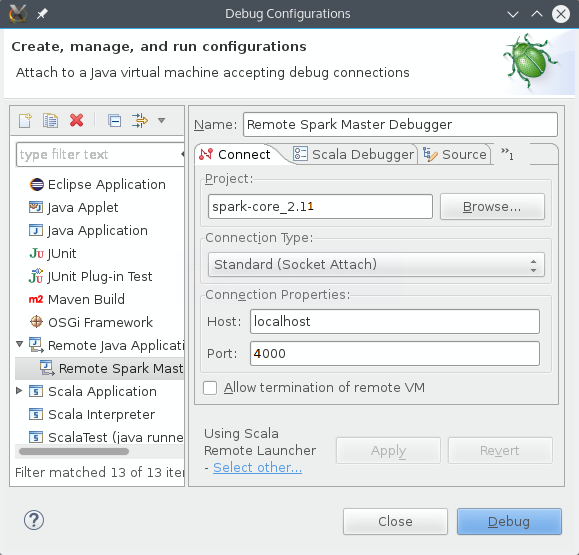
Now open an SSH connection to your remote machine where the Spark job is actually running and map your localhost at 4000 (aka localhost:4000) to host_name_to_your_computer.org:5000, assuming the cluster is at host_name_to_your_computer.org:5000 and listening on port 5000. Now that your Eclipse will consider that you're just debugging your Spark application as a local Spark application or process. However, to make this happen, you will have to configure the remote debugger on Eclipse, as shown in the following figure:
That's it! Now you can debug on your live cluster as if it were your desktop. The preceding examples are for running with the Spark Master set as YARN-client. However, it should also work when running on a Mesos cluster. If you're running using YARN-cluster mode, you may have to set the driver to attach to your debugger rather than attaching your debugger to the driver since you won't necessarily know in advance what mode the driver will be executing on.