Show the column names in the SparkDataFrame as follows:
columns(flightDF)
[1] "year" "month" "day" "dep_time" "dep_delay" "arr_time" "arr_delay" "carrier" "tailnum" "flight" "origin" "dest"
[13] "air_time" "distance" "hour" "minute"
Show the number of rows in the SparkDataFrame as follows:
count(flightDF)
[1] 336776
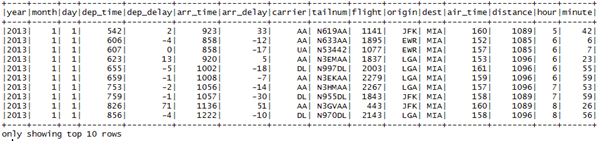
Filter flights data whose destination is only Miami and show the first six entries as follows:
showDF(flightDF[flightDF$dest == "MIA", ], numRows = 10)
The output is as follows:
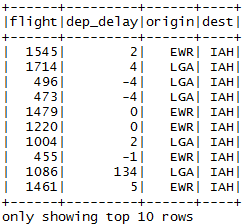
Select specific columns. For example, let's select all the flights that are going to Iowa that are delayed. Also, include the origin airport names:
delay_destination_DF<- select(flightDF, "flight", "dep_delay", "origin", "dest")
 delay_IAH_DF<- filter(delay_destination_DF, delay_destination_DF$dest == "IAH") showDF(delay_IAH_DF, numRows = 10)
The output is as follows:
We can even use it to chain data frame operations. To show an example, at first, group the flights by date and then find the average daily delay. Then, finally, write the result into a SparkDataFrame as follows:
install.packages(c("magrittr"))
library(magrittr)
groupBy(flightDF, flightDF$day) %>% summarize(avg(flightDF$dep_delay), avg(flightDF$arr_delay)) ->dailyDelayDF
Now print the computed DataFrame:
head(dailyDelayDF)
The output is as follows:

Let's see another example that aggregates average arrival delay for the entire destination airport:
avg_arr_delay<- collect(select(flightDF, avg(flightDF$arr_delay)))
 head(avg_arr_delay)
avg(arr_delay)
 1 6.895377
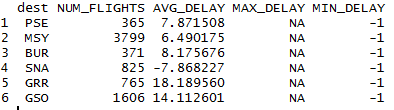
Even more complex aggregation can be performed. For example, the following code aggregates the average, maximum, and minimum delay per each destination airport. It also shows the number of flights that land in those airports:
flight_avg_arrival_delay_by_destination<- collect(agg(
 groupBy(flightDF, "dest"),
 NUM_FLIGHTS=n(flightDF$dest),
 AVG_DELAY = avg(flightDF$arr_delay),
 MAX_DELAY=max(flightDF$arr_delay),
 MIN_DELAY=min(flightDF$arr_delay)
 ))
head(flight_avg_arrival_delay_by_destination)
The output is as follows: