
The first thing to do when monitoring a new network is to find out what is running over it. There are various types of applications and network protocols, and they can influence and interfere with each other when all of them are running over the network.
In some cases, you will have different VLANs, different Virtual Routing and Forwarding (VRFs), or servers that are connected to virtual ports in a Bladeserver. Eventually everything is running on the same infrastructure, and they can influence each other.
Tip
There is a common confusion between VRFs and VLANs. Even though their purpose is quite the same, they are configured in different places. While VLANs are configured in the LAN in order to provide network separation in the OSI layers 1 and 2, VRFs are multiple instances of routing tables to make them co-exist in the same router. This is a layer 3 operation that separates between different customer's networks. VRFs are used in Multi Protocol Label Switching (MPLS) to provide layer 3 connectivity to different customers over the same router's network, in such a way that no customer can see any other customer's network.
In this recipe, we will see how to get to the details of what is running over the network, and the applications that can slow it down.
When you get into a new network, the first thing to do is connect Wireshark to sniff what is running over the network. Make sure you follow these points:
- When you are required to monitor a server, port mirror it and see what is running on its connection to the network.
- When you are required to monitor a remote office, port mirror the router port that connects you to the WAN connection. Then, check what is running over it.
- When you are required to monitor a slow connection to the Internet, port mirror it to see what is going on there.
In this recipe, we will see how to use the Wireshark tools for analyzing what is running and what can cause the problems.
For analyzing who is talking, follow these steps:
- Connect Wireshark using one of the options mentioned in the previous section.
- You can use the following tools:
- In the Protocol Hierarchy feature, you will get a window that will help you analyze who is talking over the network. It is shown in the following screenshot:
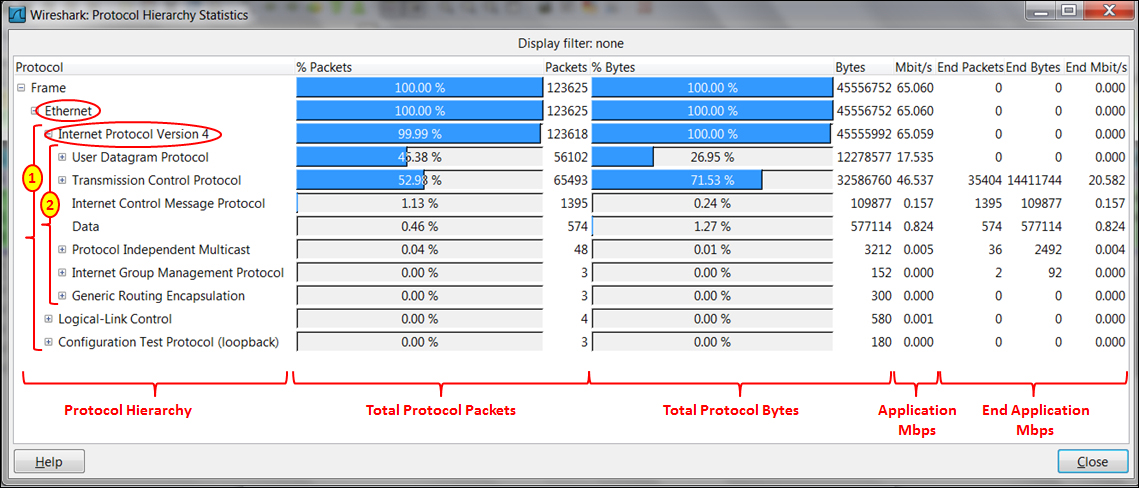
- In the screenshot you can see the protocol distribution:
- Ethernet: IP, Logical-Link Control (LLC) and Configuration Test Protocol (loopback)
- Internet Protocol Version 4: User Datagram Protocol (UDP), Transport Control Protocol (TCP), Protocol Independent Multicast (PIM), Internet Group Management Protocol (IGMP), and Generic Routing Encapsulation Protocol (GRE)
- If you click on the + sign, all underlying protocols will be shown.
- To see a specific protocol throughput, click down to the protocols as shown in the following screenshot. You will see the application average throughput during the capture (HTTP in this example):
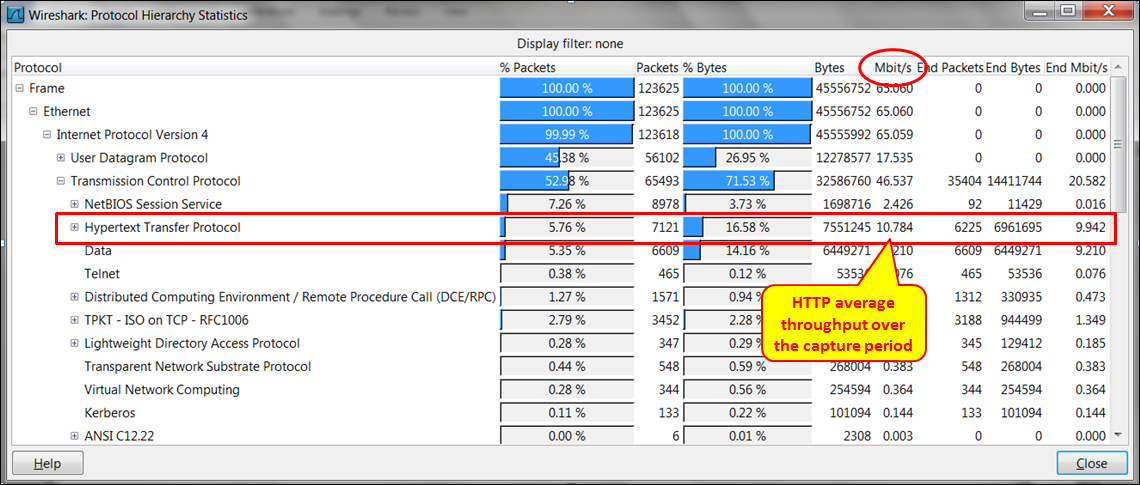
- Clicking on the + sign to the left of HTTP will open a list of protocols that run over HTTP (XML, MIME, JavaScripts, and more) and their average throughput during the capture period.
In some cases (especially when you need to prepare management reports), you are required to provide a graphical picture of the network statistics. There are various sources available for this, for example:
- Etherape (for Linux): http://etherape.sourceforge.net/
- Compass (for Windows): http://download.cnet.com/Compass-Free/3000-2085_4-75447541.html?tag=mncol;1 (from Wildpackets)