
In this chapter, you will learn how to analyze wireless traffic and pinpoint any problems. You will also learn how to analyze wireless traffic using Wireshark. The following are the topics we will cover in this chapter:
- Understanding IEEE 802.11 traffic
- Analyzing normal and unusual behavior
- Lab up—wireless communication
- Decrypting encrypted wireless traffic
- Lab up—decrypting WEP and WPA traffic
- Practice questions
We start from the basics such as how WLAN traffic gets generated and various essential elements responsible for handling the wireless transmission between hosts. Then, moving ahead, we will analyze the usual and unusual forms of packets that can be seen in Wireshark. Side by side, we will identify anomalies and regular traffic patterns. We will also discuss how you can decrypt wireless (WEP) traffic using Wireshark, which can definitely give an advantage while auditing WLAN environment.
What we are going to witness is not much different from the wired networking that we saw earlier; here, we will be quite concerned with the medium through which packets are flying around us. The two layers at the bottom of the OSI model are important as they represent the data link and the physical layer. The data link layer is divided into two parts: Logical Link Control (LLC) and Media Access Control (MAC).
At the Institute of Electrical and Electronics Engineer (IEEE), there are several committees working together on several projects, and one of these is 802, which is responsible for developing LAN standards. A free white paper can be downloaded from the IEEE website based on 802 standards. Specifically, 802.11 contains WLAN standards. If you want to analyze what normal traffic looks like, you should be aware of the standards and the present working technologies within 802.11.
There are a couple of 802.11 standards, but the few important ones that we should know about are 802.11b, 802.11a, 802.11g, and 802.11n, which are explained in the following list:
- 802.11: This only supports a network bandwidth of 1-2 Mbps. This is the reason why many 802.11-compatible devices have become obsolete. Hence, it became necessary to develop other 802.11 standards.
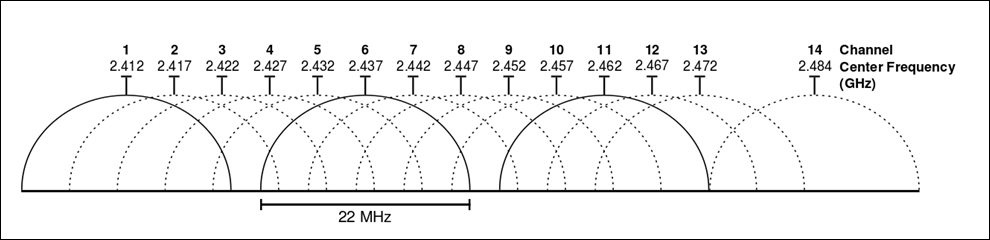
- 802.11b: This specification uses a signaling frequency of 2.4 Ghz that is similar to the 802.11 standard. A maximum of 11 Mbit transmission rate can be achieved over a 2.4 Ghz band using b specification. As most of the home appliances (microwave, cordless phones, and so on) work over a 2.4 Ghz spectrum, it causes quite dense interference and congestion during WLAN packets transmission. To avoid the interference, the access points can be installed at a reasonable distance. The 802.11b band is divided into 14 overlapping channels, where every channel has 22 Mhz widths. In one instance, there can be a maximum of three non-overlapping channels operating at the same time. This space separation is necessary and required in order to let the channels operate individually. One device can be part of one channel at a time; the same follows when you listen to the packets. Practically, it is possible now to sniff more than one channel at a time, which is facilitated through various tools that are now available; one of them is Kismet, which can sniff up to 10 channels at regular short intervals.
- 802.11a: This is based on Orthogonal Frequency Division Multiplexing (OFDM) that was released in 1999 and supports a maximum transmission rate up to 54 Mbps, which also gives us an advantage over 802.11b congested bands. This specification was developed as a second standard to 802.11 standards. It is commonly used in business environments, but because of its high cost, the b specification is not best suited for home environments. Though it supports higher speeds around 5 Ghz spectrums than 802.11b, the range of devices falls short if it is configured with a specification. The capability of bypassing the obstructions that comes in between is not better than 802.11b. There is no channel overlap that happens in 802.11a. A higher regulated frequency helps in preventing the interferences caused by devices that work on 2.4 Ghz spectrums.
- 802.11g: Somewhere around the middle of 2002, this specification came into existence, and this tried combining the best features of 802.11a and 802.11b. The signaling frequency used here is 2.4 Ghz, and the bandwidth it supports is upto 54 Mbps. Due to the 2.4 Ghz frequency in use, the range parameter that suffered a decline was improvised. The 802.11g also supports backward compatibility, which means that all 802.11g access points will support network adapters using 802.11b and vice versa. A strong point in this specification is: it won't get easily obstructed.
- 802.11n: To improve further, the wireless N was introduced. The key area where the improvement was carried on is the range and the transfer rates. The base technology that is implemented to make all this possible is Multiple-Input Multiple-output (MIMO) communication. There are multiple antennas fitted into the access point that are used to send, receive, and bounce off the signals. This enables a channel frequency of 40 Mhz. The final version of this specification, which was released in 2007, stated a transfer rate up to 600 Mbps. It can be configured with 2.4 or 5 Ghz (if the access point is compatible with both); it can use both frequencies at the same time, thus enabling backward compatibility with network adapters. A maximum of four antennas can be used with the MIMO technology. Once all of this starts working together, users can experience fastest speed and maximum signaling range, and it's not much affected by another device working on the same frequency band. If this network type gets inferred, then it will other specifications such as 802.11b/g.
WLANs uses the Carrier Sense Multiple Access and Collision Avoidance protocol (CSMA/CA) to manage the stations sending data, where every host that wants to send data is supposed to listen to the channel first, that is, if it is free, then the host can go ahead and send the packet; if not, then the host has to wait for its turn. This is because the same medium is being shared by every host, thus avoiding collisions that might happen if two hosts start transmitting at the same time, as a result making the performance of the network go slow and more prone to errors. The 802.11 architecture is composed of several components such as a station (STA), a wireless access point (AP), basic service set (BSS), extended service set (ESS), independent basic service set (IBSS), and distribution system (DS).
There are four common modes of association between the STA and the AP, which are as follows:
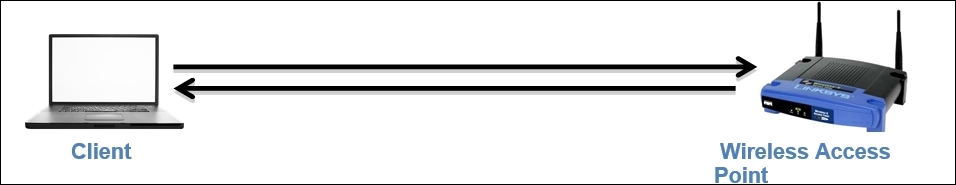
- Infrastructure/managed mode: A wireless network environment where two devices wish to connect an STA and an AP to share data and network resources is termed as the infrastructure mode. An AP is defined with a Service Set Identifier (SSID), which is actually just a name given to the access point for identification purpose (for security reasons, sometimes, broadcasting an SSID can be disabled, which will prevent your wireless network from being discovered by unintended users). For example, once you start scanning for available Wi-Fi networks around you to connect to, you'll be shown multiple network names, from which you are supposed to choose a network that you know about. All these names of networks are called SSID. Another useful term to know is Base Service Set Identifier (BSSID), that is, the access point's MAC address. By default, every access point is supposed to broadcast the SSID and transmit a beacon frame 10 times in a second to let devices know that they are ready to accept connections. Refer to the following diagram that illustrates this example:
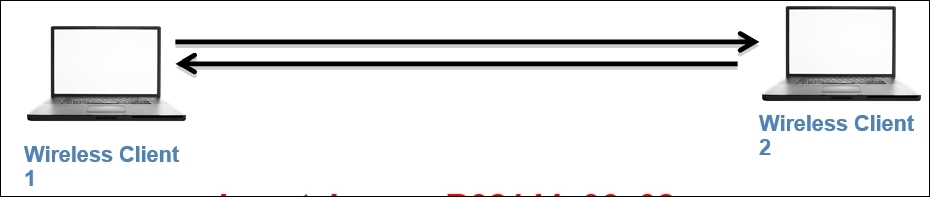
- Ad Hoc mode: In this kind of network, a peer-to-peer network is formed where two clients are connected to each other. The packets sent and received by the wireless clients are not relayed to the access point. The clients taking part in this communication now handle the process of sending beacons and processing authentication that a WAP handles in normal scenarios.
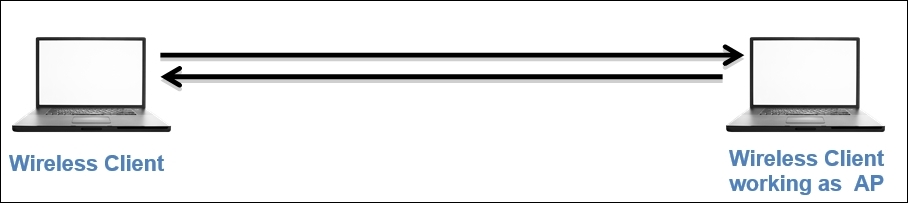
- Master mode: When the NIC card in your machine lets you become an AP, this is what the master mode is all about. Higher-end devices have a capability to act like access points, and this is possible when NIC cards start working together with a special driver.
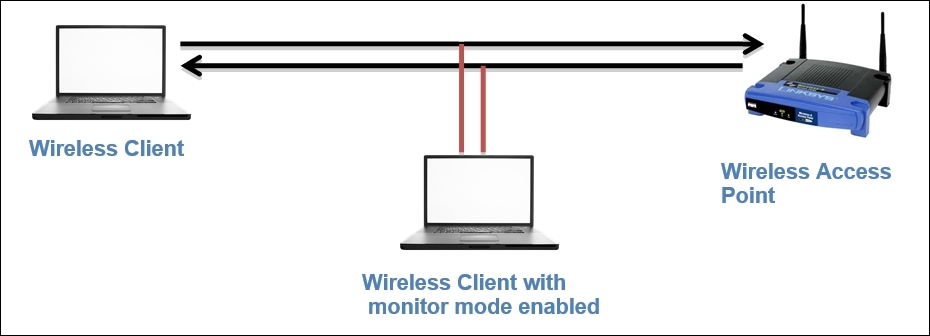
- Monitor mode: For the purpose of this chapter, this mode is very important. This mode is used to listen to the packets that are flying around; when the monitor mode is activated, your device will stop transmitting and receiving any packets and it will just sit silently and sniff live traffic. If you want to capture packets from the wireless network concerning 802.11 protocols, then your NIC and the driver that is being used must support the monitor mode. It is quite easy to activate the monitor mode on an OS, such as Linux and MAC; however, with Windows, it becomes quite troublesome to activate the monitor mode. This mode is often termed as the Radio Frequency Monitor Mode (RFMON).
After learning the basics of different forms of wireless networking infrastructures that you might note in a production environment very casually, it would definitely become a bit easier for you to choose between the various modes available as per your requirements.
To better understand the normal traffic pattern, we should be aware of the various usual factors that govern the performance of a wireless network. For example, data packets, associations, and disassociations, signal strength with/without interferences. Our objective while analyzing preceding parameters is to form a baseline that can prove worthy when comparing the traffic patterns with unusual ones. The factor that affects the network performance the most is a different form of interference, which is caused due to various factors such as physical obstructions such as thick walls, roofs; and electronic appliances, such as microwave, cordless phones, and so on.
While dealing with wireless networks, the integrity of data becomes more important because the packets are simply traveling in the air, and anyone with some basic hardware and knowledge of how wireless networks work can sniff and capture these packets easily. Wireless networks don't have any rescue options to protect the integrity, so using them, you cannot be 100% assured regarding the security of data.
Let's say, for example, you are listening to a particular channel in the spectrum. Normally, you can sniff only one channel at a time, but if the channels start overlapping each other, than it is quite possible that you will see other channel packets in the list pane. As per the normal functioning of a wireless spectrum, the networks that operate close to each other are supposed to choose non-overlapping channels such as 1,6,11,14 to avoid any issues. Refer to the following figure that best illustrates channel overlapping (I used from the same from Wikipedia):
The strength of the wireless network is totally dependent on Radio Frequency (RF) signals that carry the traffic. Once the wireless signal starts traveling, the strength is supposed to lessen eventually, as it travels farther because of the obstructions that come in between. The device that works over the same RF energy is also responsible for reducing the wireless signal strength. If you are also dealing with such issues, then just using Wireshark to listen on an interface in the monitor mode won't solve the purpose. You need a spectrum analyzer, such as Wi-Spy+Channelyzer, that is paired with a USB (refer to http://metageek.com) adapter and gives you an extra eye over the RF energy form; otherwise, you won't be able to see them. Most of the time, the device emitting high RF energy can be the cause of poor network performance.
To inspect the environment for RF energy, you need to walk down the office on your own with your laptop running a spectrum analyzer, which would be able to detect the RF anomalies that can affect your wireless network performance. The placement of these analyzers does play an important role in solving the problem. If a host in your office is not able to connect then the best option is to place your analyzer as close to the host as possible in order to perceive the situation from the host's perspective. If various hosts in your office experience a similar problem, then the best option would be to place the analyzer near the access point they are trying to connect to. Depending on the scenario you are dealing with, you can dynamically decide and even manually scan through the office premises to get to know whether there is any RF energy interfering.
I don't have any special hardware to show you RF energy, but I will use an inbuilt tool from the Kali Linux OS, which will help us fetch various granular details regarding different WLANs available around my premises and all the devices that are connected to Wi-Fi (if paired with a hardware used for spectrum analysis, this can prove really useful). The name of the tool is Kismet, and it is quite efficient in representing details in graphical and various available statistical formats, thus enabling us to know more about the neighborhood (use it for ethical purposes). Follow these steps to use the Kismet tool on Kali Linux:
- First I enable the monitor mode using the
airmon-ng start wlan0command (wlan0is my wireless interface). - Open the terminal and type
Kismet. You will be asked to set various customization options—do not change any default settings. - Once you're asked for the source (interface name) for the Kismet server to capture the packets, specify your interface running on the monitor mode (in my case, this is
mon0. You can check your interface using theiwconfigcommand). - Now, let the tool run on its own for a few minutes; gradually, you will start noticing that a graph is getting plotted for the live traffic captured. You will see various wireless networks around you and most of the associated devices connected with it.
- In the network section, you will see specific details for the wireless network, such as BSSID, SSID, encryption algorithm used, and so on.
- The clients' section will show various devices associated with the network. Refer to the following figure of the tool that lists my network and various clients connected to it:
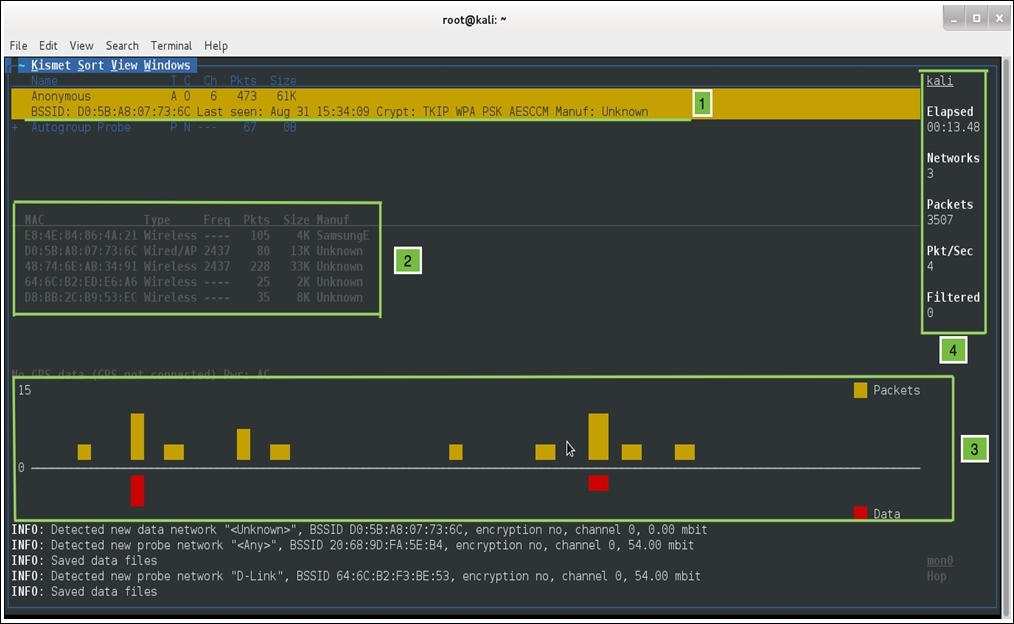
Now, let's see what does each pointer in the preceding screenshot signifies:
- In this part, just below the menu bar, the number of networks that my Wi-Fi adapter is able to scan is shown. The first row shows my home network Anonymous and its BSSID, when the network was last seen, the algorithm used, and the manufacturer of the device.
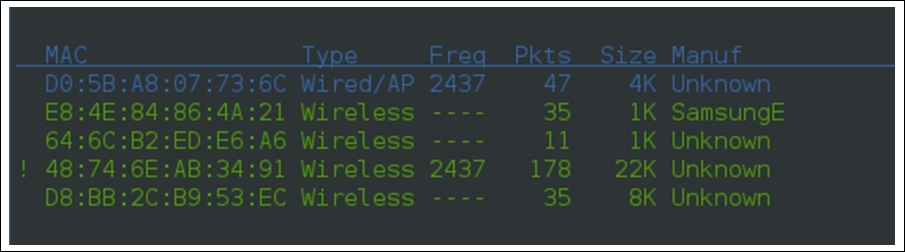
- In this second section, Kismet lists out various devices that are currently associated with the Anonymous network, their type (is it an access point or a wireless client), the frequency that the devices are using for transmission, the total number of packets a particular device has transmitted, the size of all packets, and the manufacturer of the device (interestingly, Kismet was able to identify one device manufacturer that is currently associated with my network, as shown in the first row). Refer to the following screenshot that shows the device section separately:
- In the third section, there is a graph that shows the current rate at which the packets are traveling around and the total amount of data packets that are shown with red bars.
- In the fourth section, we can see a lot of details that are listed, such as the hostname (Kali), total number of networks my NIC is able to see, for how long Kismet is running, the total number of packets captured, and an average rate of packets seen per second. Using such simple tools without any special configuration, we were able to collect a good amount of specific details.
In the bottom-right corner of the window, the interface used to capture details is shown: mon0 (a monitor mode activated interface). Through this tool, we are not able to capture any RF energy that can distort the traffic shape, which lessens our network performance. But the same tool, when paired with Wi-Spy or Ubertooth hardware, will show the RF energy spectrum. If you are one of those professionals who needs to deal with Wi-Fi troubleshooting in day-to-day working, then you should use this—if not now, then someday you will.
The RF energy emitted from the devices won't be the problem every time; sometimes, you would be required to look at the packet level like checking authentication and association packets, that is, you can match your normal traffic pattern with the anomaly you might be facing.
The medium used by the packets to travel from one host to another is changed for now, but the basic protocols that work on the preceding layers are still the same. As we already discussed, layer 2 (data link) is of great importance here. Understanding packets traveling in detail is obviously a good thing; we will discuss various types of frames, header structures, and information an 802.11 packet contains.
There are basically three types of frames that you will see while analyzing wireless packets. All the packets listed are almost similar to the one we saw earlier; the only difference here is the extra information that is appended because of the 802.11 header. The following are the header types that you will see:
- Management: To form a connection between the hosts at the data link layer, these frames are used. These frames are used to join or leave a network, associations/disassociation/reassociation and to broadcast beacon packets and a few administrative tasks. Management frames are responsible for a lot of activities that take place while the connection between the hosts is established.
- The beacon frame: The AP sends beacon frames every 10th of a second to let the STA know that the AP is available for connection.
- The authentication frame: This type of frame is sent by the STA to the AP containing its identity. If the AP follows an open system authentication, then STA would send just one authentication frame that AP acknowledges to understand whether the connection is accepted or rejected. If the AP follows shared key authentication, then the STA sends a request to the AP to get connected. Now, AP sends a challenge text to the STA. After this, STA completes the challenge and encrypts the challenge text requested using the same algorithm that the AP is using, and then it sends it to the AP. AP receives and decrypts the text using it's own key value, and no matter what the result is, it determines the status of the connection request.
- The association request frame: This frame is sent from the STA to the AP to provide details of the allocation of resources and for syncing purpose.
- The associate response frame: This frame is sent in response to the AP for the STA request that is sent.
- The deauthentication frame: This is sent by the STA to terminate the connection with the AP/STA.
- The disassociation frame: This frame is a graceful way of terminating the connection so that the AP can free up the resources allocated for the STA.
- The probe request frame: This frame is sent by the STA to another STA/AP to request for its details; this is basically used to find nearby APs.
- The probe response frame: This frame is sent in response to the request that AP/STS might have received from another device in the network.
- The reassociation (request/response) frame: This frame is sent to the new AP when an STA's association with the current AP gets dropped. In response, the AP acknowledges the acceptance/rejection for the reassociation request.
Monitoring the time gap between each beacon frame sent from the hosts can be useful when dealing with high latencies. Due to these beacon packets broadcasted from the AP, the devices know that they are available to connect to.
- Control: This is to ensure that the delivery of the packets between the hosts manages the level of congestion in your channel and uses packets such as clear-to-send and request-to-send. In short, we can say that these frames are used for maintenance tasks. These control packets ensure the integrity of the packets that are transmitted. Likewise, the management frame several kinds control frame has just three kinds:
- Request-to-send (RTS): This frame is sent by the STA to request for gaining the control of the medium for a particular duration.
- Clear-to-send (CTS): This frame is sent by the AP from where it received the RTS to specify when the medium will be allocated to the STA for transmission. This frame is often used for protection from older stations that want to gain access to the medium again.
- Acknowledgement (ACK): This frame is sent by the receiving STA to tell the sending station that the data packet was received successfully. If the sending station does not receive this packet, then after a definite period of time, the sending station will resend the data packet to the same recipient to ensure the delivery of the packet.
- Data: These frames contain the data that is actually sent between the hosts. These are the only frames that get transmitted between the wireless and the wired domain.
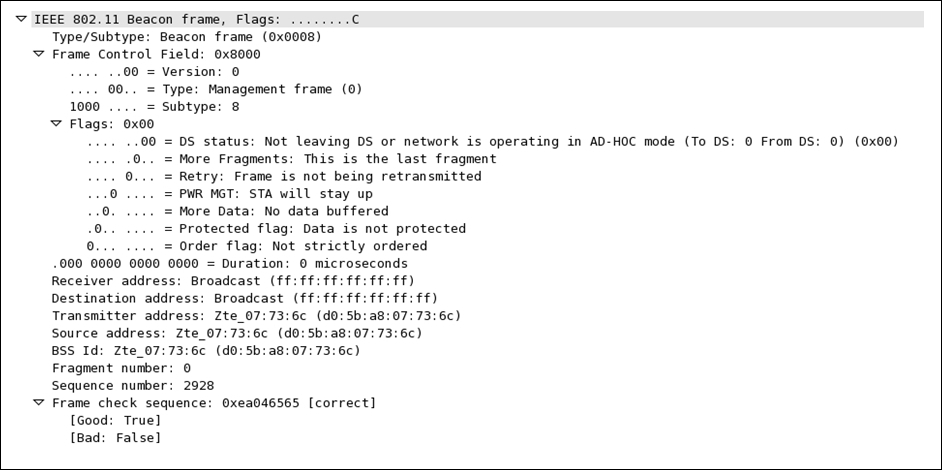
The 802.11 packets are similar to the wired network packets that we saw; the terminologies do differ a little bit, but the basic concept is identical. Let's take a look at a beacon frame. Refer to the following screenshot for that:
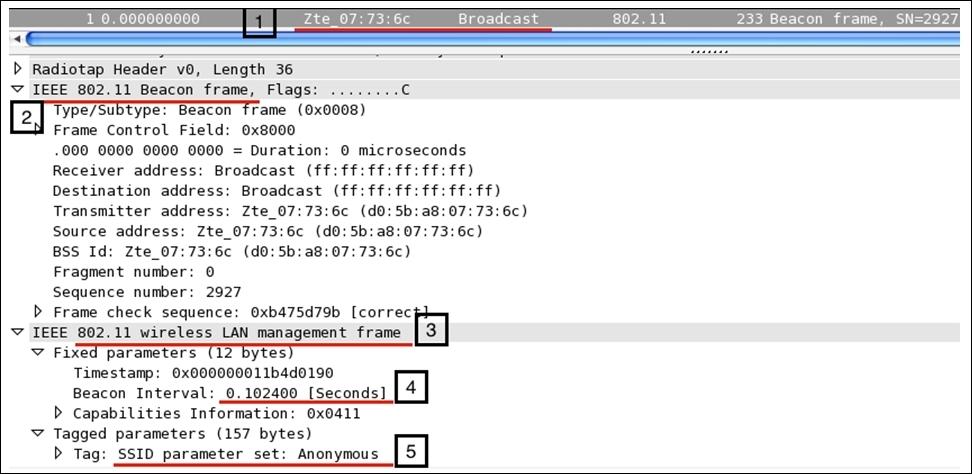
Now, let's see what all the pointers in the preceding figure signify:
- 1: The packet describes it all; the beacon frame is sent to the broadcast address from the Wi-Fi-enabled device or any device that is currently listening can connect to it using the right credentials.
- 2 and 3: Here, the type of the frame is management and the subtype is beacon.
- 4: As we discussed earlier, beacon frames are transmitted every 10 seconds. You can verify the same from the packet itself, to be precise; the next beacon frame was sent after an average time of 0.102385000 seconds (this is just the time gap I calculated between the two packets seen in the list pane).
- 5: The SSID broadcast is enabled, and hence, the packet is shown with the broadcasted SSID Anonymous, which will be visible when you try to scan nearby Wi-Fi hotspots that you wish to connect to (you need to use the monitor mode to capture this packet). Various other details are included in the beacon frame that is part of the header and is quite necessary to know about. Refer to the following frame structure that shows how a layer 2 datagram looks like in theory and in Wireshark:
Frame Control
Duration/ID
Address1
Address2
Address3
Sequence Control
Address4
Let's take a look at the fields present in the frame in detail:
This is the first section in the frame header that lists out quite a good amount of info in it.
- Frame Control
Protocol Version: This represents a 2-bit value that is used to verify the version of the protocol in use; the current version is 0 at the time of writing.Type: This identifies the type of the frame; in our case, we are dealing with a management frame (beacon).Subtype: This represents the subtype of the header; for us, it is a beacon frame for which we are seeing a numerical code8.DS Status: This represents whether a data frame is heading to a distribution system (DS) or working in which mode. If the bit is set to1, then this must be a data frame; if this is set to0, then this frame is probably a management/control frame.More Fragments: If this bit is set to1, this means that the frame has been distributed into couple of parts and is being sent one by one.Retry: This bit is set to1when there is a requirement upon retransmission of the frame.PWR Management: If this is set to1, it represents the current power management state of the STA whether it isactive:0or in thepower-save:1mode.More Data: This bit is set to1if the AP is trying to tell the STA in the power-save mode that it has more frames to send. In case of control frames, this will always be0.Order: If this bit is set to1, this means that the frame is forcefully lined up and would be sent in a sequence. Usually, this bit is not set because it might cost transmission performance.Duration ID: This denotes the time the sender might require for frame exchange; this is usually seen in an request-to-send (RTS) frame, which requests to occupy the medium for a certain amount of time.Address 1/2/3: This is the physical address of the communicating device (receiver, transmitter, and destination address).Sequence Control: This is composed of two subfields: a 12-bit sequence number and a fragment number of 4 bit. A sequence number field is used to identify the sequence of the frames that arrive and for their proper reassembly (this ranges between 0-4,095). The fragment number field is used to denote the number of fragments for each frame (this ranges between 0-15).Address 4: This represents the sender's physical address and would only be present in a wireless distribution mode.Data/Payload: This field is not part of the header, but at the end, it will be appended when data is being sent across. The size of this field can be up to 2,324 bytes.FCS: The frame check sequence field is used to perform a data integrity test; you must have heard about the cyclic redundancy check (CRC), which helps in calculating a value related to the data we received. If the FCS value is identical to the one we calculated, then the packet is received without errors.
These are one of those essential components of WLAN data transfers that avoid collisions from happening and ensure the integrity of the data that is sent. The following illustration determines the four-step process that takes place to follow a 100% fail-proof delivery:
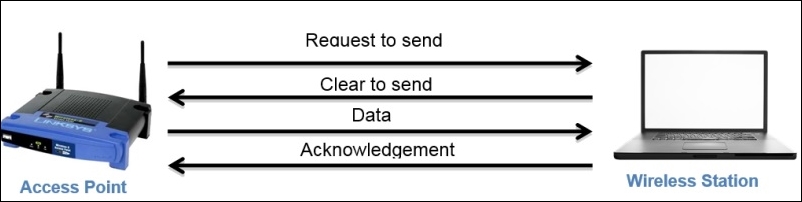
First, the AP sends a request to the STA to gain medium access; once the STA approves the AP's request, the AP starts sending data. As soon as the data transfer is completed, the STA sends an ACK packet to acknowledge error-free delivery. If the ACK is not sent, then then the AP will start retransmission after some time.