 Using the HTTP tool from the Statistics menu
by Charit Mishra, Yoram Orzach, James H Baxter
Wireshark Revealed: Essential Skills for IT Professionals
Using the HTTP tool from the Statistics menu
by Charit Mishra, Yoram Orzach, James H Baxter
Wireshark Revealed: Essential Skills for IT Professionals
- Wireshark Revealed: Essential Skills for IT Professionals
- Table of Contents
- Wireshark Revealed: Essential Skills for IT Professionals
- Credits
- Preface
- 1. Module 1
- 1. Getting Acquainted with Wireshark
- 2. Networking for Packet Analysts
- The OSI model – why it matters
- IP networks and subnets
- Switching and routing packets
- WAN links
- Wireless networking
- Summary
- 3. Capturing All the Right Packets
- Picking the best capture point
- Test Access Ports and switch port mirroring
- Capturing interfaces, filters, and options
- Verifying a good capture
- Saving the bulk capture file
- Isolating conversations of interest
- Using the Conversations window
- Wireshark display filters
- Filter Expression Buttons
- Following TCP/UDP/SSL streams
- Marking and ignoring packets
- Saving the filtered traffic
- Summary
- 4. Configuring Wireshark
- 5. Network Protocols
- The OSI and DARPA reference models
- Transport layer protocols
- Application layer protocols
- Summary
- 6. Troubleshooting and Performance Analysis
- Troubleshooting methodology
- Troubleshooting connectivity issues
- Troubleshooting functional issues
- Performance analysis methodology
- Top five reasons for poor application performance
- Summary
- 7. Packet Analysis for Security Tasks
- 8. Command-line and Other Utilities
- 2. Module 2
- 1. Introducing Wireshark
- 2. Using Capture Filters
- 3. Using Display Filters
- 4. Using Basic Statistics Tools
- Introduction
- Using the Summary tool from the Statistics menu
- Using the Protocol Hierarchy tool from the Statistics menu
- Using the Conversations tool from the Statistics menu
- Using the Endpoints tool from the Statistics menu
- Using the HTTP tool from the Statistics menu
- Configuring Flow Graph for viewing TCP flows
- Creating IP-based statistics
- 5. Using Advanced Statistics Tools
- Introduction
- Configuring IO Graphs with filters for measuring network performance issues
- Throughput measurements with IO Graph
- Advanced IO Graph configurations with advanced Y-Axis parameters
- Getting information through TCP stream graphs – the Time-Sequence (Stevens) window
- Getting information through TCP stream graphs – the Time-Sequence (tcp-trace) window
- Getting information through TCP stream graphs – the Throughput Graph window
- Getting information through TCP stream graphs – the Round Trip Time window
- Getting information through TCP stream graphs – the Window Scaling Graph window
- 6. Using the Expert Infos Window
- 7. Ethernet, LAN Switching, and Wireless LAN
- 8. ARP and IP Analysis
- 9. UDP/TCP Analysis
- Introduction
- Configuring TCP and UDP preferences for troubleshooting
- TCP connection problems
- TCP retransmission – where do they come from and why
- Duplicate ACKs and fast retransmissions
- TCP out-of-order packet events
- TCP Zero Window, Window Full, Window Change, and other Window indicators
- TCP resets and why they happen
- 10. HTTP and DNS
- 11. Analyzing Enterprise Applications' Behavior
- Introduction
- Finding out what is running over your network
- Analyzing FTP problems
- Analyzing e-mail traffic and troubleshooting e-mail problems – POP, IMAP, and SMTP
- Analyzing MS-TS and Citrix communications problems
- Analyzing problems in the NetBIOS protocols
- Analyzing database traffic and common problems
- 12. SIP, Multimedia, and IP Telephony
- Introduction
- Using Wireshark's features for telephony and multimedia analysis
- Analyzing SIP connectivity
- Analyzing RTP/RTCP connectivity
- Troubleshooting scenarios for video and surveillance applications
- Troubleshooting scenarios for IPTV applications
- Troubleshooting scenarios for video conferencing applications
- Troubleshooting RTSP
- 13. Troubleshooting Bandwidth and Delay Problems
- 14. Understanding Network Security
- A. Links, Tools, and Reading
- 3. Module 3
- 1. Welcome to the World of Packet Analysis with Wireshark
- 2. Filtering Our Way in Wireshark
- 3. Mastering the Advanced Features of Wireshark
- 4. Inspecting Application Layer Protocols
- 5. Analyzing Transport Layer Protocols
- 6. Analyzing Traffic in Thin Air
- 7. Network Security Analysis
- 8. Troubleshooting
- 9. Introduction to Wireshark v2
- Bibliography
- Index
In this recipe we will learn how to use HTTP statistical information of the data that runs over the network.
To view the HTTP statistics follow these steps:
From the Statistics menu, select HTTP. The following window will appear:
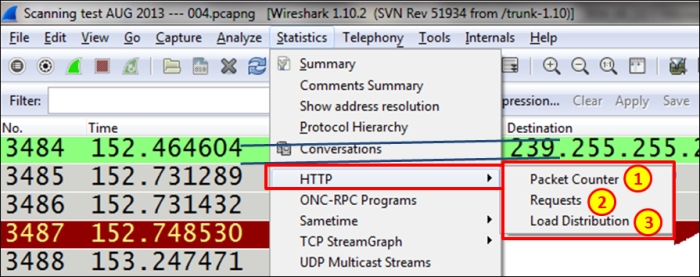
In the HTTP submenu, we have the following:
- Packet Counter (marked as 1 in the preceding screenshot): This provides us with the number of packets to each website. This will help us to identify how many requests and responses we have had.
- Requests (marked as 2 in the preceding screenshot): This is used to see request distribution to websites.
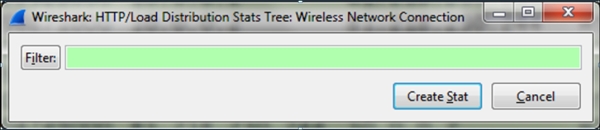
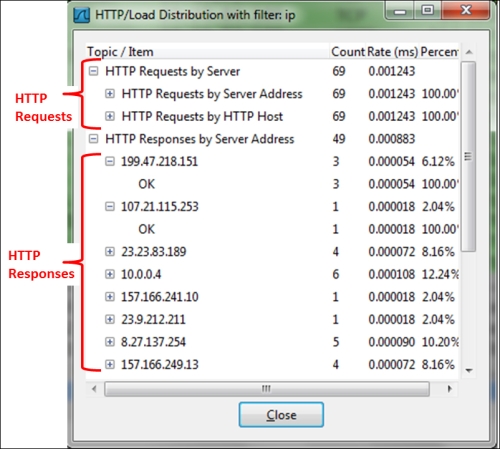
- Load Distribution (marked as 3 in the preceding screenshot): This is used to see load distribution between websites.
We will perform the following steps to view the Packet Counter statistics:
- Navigate to Statistics | HTTP | Packet Counter.
- The following filter window will open:
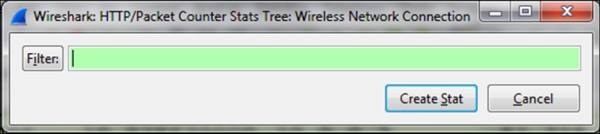
- In this window, you configure a filter to see the statistics that are applied to these filters. If you want to see statistics over the whole captured file, leave it blank. This will show you statistics over IP, that is, all the HTTP packets.
- Click on the Create Stat button, and you will get the following window:
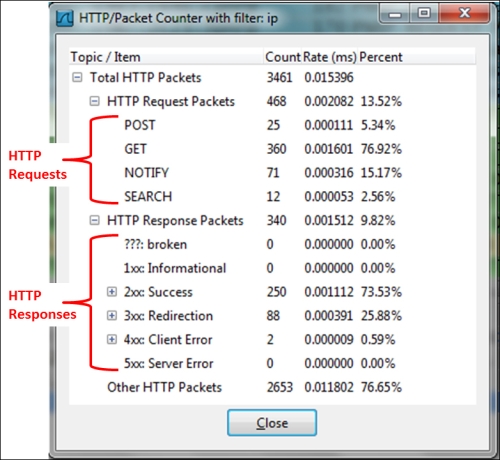
In order to see the HTTP statistics for a specific node, you can configure a filter for it using a display filter format.
We will perform the following steps to view HTTP Requests statistics:
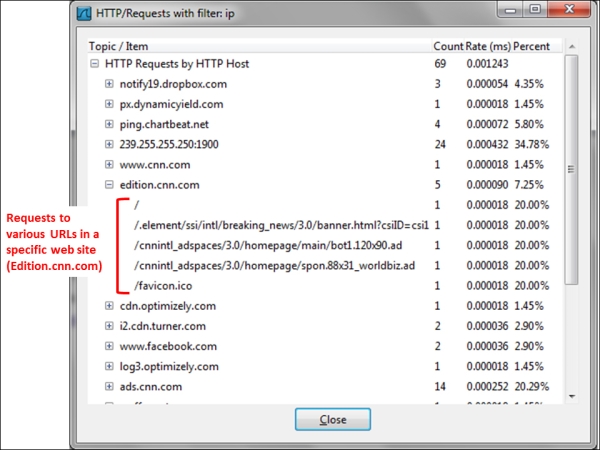
- Navigate to Statistics | HTTP | Requests. The following window will appear:
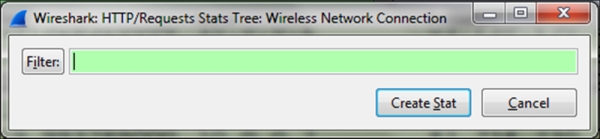
- Choose the filter you need. For all data, leave blank.
- Click on the Create Stat button and the following window will come up:
- To get statistics for a specific HTTP host, you can set a filter
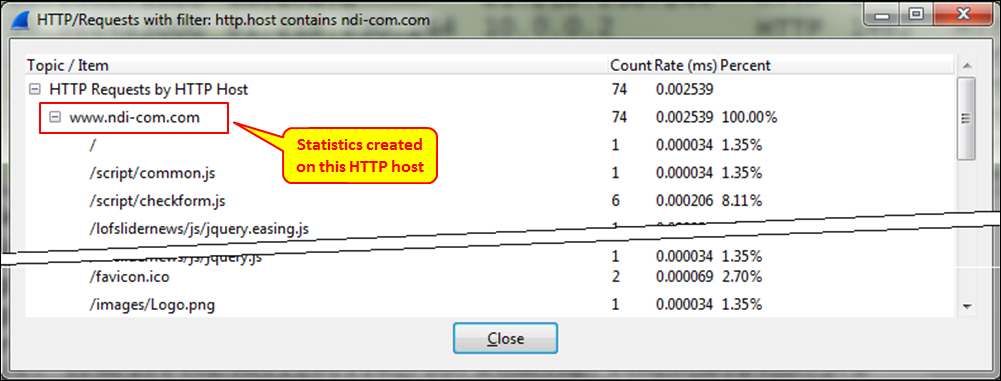
http.host contains <host_name>orhttp.host==<host_name>(depends on whether you need a hostname with a specific name or a hostname that contains a specific string), and you will see statistics to this specific host. - For example, by configuring the filter
http.host contains ndi-com.com, you will get the statistics for the website www.ndi-com.com (shown in the following screenshot):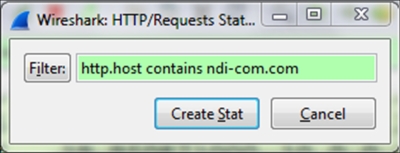
- What you will get is:
When we open a website, it usually sends requests to several URLs. In this example, one of the websites we opened was www.cnn.com, which took us to edition.cnn.com, where we have sent several requests: to the root URL, to the breaking_news URL, and to two other locations on the home page.
For deeper HTTP analysis, you can use purpose-specific tools. One of the most common ones is Fiddler. You can find it at http://www.fiddler2.com/fiddler2/
Fiddler is a software tool developed for HTTP troubleshooting and therefore it provides more data with a better user interface for HTTP.
-
No Comment