
IO Graph is a convenient tool for measuring the throughput of a network. Using it, we can measure the traffic and throughput of any predefined filter. In this recipe we will see some examples for measuring the throughput of a network.
Connect your laptop with Wireshark to a network with a port mirror to the link you want to measure, as you learned in Chapter 1, Introducing Wireshark. Start a new capture or open an existing file, and open the IO Graphs tool from the Statistics menu.
While measuring the throughput, we can measure the throughput on a communication line between end devices (PC to server, phone to phone, PC to the Internet, and so on) or to a specific application.
The process of isolating network problems starts from measuring traffic over a link between end devices on single connections and seeing where it comes from.
Some typical measurements are host-to-host traffic, all the traffic to a specific server, all the traffic to a specific application on a specific server, all the TCP performance phenomena on a specific server, and more.
In this recipe, we will provide some basic filters for measuring traffic in the network.
To measure the throughput between end devices, simply configure a display filter between their IP addresses.
For example, to see the traffic between 10.2.10.101 and 10.2.10.240, configure the filter:
ip.add req 10.2.10.240 and ip.add req 10.2.10.240.
You can either type the filter in the IO Graph's Filter: box or perform the following steps:
- Place the cursor on a packet in a specific connection.
- Right-click on it and navigate to Conversation filter | IP. The filter string will appear in the upper display filter box.
- Copy the filter string from the upper display filter box to one of the IO Graph Filter: boxes.
- Click on the filter bow button in the IO Graphs window to activate it.

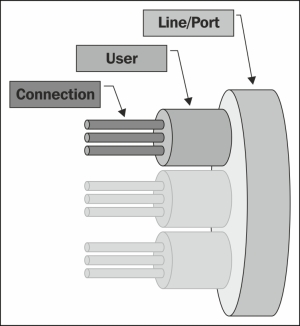
In order to configure the performance measurement of a specific application, you can configure a filter that contains specific port numbers or a specific connection.
There are several ways to isolate an application graph. Here's one of them:
- In the captured data, click on any packet that belongs to the traffic stream. In TCP it will be a specific connection; in UDP it will be just a stream between two IP/Port pairs.
- Right-click on it and choose Follow TCP stream or Follow UDP stream. You will get
tcp.streameq<number>orudp.streameq<number>.<number>is simply the number of the stream in the capture file. - Copy the string to the filter window in the IO Graphs window and you will get the graph of the specific stream.
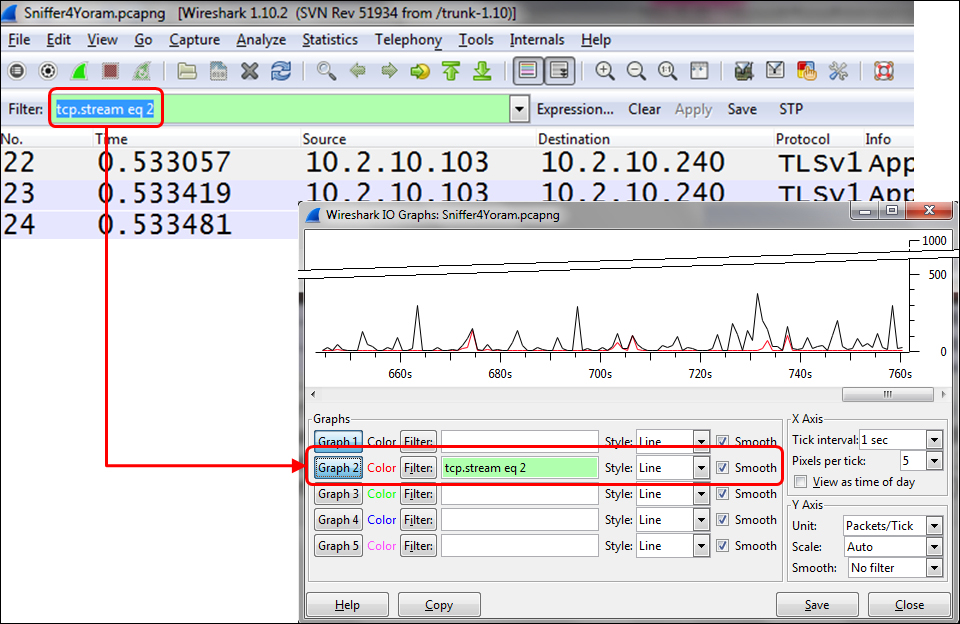
If you want a graph for specific data on the stream, add information to the filter. For example (in the previous illustration):
tcp.streameq 2andtcp.analysis.retransmissionswill give all the TCP retransmissions on the specific stream (indicating, for example, a slow network, errors, or packet loss)tcp.streameq 2andtcp.analysis.zero_windowwill give all the TCP zero window phenomena on the specific stream (indicating a slow end device)
The power of the IO Graph tool comes from the fact that you can configure any display filter and see it as a graph in various shapes and configurations. Any parameter in a packet can be filtered and monitored in this way.
Some examples for parameters that can be monitored are explained in this section.
- Open the IO Graphs window. You can do it during the capture to view online statistics or open a saved capture file.
- Configure the filter
http.host contains "<name>", in our case,http.host contains "google". - In the packet list you will see (while configuring the same filter) the information shown in the following screenshot:

- In the IO Graphs window, you will see the following graph:

In the packet capture pane, you can see that we've had two accesses to Google after around 86 seconds, the next two after around 109 seconds, and so on.