
VLAN, or Virtual LAN, is a mechanism that divides a LAN into separate LANs without any connectivity between them, and this is where the name virtual comes from. In this section we will have a look at recipes to monitor VLAN traffic.
The purpose of this recipe is to give the reader a general description of how to use Wireshark for VLAN issues. An easier way to solve related problems is to use the vendor's CLI (Cisco IOS, Juniper JUNOS, and so on) for this purpose.
We will discuss two issues in this recipe:
- How to monitor traffic inside a VLAN
- How to view tagged frames going through a VLAN-tagged port
In the first case, a simple configuration is required. In the second case, there are some points to take care of.
While capturing on a VLAN, you won't necessarily see the VLAN tags in packets. The question of whether you will see the VLAN tags actually depends on the operating system you are running, and if your Network Interface Card (NIC) and the NIC driver supports this feature.
In the following figure you can see a typical topology with VLANs. The upper switch is connected by two trunks (these are ports that tag the Ethernet frames) to the lower switches. On this network you have VLANs 10, 20, and 30, while PCs connected to each of the VLANs will not be able to see PCs from other VLANs.

Connect Wireshark to the switch you want to monitor. Let's look at the preceding configuration (shown in the preceding figure).
In order to monitor traffic on an entire VLAN
- Connect your laptop to the central switch and to one of the ports.
- Configure the port mirror from the monitored VLAN to the port you are connected to. For example, if you connect your laptop to SW1 port 4, and you want to monitor traffic from VLAN10, the commands will be (in Cisco):
Switch(config)#monitor session 1 source vlan 10
Switch(config)#monitor session 1 destination interface fastethernet 0/4
This will show you traffic from VLAN10 that is forwarded through the central switch, SW1.
Tip
For further information on how to configure port mirroring on various vendor websites, search for
SPAN(in Cisco),port mirror, ormirroring(HP, DELL, Juniper, and others). While monitoring traffic in a blade center, usually, you can only monitor traffic on a physical port; however, there are applications that enable you to monitor traffic on only a specific server on a blade (for example, Cisco Nexus 1000V).
Monitoring tagged traffic is not a straightforward mission. The issues of whether you see VLAN tags while capturing data with Wireshark or not will depend on the network adapter you have, the driver that runs over it, and what they do with VLAN tags.
The simplest way to verify that your laptop can capture tagged frames is as follows:
- Start capturing the tagged port with the port mirror. If you see tags, continue with your work.
- If you don't see any tags, go to the adapter configuration. In Windows 7, you will get there by clicking on Start and then navigating to Control Panel | Network and Internet | View Network Status and Tasks | Change Adapter Settings | Local Area Connection. Next, perform the steps as shown in the following screenshot:

- Configure the adapter with Priority & VLAN Disabled. This will move the tags for the WinPcap driver and for the Wireshark.
Note
In the previous screenshot we see an example of a Lenovo laptop with Realtek NIC. The illustration gives an example on a popular device, but it can be different on other laptops or servers. The principle should be the same; disable the adapter by extracting the VLAN tag, so it will be forwarded to the WinPcap driver and presented on Wireshark.
Tags are small pieces of data added to a packet in order to add VLAN information to it. The tag is a 4-byte long string (32 bits), as presented in one of the following diagrams.
Most network adapters and their drivers will simply pass VLAN tags to the upper layer to handle them. In these cases, Wireshark will see VLAN tags and present them.
In more sophisticated adapters and drivers, the VLAN tag will be handled in the adapter itself. This includes some of the most common adapters with Intel and Broadcom Gigabit chipsets. In these cases, you will have to disable the VLAN feature.
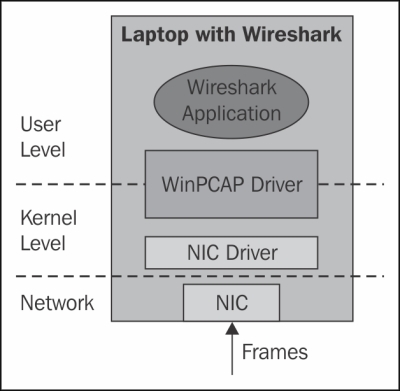
When configuring the NIC driver in order to ensure that it will not handle VLAN tags, packets will simply be forwarded to the WinPcap driver and presented by Wireshark.

VLAN tagging
In the following screenshot you see an example for a tagged frame; the frame is tagged with VLAN ID = 20.

Wireshark will also capture double tags, just like in the 802.1ad standard. These tags are what's called service tags and are added at the service provider edge, in order to divide between the provider and the customer tags. The provider tag is called S-Tag (802.1ad), and the customer tag is called C-Tag (802.1Q). It is also referred to as a QinQ mechanism.
- For more information about WinPcap, go to the Winpcap home page at http://www.winpcap.org/
- For more information on the UNIX/Linux library, refer to the tcpdump home page at http://www.tcpdump.org/