 Getting information through TCP stream graphs – the Time-Sequence (tcp-trace) window
by Charit Mishra, Yoram Orzach, James H Baxter
Wireshark Revealed: Essential Skills for IT Professionals
Getting information through TCP stream graphs – the Time-Sequence (tcp-trace) window
by Charit Mishra, Yoram Orzach, James H Baxter
Wireshark Revealed: Essential Skills for IT Professionals
- Wireshark Revealed: Essential Skills for IT Professionals
- Table of Contents
- Wireshark Revealed: Essential Skills for IT Professionals
- Credits
- Preface
- 1. Module 1
- 1. Getting Acquainted with Wireshark
- 2. Networking for Packet Analysts
- The OSI model – why it matters
- IP networks and subnets
- Switching and routing packets
- WAN links
- Wireless networking
- Summary
- 3. Capturing All the Right Packets
- Picking the best capture point
- Test Access Ports and switch port mirroring
- Capturing interfaces, filters, and options
- Verifying a good capture
- Saving the bulk capture file
- Isolating conversations of interest
- Using the Conversations window
- Wireshark display filters
- Filter Expression Buttons
- Following TCP/UDP/SSL streams
- Marking and ignoring packets
- Saving the filtered traffic
- Summary
- 4. Configuring Wireshark
- 5. Network Protocols
- The OSI and DARPA reference models
- Transport layer protocols
- Application layer protocols
- Summary
- 6. Troubleshooting and Performance Analysis
- Troubleshooting methodology
- Troubleshooting connectivity issues
- Troubleshooting functional issues
- Performance analysis methodology
- Top five reasons for poor application performance
- Summary
- 7. Packet Analysis for Security Tasks
- 8. Command-line and Other Utilities
- 2. Module 2
- 1. Introducing Wireshark
- 2. Using Capture Filters
- 3. Using Display Filters
- 4. Using Basic Statistics Tools
- Introduction
- Using the Summary tool from the Statistics menu
- Using the Protocol Hierarchy tool from the Statistics menu
- Using the Conversations tool from the Statistics menu
- Using the Endpoints tool from the Statistics menu
- Using the HTTP tool from the Statistics menu
- Configuring Flow Graph for viewing TCP flows
- Creating IP-based statistics
- 5. Using Advanced Statistics Tools
- Introduction
- Configuring IO Graphs with filters for measuring network performance issues
- Throughput measurements with IO Graph
- Advanced IO Graph configurations with advanced Y-Axis parameters
- Getting information through TCP stream graphs – the Time-Sequence (Stevens) window
- Getting information through TCP stream graphs – the Time-Sequence (tcp-trace) window
- Getting information through TCP stream graphs – the Throughput Graph window
- Getting information through TCP stream graphs – the Round Trip Time window
- Getting information through TCP stream graphs – the Window Scaling Graph window
- 6. Using the Expert Infos Window
- 7. Ethernet, LAN Switching, and Wireless LAN
- 8. ARP and IP Analysis
- 9. UDP/TCP Analysis
- Introduction
- Configuring TCP and UDP preferences for troubleshooting
- TCP connection problems
- TCP retransmission – where do they come from and why
- Duplicate ACKs and fast retransmissions
- TCP out-of-order packet events
- TCP Zero Window, Window Full, Window Change, and other Window indicators
- TCP resets and why they happen
- 10. HTTP and DNS
- 11. Analyzing Enterprise Applications' Behavior
- Introduction
- Finding out what is running over your network
- Analyzing FTP problems
- Analyzing e-mail traffic and troubleshooting e-mail problems – POP, IMAP, and SMTP
- Analyzing MS-TS and Citrix communications problems
- Analyzing problems in the NetBIOS protocols
- Analyzing database traffic and common problems
- 12. SIP, Multimedia, and IP Telephony
- Introduction
- Using Wireshark's features for telephony and multimedia analysis
- Analyzing SIP connectivity
- Analyzing RTP/RTCP connectivity
- Troubleshooting scenarios for video and surveillance applications
- Troubleshooting scenarios for IPTV applications
- Troubleshooting scenarios for video conferencing applications
- Troubleshooting RTSP
- 13. Troubleshooting Bandwidth and Delay Problems
- 14. Understanding Network Security
- A. Links, Tools, and Reading
- 3. Module 3
- 1. Welcome to the World of Packet Analysis with Wireshark
- 2. Filtering Our Way in Wireshark
- 3. Mastering the Advanced Features of Wireshark
- 4. Inspecting Application Layer Protocols
- 5. Analyzing Transport Layer Protocols
- 6. Analyzing Traffic in Thin Air
- 7. Network Security Analysis
- 8. Troubleshooting
- 9. Introduction to Wireshark v2
- Bibliography
- Index
TCP time-sequence graphs based on the UNIX tcpdump command provide us with additional data on the connection that we monitor. In addition to the standard sequence/seconds in Time-Sequence (Stevens), we also get information on the ACKs that were sent, retransmissions, window size, and more details that enables us to analyze problems on the connection.
Open an existing capture or start a new capture. Click on a specific packet in the capture file. Even though you can use this feature on a running capture, it is not meant for online statistics; so it is recommended that you start a capture, stop it, and then use this tool.
To view TCP stream graph statistics, perform the following steps:
- Click on a packet in the stream you want to monitor.
- From the Statistics menu navigate to TCP StreamGraph | Time-Sequence Graph (tcp-trace). The following window will open up:
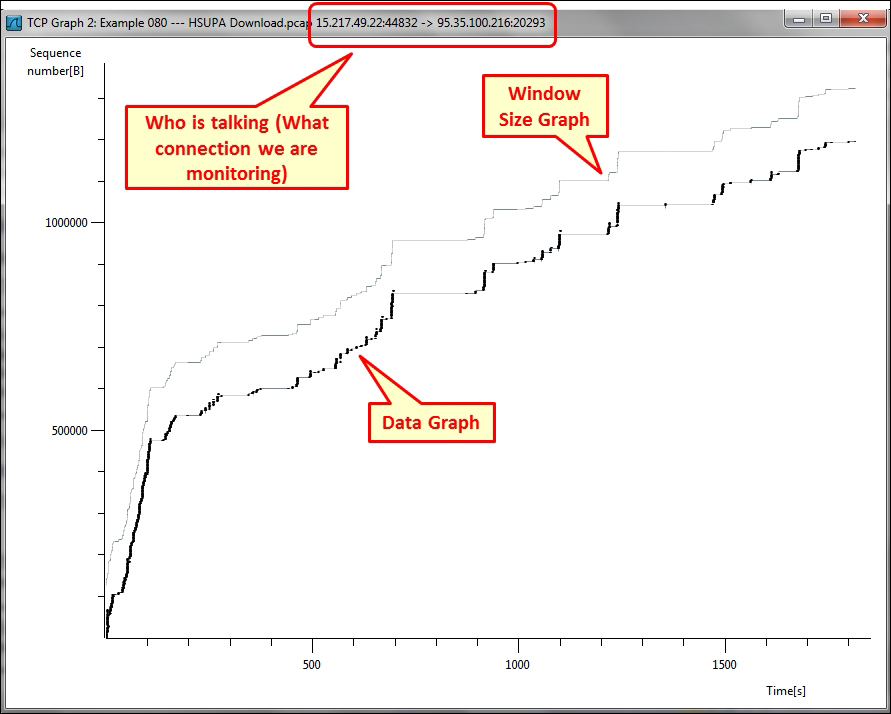
The graph shows the advance of byte transfer over time in the lower black graph and the window size in the upper gray graph. When there is space between the two, it means that there is some TCP buffering left and TCP will transfer bytes. Once they get closer and touch each other, it would be a window-full phenomenon that does not enable further data transfer.
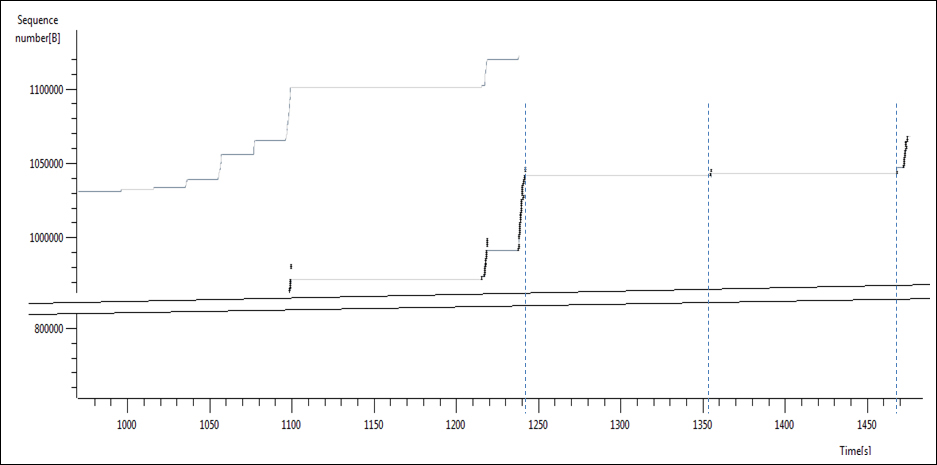
- We obtain the following screenshot when we zoom into a specific area:
- We obtain the following captured packets when we zoom into a particular area in the graph:
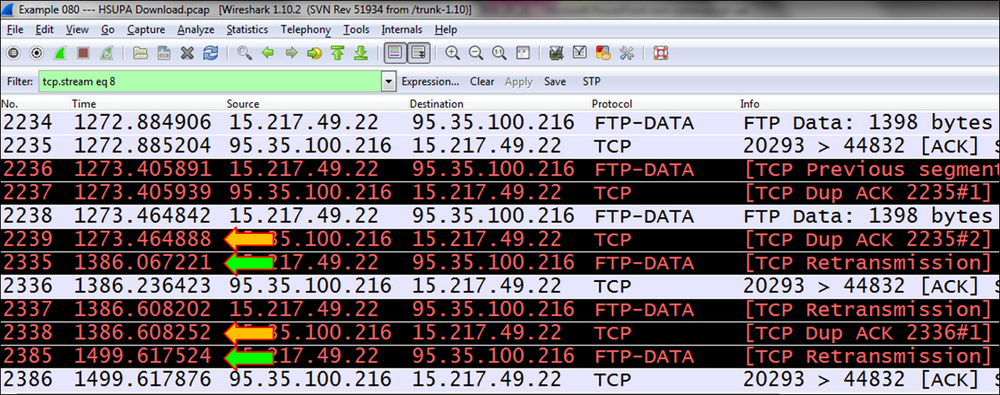
You can see that in the packet capture, there is a frame in time 1,273 (seconds after the beginning of the capture), a break, a packet in time 1,386, a break, and a packet in 1499.
In the TCP stream graph you see the breaks in transmission, and we can look for its reason when we are back to the packets pane.
The Time sequence (TCP-trace) graph is taken from the UNIX tcpdump command, which also checks the window size published by the receiver (this is the buffer size allocated by the receiver to the process), along with retransmitted packets and ACKs.
Working with this graph provides us with a lot of information, which we will use later for network debugging. The phenomena from a window that is being filled faster than expected to a lot of retransmissions and others will become visual with this graph that will help us to solve them.
The more we zoom in, the more details we will get as shown in the following screenshot:
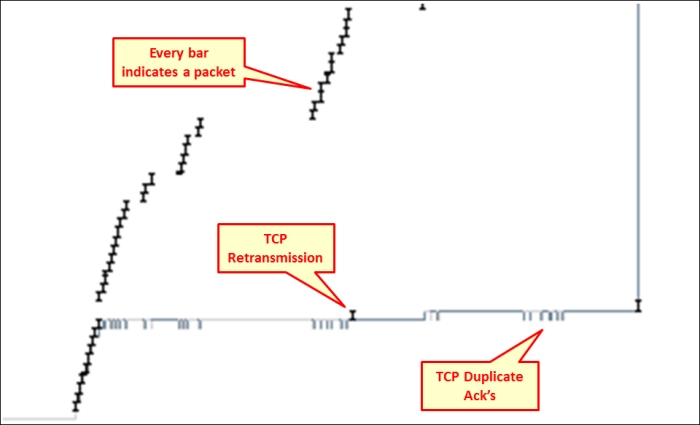
A bar is an indication of a packet that carries data between the initial and final sequence numbers. The bar that is not in the regular graph and looks like it runs away from it is a retransmission and the gray bar is a duplicate ACK. We will learn about these phenomena in Chapter 9, UDP/TCP Analysis.
-
No Comment