
In the previous recipe, we talked about signaling, that is, SIP and RDP. In this recipe, we will see how to use the voice or video call itself and see what might go wrong with it.
It will always start with a user complaining about voice or video quality, low speech quality, noises, and so on.
Also, don't forget that it might look like everything works fine in Wireshark, but further tuning of the IP PBX should be done say to increase the transmit volume.
When facing problems on a specific client, connect Wireshark to the client port with a port mirror. When facing problems with all clients connected to the same link, connect Wireshark to the link with a port mirror.
To locate performance problems, follow these steps:
- After you connect Wireshark with a port mirror, start the capture.
- Make sure there are calls running.
- From the Telephony menu, navigate to RTP | Show All Streams. This will show you all RTP streams running on the port that you are monitoring.
- The following window will open:

- Parameters that are important to watch are the packets lost, Max Delta (ms), Max Jitter (ms), and Mean Jitter (ms).
In the case of delay, follow these steps to locate the problem:
- Use a simple ping test to check the delay between the two ends of the network:
- When you see a high delay, check if it is typical to the communications line that you are measuring (see a list of typical delays in the There's more... section in this recipe).
- If it is a typical delay, you don't have anything to do here. Check with the phone and switch providers for tuning solutions for their equipment.
- If you have a longer delay than expected, ping the two phones from your laptop and check where the delay came from.
- When you locate the link with the higher delay, ping in a step-by-step manner along the link to see where the delay came from.
- In parallel, use Wireshark to check the load on the line. The delay can come from there, and in most of these cases, you will have Jitter coming with it.
- Delay can come from the following sources as well:
- Congested link: Check the case using Wireshark.
- Load on a router: Use provider tools, SNMP tools, or router CLI to measure load on these devices (use the provider manuals). It can be CPU load, memory load, and so on.
- Queuing delay on routers buffers: Check the vendor manuals.
In the case of Jitter, follow these steps to locate the problem:
- Use the same methodology as in the delay measurement and try to figure out where the Jitter comes from.
- Jitter can come from several sources:
- Congested line: Check the line with a
pingcommand to see if you have any problems here - Load on a router (CPU/memory): Check the vendor manuals to see how you can monitor these parameters
- Congested line: Check the line with a
In the case of packet loss, follow these steps to locate the problem:
- Check using the
pingcommand to see if there is a packet loss across the link. - If so, check the equipment along the way to see for packet losses.
- You can also click on a specific RTP packet in the packet list window and then navigate to RTP | Stream Analysis. It will show you the parameters on the stream that the packet is a part of. The following window will open:

- In the window, you will see the following parameters on the stream that you've opened:
- Packet: This parameter denotes the number of packets in the captured file.
- Sequence: This parameter denotes the RTP sequence number.
- Delta (ms): This is the time difference between the current and previous packet in the stream.
- Filtered Jitter (ms): This parameter refers to the difference between the real arrival time and the RTP timestamp parameter. It should be as low as possible and preferably zero.
- Skew (ms): This parameter denotes how early (or late) the packet is in relation to where it was supposed to be. For example, if we have a packet rate of 20 packets per second, we should have 50 ms between packets, and if a packet arrives 49 ms after the previous one, it will be a skew of -1 ms.
- IP BW (kbps): This parameter refers to the bandwidth consumption at the IP level that is with all headers down to layer 3.
- Marker: This parameter denotes whether the marker is SET (SET=1, UNSET=0). A marker indicates various phenomena such as end of silence period and end of video frame, and is added by the application.
- Status: This parameter lets you check whether the status is OK.
- From the Summary Information window, we can see a maximum Jitter of 2.89 ms; this is very low, so we should not expect any problems here.
- Clicking on the Graph button in the middle of the lower part of the RTP Stream Analysis window will open the following IO Graph:

- In this case, we see that the network looks great—the Jitter is less than 2.500 ms.
- When we use Wireshark and it looks like all the parameters measured in the previous points are OK, the problem in connectivity is a probably configuration problem in the equipment itself.
- You might see some problems such as wrong sequences and timestamps (see the following screenshot). These errors usually occur due to Jitter and delay problems.

RTP is used in conjunction with RTCP (both were first standardized in RFC 3550). RTP is used to carry the media streams (audio and video), and RTCP is used to monitor transmission statistics and quality of service. While establishing a session, RTP uses even port numbers, whereas RTCP uses the next corresponding odd port number (higher by one).
RTP provides mechanisms for timing recovery, loss detection and correction, payload and source identification, and media synchronization.
RTCP specifies reports that are exchanged between the source and destination of the session. Reports contain statistics such as the number of RTP-PDUs sent, the number of RTP-PDUs lost, inter-arrival Jitter, and so on. These reports can be used by applications to modify the sender's transmission rates and for diagnostic purposes.
RTP lies over UDP, which lies over IP. In the following diagram, you see the RTP packet structure:

The fields in the header are as follows:
- Version (V): This field indicates the RTP version
- Padding (P): This field indicates that the packet contains one or more additional padding bytes at the end that are not part of the payload
- Extension bit (X): This field indicates a fixed header that follows the standard header
- CSRC count (CC): This field contains the number of CSRC fields that follow the fixed header
- Marker (M): This field is used to indicate application events, for example video frame boundaries
- Payload type: This field identifies the format of the RTP payload to be interpreted by the receiving application
- Sequence number: This field is incremented by one for each RTP packet sent. Used by the receiver to detect packet losses
- Timestamp: This field reflects the sampling rate of octets in the RTP data stream
- Synchronization source (SSRC): This field is the stream identifier that is chosen randomly, so that no two synchronization sources within the same RTP session will have the same SSRC identifier
- Contributing source identifiers list (CSRC): This field identifies the contributing sources (that is, the stream source) for the payload contained in this packet
In the following diagram, you can see how the sequence and timestamps mechanisms work:

As we can see in the diagram, the sequence numbers are increased by one for each RTP packet transmitted, while timestamps increase by the time covered by a packet. Packet number 1, for example, will have both set to 1; packet 2 will have a sequence number of 2 and a timestamp of 12; it goes on in this manner for the other packets. The receiver will receive the sequence numbers that tell him the order of the packets, and timestamps that tell him the time at which they left the receiver. The receiver will use both to play back the received data.
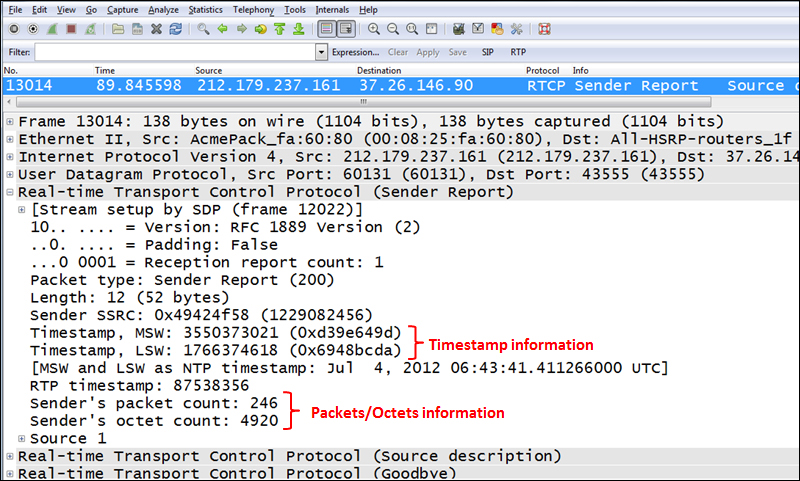
RTCP has several report types, in which the sender and receiver update each other on the data that was sent and received. In the following diagram, you can see an example of this, in which we see a sender report that tells the receiver how many packets and octets were sent, timestamp information, and other parameters that can be used by the receiver.
Delay can come from several sources:
- Coding delay: This is the delay that comes from the digital processing of the voice signals.
- Handling delay (packetization): This delay is the time that it takes to build packets and insert voice information into them.
- Serialization delay: This is the fixed delay that occurs when sending packets over the communication line. This delay depends on packet size and line speed.
- Typical delays (round trip): This is the delay that you can expect when pinging over a communication line (all the following points refer to unloaded lines):
- Over a LAN: The delay is less than 1 ms.
- Over a WAN connection: The delay is 1-2 ms in a short-range connection (up to 250-300 km / 150-190 miles) and about 15-20 ms in long range connections (for example, US coast to coast). In older networks you can add several tens of milliseconds to these numbers.
- For home connections, usually xDSL or CaTV: The delay is somewhere between 10 and 25 ms.
- For inter-continent connections: The delay is somewhere between 100 and 200 ms.
- For cellular connections: The delay ranges from 300 ms to 600 ms for old 2.5G networks (GPRS or CDMA 1X), 120 to 150 ms for 3.0G (UMTS or EVDO), 60 to 100 ms for HSDPA, HSUPA, and HSPA+, and goes down to 20 to 50 ms for LTE networks.
- For satellite communications: The delay is 500 to 600 ms.
Tip
The delay over a communication line is the sum of the time that it takes the light signal to cross the distance and time consumed by switching or routing delays on the service provider network. While technologies since the early 2000s (for example, MPLS or Carrier Ethernet) are implemented fast switches and routers, technologies older than 2000 (such as Frame Relay or ATM) have slower switching times and therefore will have higher delays.