 Using the Endpoints tool from the Statistics menu
by Charit Mishra, Yoram Orzach, James H Baxter
Wireshark Revealed: Essential Skills for IT Professionals
Using the Endpoints tool from the Statistics menu
by Charit Mishra, Yoram Orzach, James H Baxter
Wireshark Revealed: Essential Skills for IT Professionals
- Wireshark Revealed: Essential Skills for IT Professionals
- Table of Contents
- Wireshark Revealed: Essential Skills for IT Professionals
- Credits
- Preface
- 1. Module 1
- 1. Getting Acquainted with Wireshark
- 2. Networking for Packet Analysts
- The OSI model – why it matters
- IP networks and subnets
- Switching and routing packets
- WAN links
- Wireless networking
- Summary
- 3. Capturing All the Right Packets
- Picking the best capture point
- Test Access Ports and switch port mirroring
- Capturing interfaces, filters, and options
- Verifying a good capture
- Saving the bulk capture file
- Isolating conversations of interest
- Using the Conversations window
- Wireshark display filters
- Filter Expression Buttons
- Following TCP/UDP/SSL streams
- Marking and ignoring packets
- Saving the filtered traffic
- Summary
- 4. Configuring Wireshark
- 5. Network Protocols
- The OSI and DARPA reference models
- Transport layer protocols
- Application layer protocols
- Summary
- 6. Troubleshooting and Performance Analysis
- Troubleshooting methodology
- Troubleshooting connectivity issues
- Troubleshooting functional issues
- Performance analysis methodology
- Top five reasons for poor application performance
- Summary
- 7. Packet Analysis for Security Tasks
- 8. Command-line and Other Utilities
- 2. Module 2
- 1. Introducing Wireshark
- 2. Using Capture Filters
- 3. Using Display Filters
- 4. Using Basic Statistics Tools
- Introduction
- Using the Summary tool from the Statistics menu
- Using the Protocol Hierarchy tool from the Statistics menu
- Using the Conversations tool from the Statistics menu
- Using the Endpoints tool from the Statistics menu
- Using the HTTP tool from the Statistics menu
- Configuring Flow Graph for viewing TCP flows
- Creating IP-based statistics
- 5. Using Advanced Statistics Tools
- Introduction
- Configuring IO Graphs with filters for measuring network performance issues
- Throughput measurements with IO Graph
- Advanced IO Graph configurations with advanced Y-Axis parameters
- Getting information through TCP stream graphs – the Time-Sequence (Stevens) window
- Getting information through TCP stream graphs – the Time-Sequence (tcp-trace) window
- Getting information through TCP stream graphs – the Throughput Graph window
- Getting information through TCP stream graphs – the Round Trip Time window
- Getting information through TCP stream graphs – the Window Scaling Graph window
- 6. Using the Expert Infos Window
- 7. Ethernet, LAN Switching, and Wireless LAN
- 8. ARP and IP Analysis
- 9. UDP/TCP Analysis
- Introduction
- Configuring TCP and UDP preferences for troubleshooting
- TCP connection problems
- TCP retransmission – where do they come from and why
- Duplicate ACKs and fast retransmissions
- TCP out-of-order packet events
- TCP Zero Window, Window Full, Window Change, and other Window indicators
- TCP resets and why they happen
- 10. HTTP and DNS
- 11. Analyzing Enterprise Applications' Behavior
- Introduction
- Finding out what is running over your network
- Analyzing FTP problems
- Analyzing e-mail traffic and troubleshooting e-mail problems – POP, IMAP, and SMTP
- Analyzing MS-TS and Citrix communications problems
- Analyzing problems in the NetBIOS protocols
- Analyzing database traffic and common problems
- 12. SIP, Multimedia, and IP Telephony
- Introduction
- Using Wireshark's features for telephony and multimedia analysis
- Analyzing SIP connectivity
- Analyzing RTP/RTCP connectivity
- Troubleshooting scenarios for video and surveillance applications
- Troubleshooting scenarios for IPTV applications
- Troubleshooting scenarios for video conferencing applications
- Troubleshooting RTSP
- 13. Troubleshooting Bandwidth and Delay Problems
- 14. Understanding Network Security
- A. Links, Tools, and Reading
- 3. Module 3
- 1. Welcome to the World of Packet Analysis with Wireshark
- 2. Filtering Our Way in Wireshark
- 3. Mastering the Advanced Features of Wireshark
- 4. Inspecting Application Layer Protocols
- 5. Analyzing Transport Layer Protocols
- 6. Analyzing Traffic in Thin Air
- 7. Network Security Analysis
- 8. Troubleshooting
- 9. Introduction to Wireshark v2
- Bibliography
- Index
In this recipe we will learn how to get statistics on endpoints information of the captured data.
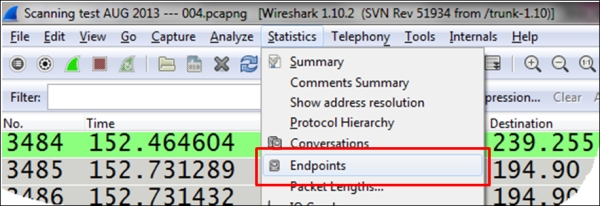
To view the endpoint statistics, follow these steps:
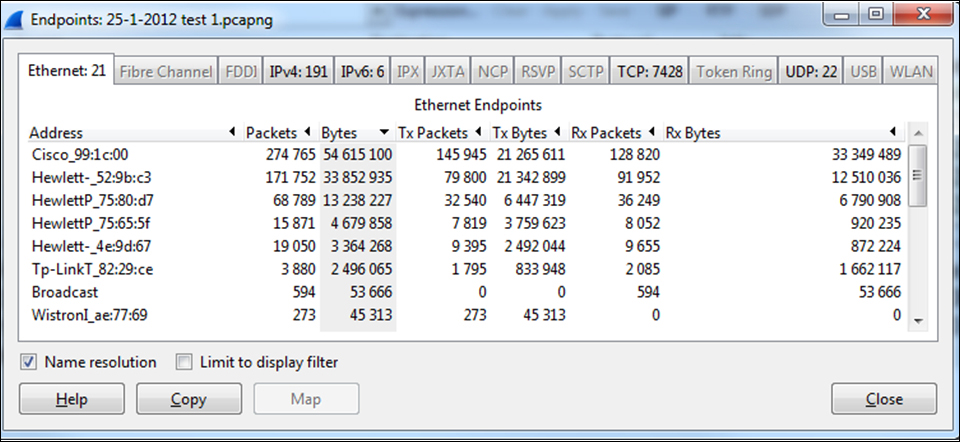
It simply gives statistics on all the endpoints that Wireshark has discovered. It could be any of the situations here:
- Few Ethernet endpoints (these are MAC addresses) with many IP end nodes (these are IP addresses): This will be the case where, for example, we have a router that sends/receives packets from many remote devices, and what we will see is the MAC address of the router and many IP addresses coming/going through it.
- Few IP end nodes with many TCP end nodes: this will be the case for many TCP connections per host. It can be a regular operation of a server with many connections, and it can also be a kind of attack that comes through the network (for example, an SYN attack).
Here you see an example for a capture file taken from a network center, and what we can get from it.
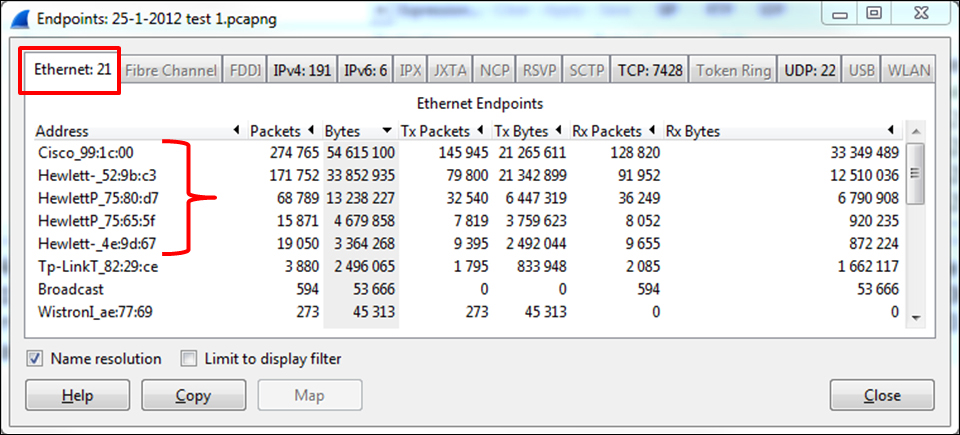
In the following screenshot, we see an internal network with four HP servers and a single Cisco router. We can see this from the first part of the MAC address that is resolved to vendor names:
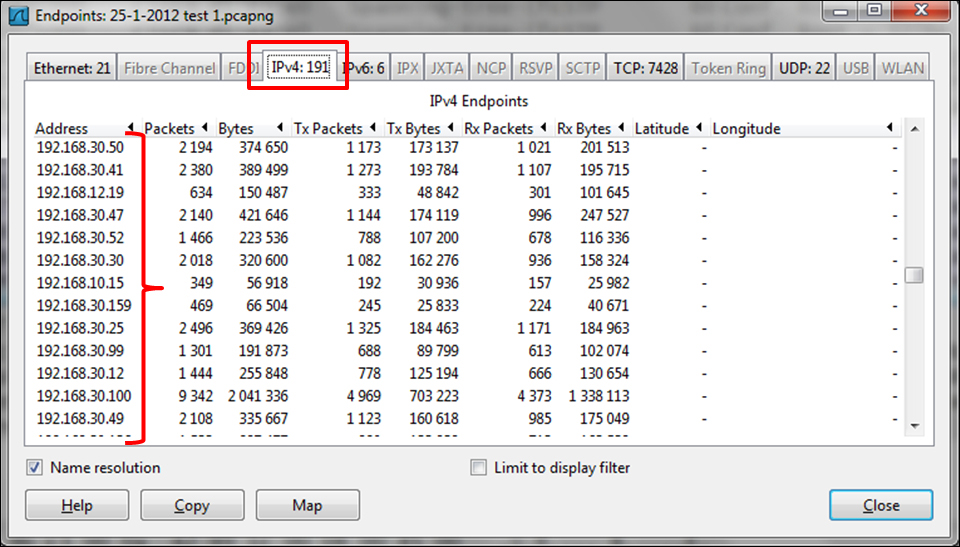
When we choose to see the endpoints under IPv4: 191, we see many endpoints coming from the networks 192.168.10.0, 192.168.30.0, and also other networks.
-
No Comment
..................Content has been hidden....................
You can't read the all page of ebook, please click here login for view all page.