
In order to analyze packets to troubleshoot connectivity, performance, or security issues, you have to successfully capture all of the right packets and then identify and filter out just the packets that pertain to the goal at hand.
In this chapter, we will cover the following topics:
- Picking the best capture point
- TAPs and switch port mirroring
- Wireshark's capture interfaces, filters, and options
- Verifying a good capture
- Isolating the conversation(s) of interest
- Using the Wireshark Conversations window
- Wireshark's display filters
- Filtering expression buttons
- Following TCP/UDP/SSL streams
- Marking and ignoring packets
- Saving filtered traffic
You'll recognize that many of these activities are the same ones that we accomplished in Chapter 1, Getting Acquainted with Wireshark, to perform a capture and filter just the packets involved in loading a web page. In this chapter, we'll expand and finish rounding out your skills in all these topics.
Determining the best location to perform a packet capture depends on several considerations:
If you're troubleshooting a user complaint, the first capture point should be at the user's workstation to gain a view from the user's perspective and verify/clarify the situation that the user is reporting. From this vantage point, you can:
- Ensure that basic network services such as ARP and DNS are working correctly
- Analyze the initial login process if the user authentication involves a different device than the target application server
- Measure network round trip times from the user to the target host(s)
- Determine whether the TCP session setup handshake is appropriate for the application being accessed
- Measure service response times (such as HTTP or SMB response times)
- Determine whether the user is experiencing packet loss and retransmissions, out-of-order packets, or other network-related anomalies
- Capture any application error messages being sent to the user and the requests that resulted in those errors
Capturing from a user's location is usually much simpler from a practical standpoint and there is a lot less traffic to deal with, which makes capture sizes smaller and filtering the packets of interest simpler. Disconnecting a user's Ethernet cable for a few minutes to insert a TAP (we'll discuss these in the next section) or installing Wireshark on the user's workstation does not typically require special authorization or preparation as the risk to other users is negligible.
If a capture from a complaining user's workstation isn't possible or practical, a capture from the server end can still be useful, but it might be advantageous to apply a capture filter to gather just the traffic to/from the user's workstation (based on the user's IP address) to limit the capture file size. You can still measure network round trip times, server response times, analyze TCP handshake details, and detect retransmissions caused by packet loss, and perhaps the login/authentication process from this location.
Capturing from a server location is also appropriate when analyzing backend service response times. For example, if users interact with an application server but that app server performs transactions with a backend database in order to fulfill user requests and if there are complaints of slow response times, then an analysis of application server-to-database server interactions can help isolate the true source of the poor performance to one or the other host and the types of requests that result in slow or erroneous responses.
For the majority of packet captures, you'll likely be at user workstations or server switch ports, but there will also be some cases where captures will need to be performed at other locations.
Identifying the source of excessive packet loss or disordering over a network path may require performing packet captures at various points along that path, typically at distribution or core switch trunks, or interfaces to routers, firewalls, and so on, to find the network segment where packet loss becomes apparent.
Today's modern networks often employ a number of network devices that can actually alter the contents of packets flowing between clients and servers; in some (occasional or last resort) cases, it may be necessary to capture on both sides of these devices to isolate or prove a functional or configuration problem:
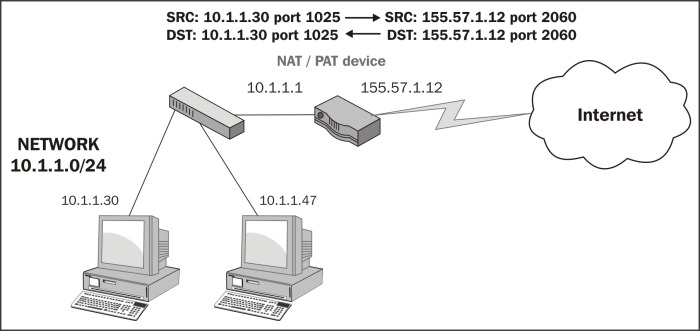
- Routers and gateways: These are also called Internet gateways in some configurations and may be configured to perform a Network Address Translation (NAT) function that alters and hides the user's actual IP address from an outside network. This is done by substituting a public IP address for the user's real address. This usually involves translating port numbers as well so that a single public IP address can be used to support multiple sessions; in which case, the solution is called Port Address Translation (PAT). The end result of the PAT functionality is that a capture from the client side and a capture at the server side of the same session conversation will involve different IP addresses and port numbers.
The following diagram illustrates how a PAT device translates IP addresses and ports from an internal private network to and from an externally visible IP address and has translated the ports used for an individual user session:
- Proxy servers and firewalls: Devices such as these can act as an intermediary between clients wanting to use resources from other (usually external) servers. These devices are most typically deployed between users inside a company and outside (web) services accessed via the Internet. These devices are employed for their security capabilities, allowing administrative control over what can be accessed and the type of data content that can be relayed between the two networks, malware scanning, and so on. From a packet analysis standpoint, you should be aware that in addition to performing a NAT/PAT function, some implementations of these devices may actually terminate a user session on one side and initiate a completely different session between the device and the outside host on the other side, on behalf of the user, such that the TCP handshake and session parameters, IP addresses and port numbers, and packet sizes can all differ on either side.
- IP tunnels using Generic Routing Encapsulation: These are used to connect two IP networks that don't otherwise have a native routing path to each other. The original packets are encapsulated inside packets with different IP addresses appropriate for the network media that they will traverse. The most common use of IP tunneling is to connect private corporate networks together through public Internet connections or to connect Internet Protocol Version 6 (IPv6) networks together over traditional IPv4 network paths. IP tunnels can be configured between routers and high-end switches.
Although it may be necessary (to validate an issue to other support teams) or more practical to capture at or near the interfaces to the devices described earlier, it is usually easier and just as effective to perform the captures at user and/or server locations. Unless you're part of a network support team, you won't have to conduct an analysis in such an advanced and complicated environment.