
The Expert Infos window provides us with a list of events and network problems discovered by Wireshark. In this recipe, we will learn how to start the Expert Infos window and how to refer to the various events.
To start the Expert Infos window, perform the following steps:
Navigate to the Analyze menu and click on Expert Info. The following window will open:
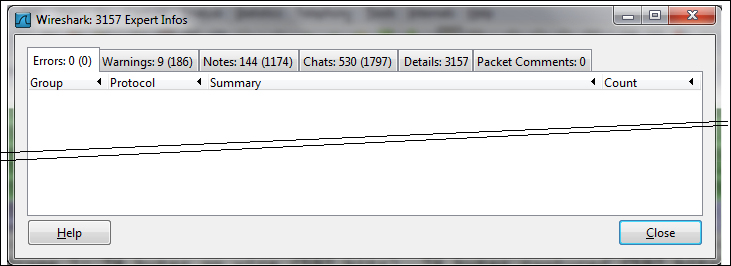
Now you can choose any one of the upper bars: Errors:, Warnings:, Notes:, Chats:, Details:, or Packet Comments:.
The upper bars give you the following information:
- Errors: These are serious problems, mostly malformed packets or missing fields in a protocol header. These can be malformed packets of various types such as malformed SPOOLSS, GTP, or others. These can also be bad checksum errors such as IPv4 bad checksum.
In the following screenshot you can see malformed TCP and SSL packets:

In the following screenshot, you can see another type of error, which is a protocol (in this case the BOOTP/DHCP) option error, that is, when Wireshark identifies a missing field in the packet:

- Warnings: A warning indicates a problem in the application or in communication, things such as TCP zero window, TCP window full, previous segment not captured, out-of-order segment, and others that are unnatural to the protocol behavior. You can see an example of this in the following screenshot:

- Notes: A note is when Wireshark indicates an event that may cause a problem, but is still within the normal behavior of the protocol. TCP retransmission, for example, will be displayed here because even though it is a critical problem that slows down the network, it is still under the normal behavior of TCP. Other events here are duplicate ACK, fast retransmission, and so on.
- Chats: This tab provides information about the usual workflow, for example, TCP connection start (SYN), connection end (FIN), connection reset (RST), HTTP Post, HTTP codes, and so on.
- Details: This tab provides all the events in an ordered list. In older versions of Wireshark, this was directly under the Analyze menu.
- Packet Comments: You can manually add a comment to every packet. This column will show all the comments in the capture file.
To add a comment to a packet, right-click on it and choose Packet Comment.... A window will open in which you will be able to add or change your comment. You can see this in the following screenshot:

To go to the event in the packet capture pane, simply click on the packet under the event in the Expert Infos window, and it will lead you to it.
The Wireshark Expert Infos window is an expert system that provides us with information about problems in the network and also some suggestions to the probable cause of it in some cases. Although it gives reasonable results, always double-check its findings.
There are cases where Wireshark finds problems that are not genuine, and there are other cases where the real problems that exist do not show up.
It can be that you started the capture during a data transfer; so you will see the previous segment's loss messages or even more sophisticated problems, when for some reason (good or not) you have captured only a part of the data, and Wireshark refers to it as a complete stream of data and displays many errors about it. We will see many examples of these issues later in the book.
Expert Info severities can also be filtered and presented in the packet pane by displaying filters. To view events according to display filters, perform the following steps:
- Click on Expression... on the right-hand side of the display filter window.
- Scroll down to get the Expert messages (you can just type the word
expertand you will get there).As illustrated in the following screenshot, you will get the following filters:
expert.message,expert.group, andexpert.severity:
expert.grouprefers to expert message groups. This filter categorizes problems according to their types, for example, checksum problems, TCP sequence-related problems, and so on. Have a look at the following screenshot and you will see a list of these issues: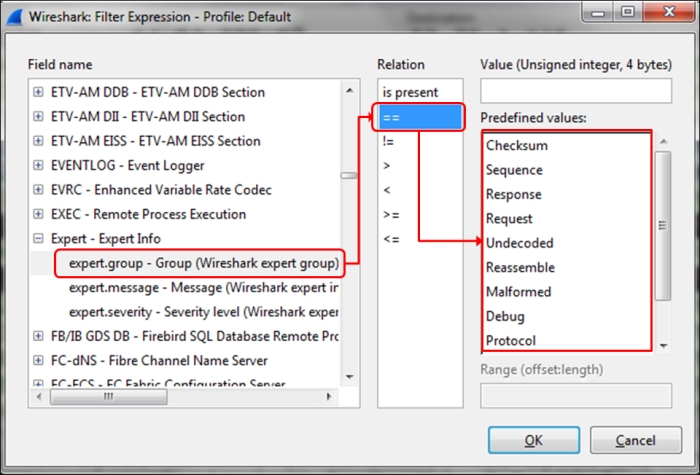
The main categories in
expert.groupare as follows:- Checksum: This indicates an invalid checksum.
- Sequence: This indicates TCP sequence-related problems.
- Response: This indicates application response code problems (4xx response code files).
- Request: This indicates application requests.
- Undecoded: This indicates data that cannot be decoded by dissector.
- Reassemble: This indicates problems while reassembling (usually when a fragment is missing).
- Malformed: This indicates a malformed packet or dissector problem, and the dissection of this packet is aborted.
- Debug: This indicates debugging (should not occur in released versions).
- Protocol: This indicates the violation of protocol specification (for example, missing field, wrong length, and so on), dissection of this packet will probably be continued.
- Comment: This indicates packets with a comment added to them (comments can be added to a packet by right-clicking on it and choosing the Packet comment … option.
expert.messagerefers to specific messages. Here, for example, you can configure a filter that displays a message that contains or matches a specific string.expert.severityrefers to messages with specific severities, that is error, warning, note and so on.
You can also choose to show events severities on the Expert Info window.
- Navigate to Edit | Preferences....
- Choose User Interface.
- In the lower half of the right pane, mark the Display LEDs in the Expert Infos dialog tab labels: checkbox as presented in the following screenshot:

- Click on OK.
- Open the Expert Infos window and the severity LEDs will appear on each bar.

The severity level LED will also appear on the lower left corner of the Wireshark main window.
- Chapter 9, UDP/TCP Analysis