 Configuring Flow Graph for viewing TCP flows
by Charit Mishra, Yoram Orzach, James H Baxter
Wireshark Revealed: Essential Skills for IT Professionals
Configuring Flow Graph for viewing TCP flows
by Charit Mishra, Yoram Orzach, James H Baxter
Wireshark Revealed: Essential Skills for IT Professionals
- Wireshark Revealed: Essential Skills for IT Professionals
- Table of Contents
- Wireshark Revealed: Essential Skills for IT Professionals
- Credits
- Preface
- 1. Module 1
- 1. Getting Acquainted with Wireshark
- 2. Networking for Packet Analysts
- The OSI model – why it matters
- IP networks and subnets
- Switching and routing packets
- WAN links
- Wireless networking
- Summary
- 3. Capturing All the Right Packets
- Picking the best capture point
- Test Access Ports and switch port mirroring
- Capturing interfaces, filters, and options
- Verifying a good capture
- Saving the bulk capture file
- Isolating conversations of interest
- Using the Conversations window
- Wireshark display filters
- Filter Expression Buttons
- Following TCP/UDP/SSL streams
- Marking and ignoring packets
- Saving the filtered traffic
- Summary
- 4. Configuring Wireshark
- 5. Network Protocols
- The OSI and DARPA reference models
- Transport layer protocols
- Application layer protocols
- Summary
- 6. Troubleshooting and Performance Analysis
- Troubleshooting methodology
- Troubleshooting connectivity issues
- Troubleshooting functional issues
- Performance analysis methodology
- Top five reasons for poor application performance
- Summary
- 7. Packet Analysis for Security Tasks
- 8. Command-line and Other Utilities
- 2. Module 2
- 1. Introducing Wireshark
- 2. Using Capture Filters
- 3. Using Display Filters
- 4. Using Basic Statistics Tools
- Introduction
- Using the Summary tool from the Statistics menu
- Using the Protocol Hierarchy tool from the Statistics menu
- Using the Conversations tool from the Statistics menu
- Using the Endpoints tool from the Statistics menu
- Using the HTTP tool from the Statistics menu
- Configuring Flow Graph for viewing TCP flows
- Creating IP-based statistics
- 5. Using Advanced Statistics Tools
- Introduction
- Configuring IO Graphs with filters for measuring network performance issues
- Throughput measurements with IO Graph
- Advanced IO Graph configurations with advanced Y-Axis parameters
- Getting information through TCP stream graphs – the Time-Sequence (Stevens) window
- Getting information through TCP stream graphs – the Time-Sequence (tcp-trace) window
- Getting information through TCP stream graphs – the Throughput Graph window
- Getting information through TCP stream graphs – the Round Trip Time window
- Getting information through TCP stream graphs – the Window Scaling Graph window
- 6. Using the Expert Infos Window
- 7. Ethernet, LAN Switching, and Wireless LAN
- 8. ARP and IP Analysis
- 9. UDP/TCP Analysis
- Introduction
- Configuring TCP and UDP preferences for troubleshooting
- TCP connection problems
- TCP retransmission – where do they come from and why
- Duplicate ACKs and fast retransmissions
- TCP out-of-order packet events
- TCP Zero Window, Window Full, Window Change, and other Window indicators
- TCP resets and why they happen
- 10. HTTP and DNS
- 11. Analyzing Enterprise Applications' Behavior
- Introduction
- Finding out what is running over your network
- Analyzing FTP problems
- Analyzing e-mail traffic and troubleshooting e-mail problems – POP, IMAP, and SMTP
- Analyzing MS-TS and Citrix communications problems
- Analyzing problems in the NetBIOS protocols
- Analyzing database traffic and common problems
- 12. SIP, Multimedia, and IP Telephony
- Introduction
- Using Wireshark's features for telephony and multimedia analysis
- Analyzing SIP connectivity
- Analyzing RTP/RTCP connectivity
- Troubleshooting scenarios for video and surveillance applications
- Troubleshooting scenarios for IPTV applications
- Troubleshooting scenarios for video conferencing applications
- Troubleshooting RTSP
- 13. Troubleshooting Bandwidth and Delay Problems
- 14. Understanding Network Security
- A. Links, Tools, and Reading
- 3. Module 3
- 1. Welcome to the World of Packet Analysis with Wireshark
- 2. Filtering Our Way in Wireshark
- 3. Mastering the Advanced Features of Wireshark
- 4. Inspecting Application Layer Protocols
- 5. Analyzing Transport Layer Protocols
- 6. Analyzing Traffic in Thin Air
- 7. Network Security Analysis
- 8. Troubleshooting
- 9. Introduction to Wireshark v2
- Bibliography
- Index
In this recipe we will learn how to use the Flow Graph feature.
Open Wireshark and from the Statistics menu choose Flow Graph. The following window will open:

You can choose several options in the Flow Graph window, such as:
- What to view:
- Choose All packets: for viewing all captured packets
- Choose Displayed packets: for viewing only filtered packets
- Flow type:
- General flow will show all captured or displayed packets (for what you choose before).
- TCP flow will show only TCP flags, sequence, and ACK numbers. This graph provides a very partial picture of the flow.
Understanding TCP problems is sometimes quite complex. The best way to do it most of the time is to use graphical software that have better graphical interface, or simply take a piece of paper along with different colored pens and draw it yourself.
A friendly software that can do the job is the Cascade Pilot package by the developers of Wireshark which can be found at http://www.riverbed.com/us/products/cascade/wireshark_enhancements/cascade_pilot_personal_edition.php
You can see an example of a self-made graph in the following image:
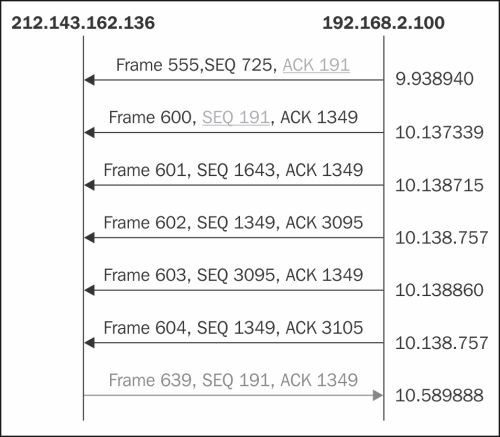
After preparing a few graphs, you will know them like the back of your hand.
-
No Comment