
Wireshark offers a number of features that can be configured to enhance the accuracy and ease of performing packet analysis activities such as troubleshooting a functional or performance problem. Selecting the best format to measure the elapsed time between packets is an important factor. There are a number of protocol-specific options that affect how Wireshark displays time-related information that are useful as well. Coloring rules, preferences settings, and profiles let you customize Wireshark for your particular style of analysis, as well as the different environments that you might work in.
In this chapter, we will cover the following topics:
- Working with packet timestamps
- Colorization and coloring rules
- Wireshark preferences
- Wireshark profiles
These topics will wrap up our introduction to the most essential and useful features and options of Wireshark.
Understanding how Wireshark handles time and using the right incarnation of packet timestamp displays is crucial to properly analyze packet flows and identify time-related anomalies.
When packets are captured, Wireshark gives each packet a timestamp derived from the system clock of the machine from where the capture takes place. This timestamp is converted to Universal Coordinated Time (UTC) based on an offset calculated from the time zone setting and any Daylight Savings Time (DST) rules that apply for the capture machine, and then converted again to an epoch number (the UTC-based number of seconds since January 1, 1970). This is the time value that gets saved in the capture file for each packet. When Wireshark reads the capture file, it turns the epoch number back to the familiar date and time display, adjusted for the time zone and DST offsets for your machine.
This means that if a packet capture is conducted on a machine in Los Angeles, which has an offset from UTC of -8 hours, and you look at the same capture file on a machine in Berlin, which is UTC +1 hour (an overall difference of 9 hours, plus any DST differences), a packet that was captured at 10 a.m. local time in Los Angeles will display a timestamp of 7 p.m. in Berlin.
Examples of the timestamp displays in different time zones are shown in the following table:
|
Los Angeles |
London |
Berlin |
Bangalore | |
|---|---|---|---|---|
|
Capture file time (UTC) |
10:00 |
10:00 |
10:00 |
10:00 |
|
Local offset to UTC |
-8 |
0 |
+1 |
+5:30 |
|
Displayed time (local time) |
02:00 |
10:00 |
11:00 |
17:30 |
If you're going to look at a packet capture someone has sent you and the absolute time when an event occurred is important to the analysis, you'll need to know or ask what time zone the capture was taken in, determine the offset between your time zone and the capture location time zone, and mentally make the time difference adjustment for the timestamps that Wireshark will display. Otherwise, this difference won't matter as you're usually more interested in the elapsed time or the time between specific events in the capture.
There are a wide variety of packet time displays available for use in Wireshark. By default, Wireshark provides a Time column in the Packet List pane configured to display Seconds Since Beginning of Capture with microsecond resolution (123.123456) for each packet.
However, the way in which time is displayed in this column can be changed by selecting the desired format from the Time Display Format option in the View menu, which is illustrated in the following screenshot:
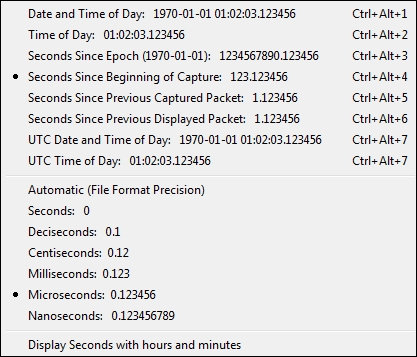
If the Seconds Since Beginning of Capture option is in use, the first packet in a capture displays a time value of 0.000000; all other packets are timed in reference to this first packet such that the elapsed time from the beginning of the capture is displayed.
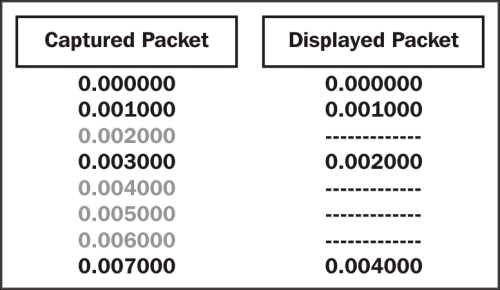
The time display menu options provide examples of their formats and are fairly self-explanatory, except perhaps Seconds Since Previous Captured Packet and Seconds Since Previous Displayed Packet. The Seconds Since Previous Captured Packet option provides the elapsed time between each captured packet, while the Seconds Since Previous Displayed Packet option displays the elapsed time from the previous packet that is visible when a display filter is applied.
The way the Displayed Packet option works is illustrated in the following screenshot. You can see how the Captured Packet timestamps continue to increment, while the Displayed Packet timestamps show the time since the last displayed packet.
The time display precision options in the Time Display Format menu are also shown with examples of the display format and are self-explanatory, except for the Automatic (File Format Precision) setting, which requires a description.
Wireshark relies on the NIC driver and the capture devices' system clock for packet timestamps. The accuracy of these timestamps in terms of the precision and number of subsecond digits (milliseconds, microseconds, and nanoseconds) will vary, but usually a millisecond resolution is available. This precision value is saved in the capture file. The Automatic (File Format Precision) setting tells Wireshark to display timestamps using this precision value.
The ability to use the Nanoseconds precision setting depends on having an NIC driver that supports this level of precision. If you select this option and the capture file doesn't contain the higher resolution, the last three digits of each timestamp will be all zeroes.
It is often helpful to have two (or more) time columns in the Packet List pane to provide a variety of time display types without having to change the format of a single time column back and forth. You can add a new time column using one of two methods.
The following is the first method, the preferences settings method:
- Go to Preferences from the Edit menu, or click on the Preferences icon to open the Preferences window.
- Select Columns.
- Click on Add to add a new entry at the bottom of the list.
- Click on the Title area of the new entry and give the column a name.
- Ensure that the new entry is highlighted, and select the desired time display format from the drop-down Field type box.
- Click and drag the new entry up the list to select its relative position in the Packet List pane.
- Finally, click on OK.
The selectable options in the Field type box for time display columns include the following:
- Absolute date, as YYYY-MM-DD, and time: This is the actual capture date and time based on the time zone of the capture device.
- Absolute date, as YYYY/DOY, and time: This is another format to display the date and time based on the time zone of the capture device.
- Relative time: This is the time from the first packet in a capture file. This is similar to the Seconds Since Beginning of Capture option.
- Relative time (conversation): This is the time from the first packet in the trace file for a conversation (this doesn't work).
- Delta time: This is the elapsed time from the previous packet to the current packet.
- Delta time (conversation): This is the time from the previous packet to the current packet in a conversation (this doesn't work).
- Delta time displayed: This is the time from the end of one packet to the end of the next displayed packet only.
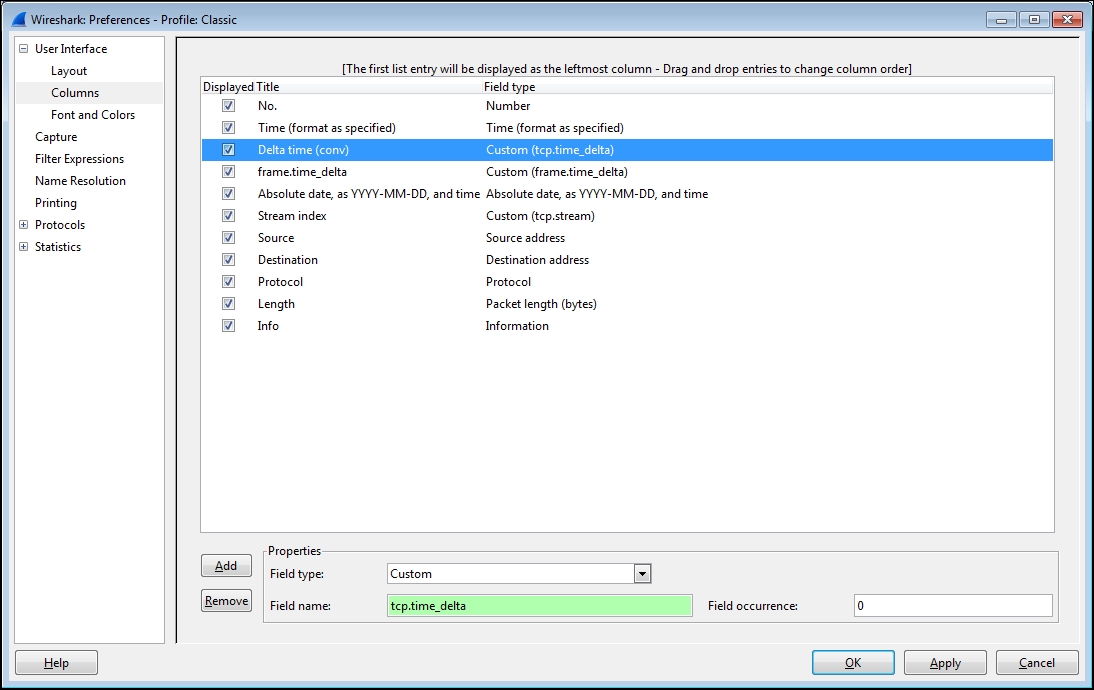
- Custom: The Relative time (conversation) and Delta time (conversation) options, which are also listed in the preferences settings, no longer work in the version of Wireshark currently available (v1.12) as of this writing. You can accomplish the previously offered functionality with these options by using the Custom option with display filter-style Field types instead. Select the Custom Field type and enter either
tcp.time_relativeortcp.time_deltain the Field name field, leaving the Field occurrence field with the default entry of 0.
An example of creating a functional Delta time (conv) time column using the Custom option and the tcp.time_delta display filter is shown in the following screenshot:
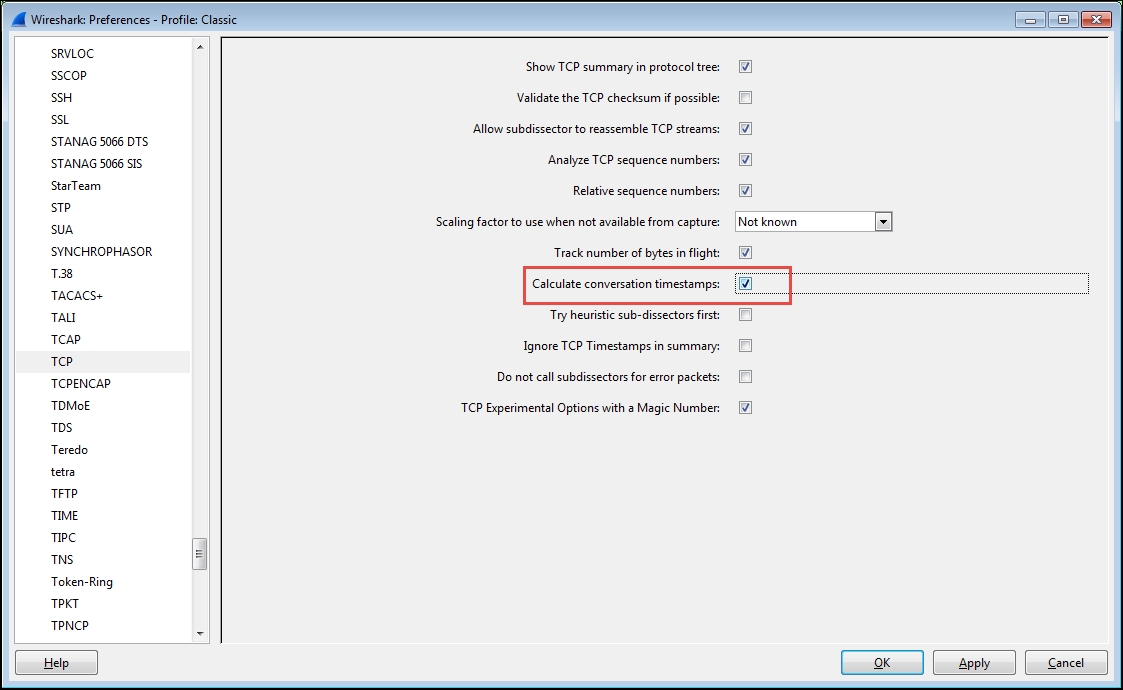
For the tcp.time_relative and tcp.time_delta fields to work properly, you must also enable Calculate conversation timestamps in the preferences settings using the following steps:
- In the Preferences window, select TCP from the Protocols menu.
- Enable the Calculate conversation timestamps option.
- Finally, click on OK.
An example of enabling Calculate conversation timestamps is depicted in the following screenshot:
The following steps show you the second method, the right-click method of adding a column:
- Select an appropriate packet in the Packet List pane.
- In the Packet Details pane, expand the Frame header, or if applicable, expand the Transmission Control Protocol header.
- Locate the desired time value field in the Frame or TCP sections (these are surrounded by brackets). If you are selecting a time value in the TCP section, you will need to expand the [Timestamps] section to see the values.
- Right-click on the desired time field and select Apply as Column from the menu.
- The new column will appear beside the Info column in the Packet List pane. Click and drag the new column to the desired location.
- You can right-click on the new column header, select Edit Column Details, and give the column a shorter name if desired.
As previously discussed in the preferences settings method, you must enable Calculate conversation timestamps in the TCP protocol option of the preferences settings to view and use the time values in the TCP section.
The difference between time displays for a conversation versus a displayed packet time option is perhaps subtle but important.
As illustrated previously, if you are using one of the displayed packet time options, the time value shown for a given packet will be the elapsed time since the previous packet was displayed in the Packet List pane. This time value option has no useful value until you apply a display filter, after which you can easily see the elapsed time between each packet being displayed with no other mental math or adjustments necessary. This is very useful if you're sequentially filtering, clearing, and viewing more than one conversation using, for example, a tcp.stream==xx display filter setting.
If you are not using a display filter, however, there may be packets from multiple conversations displayed in the Packet List pane. If you are using one of the conversations time displays, the time value shown for a given packet will be the elapsed time since the previous packet for that conversation, regardless of other packets that may be interspersed and visible between the packet you're looking at and the previous packet in that conversation. This allows a quick perusal of conversation packet times without having to apply a display filter.
With so many time display options available, it may be difficult to know when and where to use a given option. Choosing the optimal time display in a Wireshark time column depends greatly upon the objectives of the analysis:
- If you need to know the specific date and time of day when an event occurred in a capture, as might be the case if you're trying to find and correlate packets with user-reported events or log entries, you should use one of the Absolute time formats.
- If you're looking for an event that occurred some known period of time after a capture started, use one of the Relative time formats.
- On the other hand, if you just need to measure the time between certain packets, such as when measuring the time between a request and a response, one of the Delta time formats will be the most helpful.
Another useful Wireshark feature is the Time Reference menu option, which can be used to measure time from one packet to another in the midst of a capture file. You can click on a specific packet and toggle this option on and off for that packet using either the Set/Unset Time Reference option from the Edit menu, or by right-clicking and selecting the Set Time Reference (toggle) option from the pop-up menu. The packet will be marked with a *REF* designator in the first time column, and any relative timestamps following the Time Reference packet will be displayed relative to that packet.
The Time Reference setting is temporary; it isn't saved to a capture file and will disappear if you reload the file.