This section categorizes each of the built-in text and visual reports by the activities or requirements that dictate the different ways you might need to present your project information. There are overview reports, reports about current activities, reports about costs, and reports about resource allocation. These groupings can help you determine which report would best suit your needs in a specific situation.
Remember, to generate a text report, click Report, Reports. To generate a visual report, click Report, Visual Reports. Each report description in this section indicates whether the report is a text or visual report, and also specifies the category in which the report is found.
Note
In many cases throughout this section, there is no illustration of a report with its description. This is because many of the reports are so dense with information that to shrink them to illustration size would render them illegible. The best idea is for you to open a project, either a real project or a sample, and generate the reports yourself while you read about them here. You’ll see the details of what each report can provide for you, and therefore understand how you might actually use a given report.
Overview reports are well-suited for executives and members of upper management who need more generalized project information and status. Overview reports provide summary project information at a glance.
The Project Summary text report, in the Overview category, focuses on the most important information in the project plan and is particularly useful to upper management because of its concise presentation of overall project data.
The information in the Project Summary report is the same as that available in the Project Statistics dialog box. It includes a high-level summary of rolled-up dates, duration, work, costs, work and resource status, and notes. The format is designed for easy comparison of baseline (planned) versus actual data.
The Top-Level Tasks text report, in the Overview category, presents information about the project plan’s summary tasks. It displays the results of the top summary tasks, rolling up all the data from any subtasks. This is most useful for organizations that are clearly divided into functional groups. If each group has its own section at the same level in the project plan, the Top-Level Tasks report quickly shows the status of each group’s efforts (see Figure 12-10).
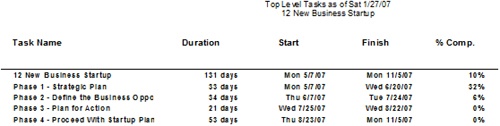
The Top-Level Tasks report is based on the Summary table for tasks, with the Top Level Tasks filter applied. The report includes the top-level summary tasks and their rolled-up durations, start and finish dates, percentage complete, cost, and work.
The Critical Tasks text report, in the Overview category, filters your project information to show only those tasks that are most likely to affect the project finish date; that is, critical tasks. In addition to displaying task notes, this report provides a subtable containing successor task information under each task, which shows the other tasks that will be affected by progress on the critical task.
Because task information is always changing, it’s a good idea to print the Critical Tasks report very shortly before presenting it for review. This report also lists any summary tasks to the critical tasks and any indicators from the Task Entry view.
The Critical Tasks report is typically used to explain why problems are occurring in a project. If the list becomes too lengthy, you can filter it down further:
In the Overview Reports dialog box, click Critical Tasks and then click Edit.
Be sure that the Definition tab is showing in the Task Report dialog box.
In the Filter list, click any of the filters to define the type of critical tasks you want to see in the report.
The Critical Tasks report is based on the task Entry table with the Critical filter applied. The report includes durations, start and finish dates, indicators, notes, and successor fields for all critical tasks.
Note
For more information about critical tasks, see the section titled Working with the Critical Path and Critical Tasks in Chapter 9.
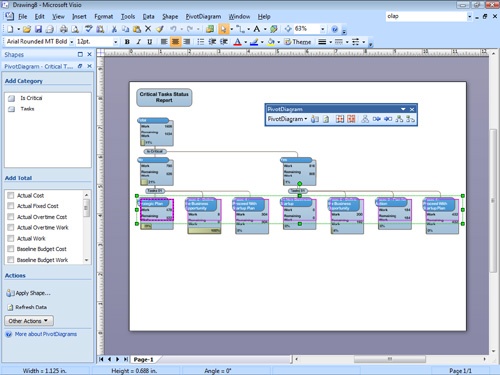
The Critical Tasks Status Report is a Visio visual report in the Task Summary category. It displays a PivotDiagram showing scheduled work and remaining work for critical and noncritical tasks (see Figure 12-11). The data bar at the bottom of each node specifies the percentage of work complete.
The Milestones text report, in the Overview category, filters your project tasks to show only milestone tasks and associated information. This high-level report helps you focus on key events and dates in your project.
The Milestones report is based on the task Entry table with the Milestone filter applied. The report includes durations, start and finish dates, indicators, and notes for all milestone tasks.
Note
For more information about milestones, see the section titled Creating Milestones in Your Schedule in Chapter 5.
The Working Days text report, in the Overview category, specifies which days are working days and which are nonworking days for each base calendar used in the project (see Figure 12-12). You might use several base calendars to reflect the scheduled working days of different functional groups or to reflect working times specified by labor contracts.
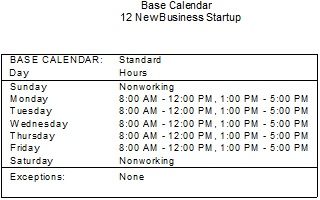
Figure 12-12. The Working Days report shows working days for each base calendar used in the project.
Note
The Working Days report shows working and nonworking time for each base calendar as well as any exceptions to the norm. For more information about calendars, see the section titled Setting Your Project Calendar in Chapter 3.
Reports that focus on the schedule and current progress of tasks are useful for everyday or weekly checks to make sure that tasks are moving along according to plan. Such reports are designed for more frequent usage and geared toward audiences more directly involved with the work of the project. For example, project teams can use these reports at weekly status meetings. Functional groups in a project can use these reports to quickly check how they are measuring up against the project plan. You might rely on these reports toward the end of projects, when current task status must be monitored frequently.
Text reports specializing in schedule progress are found in the Current Activity Reports dialog box. There are six text reports in the Current Activity Reports category (see Figure 12-13).
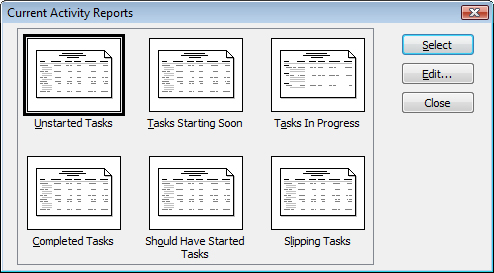
Figure 12-13. The Current Activity Reports dialog box shows the available text reports for this category.
Visual reports specializing in schedule progress are found in the Assignment Summary and Assignment Usage categories.
Tasks in the project that have not had any actual progress reported are displayed in the Unstarted Tasks text report, in the Current Activities category. Generally, the number of tasks displayed decreases as the project progresses, so this report can be especially useful toward the end of the project. This information can help with planning expenditures, deploying tools and materials, and quickly assessing the amount of work yet to be done. This report is also effective at showing functional leads and team members the scope of their required efforts.
The Unstarted Tasks report is based on the Entry table with the Unstarted Tasks filter applied. The report includes the task duration, start and finish dates, predecessors, and indicators. Assigned resource information is listed in a subtable under the associated task.
The Tasks Starting Soon text report, in the Current Activities category, is actually a subset of the Unstarted Tasks report. The format is similar to the Unstarted Tasks report. The difference is that the Date Range filter is applied. You specify the dates for the tasks you want to see in the report.
The Tasks In Progress text report, in the Current Activities category, is a handy tool that enables you to keep close track of work currently being done. This report quickly shows the amount of work that has started; it also points out tasks that are behind schedule. The in-progress tasks are grouped by month.
Grouping tasks by the month of their start dates helps managers see the longest ongoing tasks that are still unfinished. Using this report regularly helps prevent managers from overlooking (or forgetting) the status updates and long-overdue tasks.
The Tasks In Progress report is based on the Entry table with the Tasks In Progress filter applied. The report includes the task duration, start and finish dates, predecessors, indicators, and assignment schedule information.
The other end of the spectrum of status reports about current progress is the report showing all 100% completed tasks, grouped by month (see Figure 12-14).
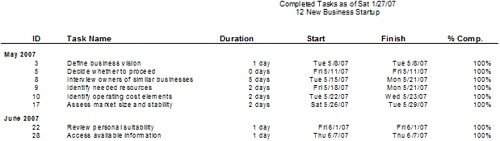
The Completed Tasks text report, in the Current Activities category, is significant for both historical reference and as a record of the team’s accomplishments. It provides real data about "lessons learned," helps estimate task durations for future projects, and gives you a general idea of how much work is left to do in the current project. Another important use of this report is to boost team morale, increase motivation, and foster pride in team accomplishments. Although the project goal is paramount, accomplishments and successes to date can be recognized.
The Completed Tasks report is based on the Summary table with the Completed Tasks filter applied. The report includes the task duration, start and finish dates, total cost, and total work.
The Should Have Started Tasks text report, in the Current Activities category, is most effective when used regularly. This report alerts you to all tasks whose scheduled start dates have passed but for which no progress information has been reported to indicate that work on the task has begun. Sometimes, the data shown in this report reflects missing status updates, making this report an effective tool for optimizing the flow of communication on project progress.
When you select this report, you’re prompted to enter a Should Start By date. Any tasks that do not have an actual start date entered and that are scheduled to start on or before a given date (usually the current date) are displayed in this report.
The Should Have Started Tasks report is based on the Variance table with the Should Start By filter applied. Tasks are sorted by start date. The report includes the baseline and scheduled start and finish dates, along with the start variance field. It also includes task notes and subtables for successor task to show the tasks immediately affected by those starting late.
The Slipping Tasks text report, in the Current Activities category, can only be generated for projects with a baseline saved. The focus of this report is the list of tasks that have started but that will finish after their baseline finish date. This slipping of the finish date can be caused by the start date occurring later than originally planned or by an increase in the duration.
The Slipping Tasks report is based on the Variance table with the Slipping Tasks filter applied. Tasks are sorted by start date. The report includes the baseline and scheduled start and finish dates, along with the start variance field. It also includes task notes and subtables for successor task to show the tasks immediately affected by the slipping tasks.
Note
For more information about setting and using a baseline, see Chapter 10.
The Baseline Report is a Visio visual report in the Assignment Usage category. It displays a PivotDiagram of the project broken down by quarter, and then by task. The diagram compares scheduled work and cost to baseline work and cost for each task. Icons show when scheduled values for work and cost exceed the baseline values.
The Baseline Work Report is an Excel visual report in the Assignment Usage cateogry. It displays a column chart showing baseline, scheduled, and actual work for each task.
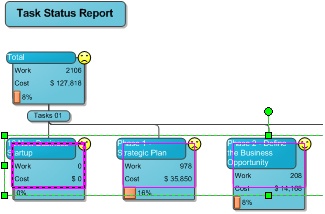
The Task Status Report is a Visio visual report in the Assignment Summary category. It displays a PivotDiagram showing work and percentage of work complete for all tasks in the project (see Figure 12-15). Icons show when baseline work exceeds scheduled work, when baseline work equals scheduled work, and when scheduled work exceeds baseline work. The data bar at the bottom of each node indicates the percentage of work complete.
Microsoft Project cost reports are a powerful and effective means of tracking the fiscal health of a project. By using these reports, you can quickly and accurately focus on the pressing cost issues and catch potential problems early. Because the costs are directly tied to the tasks and the resources assigned to those tasks, you can generate these reports without having to rekey or recalculate values—Microsoft Project does it all for you.
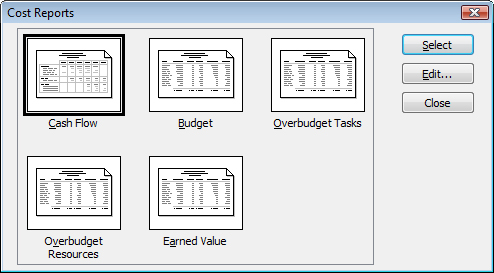
Text reports specializing in costs are found in the Cost category, where five reports are available for reviewing your project’s costs and budget (see Figure 12-16).
Visual reports specializing in costs are found in the Task Usage, Resource Usage, and Assignment Usage categories.
The Cash Flow text report, in the Costs category, is a crosstab report that displays total scheduled costs by each task and by each week in the project timespan (see Figure 12-17).
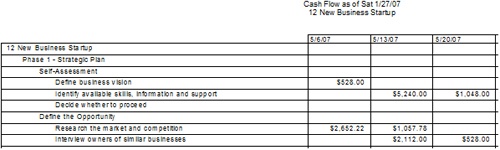
Use this report to see the costs that go into the performance of tasks (assigned human resources, materials, equipment, fees, and fixed costs) per time period. The information shown also enables quick comparisons with baseline budgets or projections, especially when used in conjunction with others, such as the Overbudget Tasks Report, the Tasks In Progress Report, and the Slipping Tasks Report—both to show cost impacts and to clarify budget and earned value figures.
The tasks are listed in order, along with their summary tasks. Rolled-up costs for the summary tasks are included so you can see interim totals for phases or types of work. The costs for each week and each task are totaled.
Note
For more information about establishing project costs, see Chapter 8.
The Cash Flow Report in Excel is a visual report in the Task Usage category. Use this report to generate a bar graph with cost and cumulative cost amounts shown over time. This report is based on timephased task data.
The Cash Flow Report in Visio is a visual report in the Resource Usage category. Use this report to produce a diagram that shows planned and actual costs for your project over time. Costs are broken down by resource type (work, material, cost). An icon displays next to any node in which planned costs exceed baseline costs.
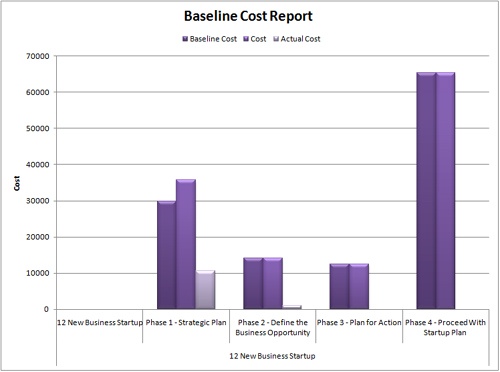
The Baseline Cost Report is an Excel visual report in the Assignment Usage category. It displays a column chart comparing baseline, scheduled, and actual costs in groupings by task (see Figure 12-18).
The Budget text report, in the Costs category, lists all project tasks in order of total cost. Use the Budget report to quickly focus on your "big ticket" tasks.
The Budget report is based on the Cost table for tasks. The total scheduled costs for each task are listed, sorted from highest to lowest cost. The total costs include forecasted costs as well as any actual costs that have accrued as a result of tasks started, in progress, or completed. Also included are any task fixed costs and fixed cost accrual (start, end, prorated). The baseline costs and variances between baseline and total costs show whether you’re over budget or under budget, or exactly as originally planned. The actual and remaining cost fields show costs for completed and in-progress tasks. Each column of cost data is totaled.
The Budget Cost Report is an Excel visual report in the Assignment Usage category. It displays a column chart showing groupings of budget, baseline, scheduled, and actual costs over time.
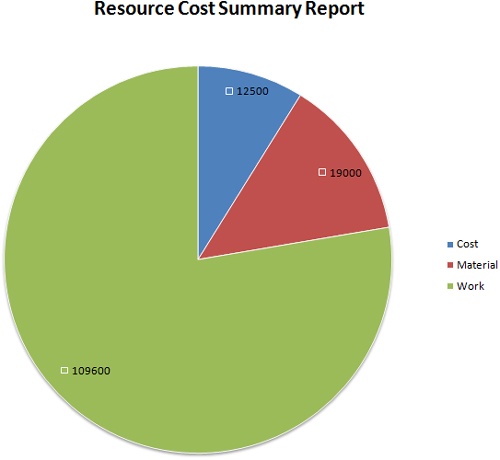
The Resource Cost Summary Report is an Excel visual report in the Resource Usage category. It displays a pie chart showing the distribution of resource costs among the work, material, and cost resources assigned to tasks in the project (see Figure 12-19).
The Overbudget Tasks text report, in the Costs category, provides a quick look at all tasks in the project whose actual or scheduled costs are higher than their baseline costs. This includes costs associated with resources assigned to these tasks as well as any fixed costs for tasks. Obviously, this report can be used only for projects with saved baselines. The columns of data are the same as those in the Budget report, but the report filter selects only those tasks whose costs are higher than the baseline.
The Overbudget Tasks report is based on the Cost table with the Cost Overbudget filter applied. The amount of cost variance is listed, and the tasks are sorted in order of the highest variance first. This report is most useful for analyzing the extent of cost overruns for specific tasks.
Note
For more information about adjusting costs to conform to your budget, see the section titled Reducing Project Costs in Chapter 9.
Like the Overbudget Tasks report, the Overbudget Resources report shows the resources whose actual costs exceed those in the baseline plan.
The Overbudget Resources text report, in the Costs category, is based on the Cost table for resources with the Cost Overbudget filter applied. Tasks are sorted by cost variance. The Cost, Baseline Cost, Variance, Actual Cost, and Remaining Cost columns are included and totaled for all overbudget resources.
Usually, the reason these resources are over budget is that their tasks are requiring more work than originally planned. This report is most useful for analyzing the extent of cost overruns for specific resources.
Note
For more information about reviewing and controlling costs in your project, see the section titled Monitoring and Adjusting Costs in Chapter 11.
Troubleshooting
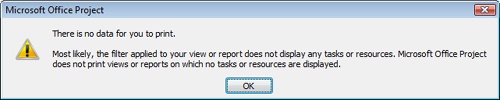
Microsoft Project says there is no data to print
If you try to generate a text report, and you get a message saying that there is no data to print, it typically means that the filter that the report is based on is not returning any fields.
Single-click the name of the text report you want and then select Edit. The dialog box that appears shows how the report is defined, including the fields and filters the report is based on. If there is no data in those fields, or if the applied filter finds no match in your project, this might explain why the report is not generated on your project data.
If you get this message when you’re trying to generate the Overbudget Tasks or Overbudget Resources reports, either all your tasks and resources are under budget or right on target. It can also indicate that:
You haven’t entered costs for assigned resources. These costs become a part of your baseline to determine your target budget figures. Display the Resource Sheet and enter costs for resources in the Std. Rate field. You might need to set a new baseline.
You haven’t entered fixed costs for tasks. These costs become a part of your baseline to determine your target budget figures. Apply the Cost table to a task sheet and make any necessary entries in the Fixed Cost field for the tasks. You might need to set a new baseline.
You haven’t set a baseline yet. The baseline determines your target budget figures. Click Tools, Tracking, Set Baseline.
You haven’t entered any tracking data for in-progress or completed tasks. Select the task(s) and then click Tools, Tracking, Update Tasks.
The Should Have Started Tasks and Slipping Tasks reports are also based on variances between the current scheduled start dates and the baseline start dates. If no baseline has been saved, or if there is no variance between the baseline start and scheduled start, there is no data to print for this report.
The Earned Value text report, in the Costs category, is based on the concept of comparisons between planned and actual costs. More specifically, earned value is the analysis of cost performance based on comparisons between the baseline and actual costs and between the baseline and actual schedule.
The earned value analysis always uses a specific date as the reference point for the comparisons being made. This date is referred to as the status date, or sometimes the cutoff date. To set a status date that’s different from today’s date, click Project, Project Information and then enter a date in the Status Date box.
The Earned Value report is based on the Earned Value table for tasks. Every nonsummary task is listed along with its earned value calculations for BCWS (Budgeted Cost of Work Scheduled), BCWP (Budgeted Cost of Work Planned), ACWP (Actual Cost of Work Performed), SV (Schedule Variance), CV (Cost Variance), EAC (Estimate At Completion), BAC (Budget At Completion), and VAC (Variance At Completion).
Note
By default, the EAC, BAC, and VAC columns of the table flow over onto a second page, even though the report is set up to print in landscape orientation. To adjust the layout so that all columns fit on a single page, click Page Setup in the report preview window. On the Page tab, under Scaling, change the Adjust To percentage to a smaller value, for example 75. The Fit To option is not available for this report.
Note
For more information about working with the report layout, see the section titled Adjusting the Page Setup of a Report later in this chapter. For more detailed information, including the underlying calculations, about earned value analysis, see Chapter 13.
The Earned Value Over Time Report is an Excel visual report in the Assignment Usage category. It displays a line chart that plots a line each for Actual Cost of Work Performed (ACWP or AC), Budgeted Cost of Work Performed (BCWP or planned value), and Budgeted Cost of Work Performed (BCWP or earned value). Based on timephased task data, the lines are plotted over time.
Reports that focus on resource assignment work and resource allocation are useful for generating to-do lists for resources and their assigned tasks, to follow up with resources and their current task progress, or to determine who has too many assignments in the available time.
Four text reports relate to resource assignments (see Figure 12-20).
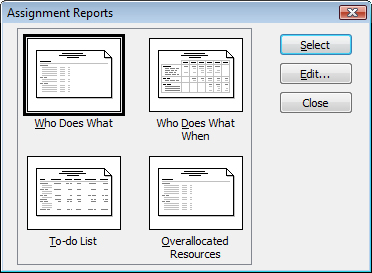
Figure 12-20. The Assignment Reports dialog box lists the reports for resources and their assigned tasks.
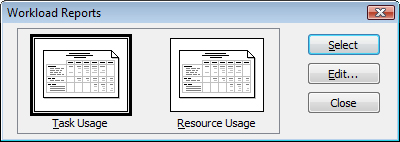
Two additional text reports in the Workload report category show assignment work over time either by task or by resource (see Figure 12-21). These reports are excellent tracking tools for seeing the amount of work per task or per resource, on a weekly basis. Both are crosstab reports, showing a tabular presentation of assigned work by assignment along the left and by week across the top.
Visual reports specializing in assignments and resource usage are found in the Resource Usage, Resource Summary, and Assignment Summary categories.
The Who Does What text report, in the Assignments category, lists the tasks assigned to each resource. It clearly shows the relative number of assignments for all the project resources. This report can also help you or a resource manager plan for coverage when a resource becomes unavailable.
The Who Does What report is based on the Usage table for work resources, and it also shows assignment schedule information.
Note
For more information about making and changing resource assignments, see Chapter 7.
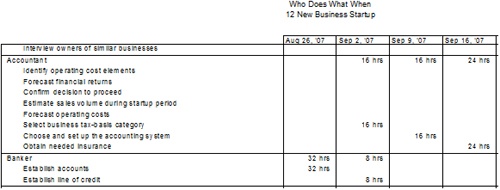
The Who Does What When text report, in the Assignments category, is an amplification of the information given in the Who Does What report, adding the daily breakdown of hours of work assigned. Who Does What When is a crosstab report that shows a tabular presentation of work assigned by resource, by assignment, and by day (see Figure 12-22).
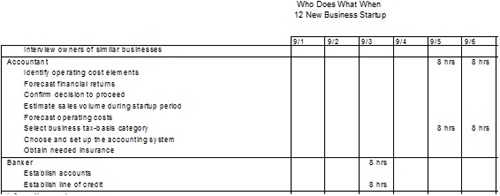
Figure 12-22. The Who Does What When report is a daily accounting of resources and their assigned tasks.
Down the left side, you see a list of all resources with all their assigned tasks. Across the top is each day in the project. All work hours for each of those assignments are listed by resource and by day. Not only does this show you how resources are assigned, but you can also easily see when a resource is assigned to excessive amounts of work on a given day.
Inside Out: Manage the voluminous Who Does What When report
Because it is so detailed, the Who Does What When text report requires a lot of paper to print. Also, generating the data needed to create the report might take some time. Thus, it might be best to use this report less frequently than others or to view it in Print Preview rather than printing it.
You cannot print a date range with this report unless you create a new custom report based on the data this report generates. However, you can easily modify the report to show work amounts by weeks or by months rather than by days. To do this, follow these steps:
Click Report, Reports.
Double-click Assignments.
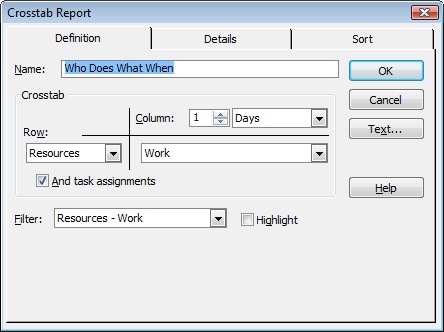
Click Who Does What When and then click Edit.
The Crosstab Report dialog box appears.
Next to Column, change Days to Weeks or Months, for example.
You can also change the number next to Column to indicate that data should be shown for every two weeks, for example.
Click OK.
Double-click the Who Does What When report, and you’ll see that your changes have taken effect.
The changes you made to this report are saved with this project file.
Use the To-Do List to generate a list of tasks to provide to assigned resources. This can be especially useful if you’re not using Project Server and Office Project Web Access to exchange assignment information electronically with your resources.
The To-Do List, a text report in the Assignments category, is based on the Entry table for tasks, with the Using Resource filter applied. It’s grouped by week and sorted by task start date. The To-Do List shows the names of all tasks to which the selected resource is assigned, the task durations, and the start and finish dates.
The Overallocated Resources text report, in the Assignments category, lists only the resources that have been assigned work in excess of their availability, as reflected in their resource calendars. For example, if a resource’s availability is based on the default Standard calendar, the resource will become overallocated when scheduled for more than 8 hours per day or more than 5 days per week.
The list includes every task assigned to a resource, not just the tasks for which the resource is overallocated. Overallocated resources have an overallocated indicator by their name, but the report does not show which specific tasks are actually causing the overallocation. Analyze the task start and finish dates and the amount of work scheduled during those timespans to find the periods of overallocation.
The Overallocated Resources report is based on the Usage table for resources, with the Overallocated Resources filter applied. This report includes the resource’s name and total work hours on the summary level and the resource’s assignment schedule information in a subtable.
Note
For more information about resolving overallocated resources, see the section titled Balancing Resource Workloads in Chapter 9.
The Resource Availability Report is a Visio visual report in the Resource Usage category. It displays a PivotDiagram that shows scheduled work and remaining availability for all project resources, broken down by work, material, and cost resources.
A red flag is displayed next to any work resource that is overallocated.
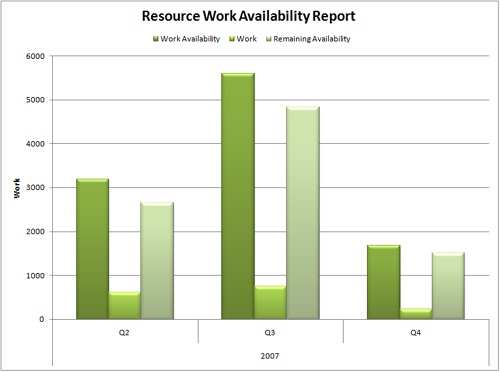
The Resource Work Availability Report is an Excel visual report in the Resource Usage category. It displays a column chart showing total capacity, work, and remaining availability for work resources over time (see Figure 12-23)
The Task Usage text report, in the Workload category, emphasizes assignment hours by task and by week. Under the task names are the assignments, shown as the names of the assigned resources (see Figure 12-24).
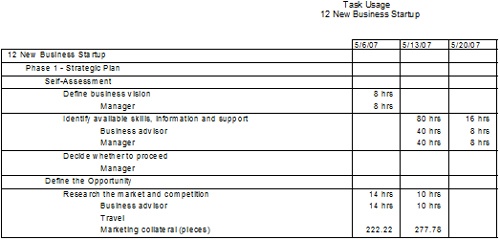
The Task Usage report is very similar to the Task Usage view. Summary tasks are shown so the logical groupings of tasks within the project are easy to follow. Totals are shown for each week and each task. This is a clear way to show the full extent of how work and material resources are assigned to every task.
The Resource Usage text report, in the Workload category, emphasizes assignment hours by resource and by week. Under the resource names are the assignments, shown as the names of the tasks to which the associated resource is assigned.
The Resource Usage report is very similar to the Resource Usage view. For each resource, all assigned tasks are listed along with weekly totals of the hours of work assigned for that task. The report layout is the same as the Task Usage report (see Figure 12-24).
The Resource Work Summary Report is an Excel visual report in the Resource Usage category. It displays a column chart showing total capacity, work, remaining availability, and actual work by work units (days, weeks, months, and so on) for each work resource assigned to tasks in your project.
The Resource Remaining Work Report is an Excel visual report in the Resource Summary category. It displays a column chart showing actual work and remaining work for each work resource by work units (days, weeks, months, and so on).
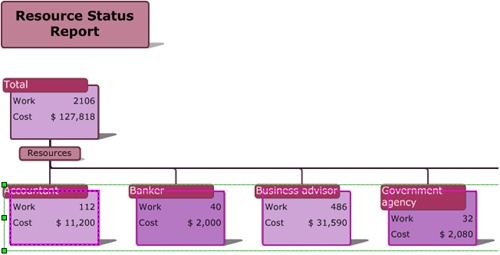
The Resource Status Report is a Visio visual report in the Assignment Summary category. It displays a diagram of the work and cost for each resource in the project (see Figure 12-25). The percentage of work complete is indicated by shading in each of the nodes, with the shading growing darker as the resource nears completion of total assigned work.