
Network packets can be captured through various techniques. Depending on the requirement, a protocol analyzer is placed at a certain place in network with a particular type of configuration.
Hub-based networks are the easiest ones to sniff out because you've the freedom to place the sniffer at any place you want, as hubs broadcast each and every packet to the entire network they are a part of. So, we don't have to worry about the placement. However, hubs have one weakness that can drastically decrease network performance due to the collision of packets. Because hubs do not have any priority-based system for device that send packets, whoever wants to send them can just initiate the connection with the HUB (central device) and start transmitting the packets. Often, more than one devices start sending packets at the same instance. Now, as a result, the collision of the packets will happen, and the sending side will be informed to resend the previous packet. As a consequence, things such as traffic congestion and improper bandwidth utilization can be experienced.
Due to some restrictions present in switched-based infrastructures, packet analysis becomes a bit complex. To bypass these restrictions and make the life of administrators easy, we will talk about a couple of solutions such as port mirroring and hubbing out.
In port mirroring, once you have the command-line configuration console or web-based interface to mage you're the access point (router/switch), then we can easily configure port mirroring.
Let's make it simpler for you with a logical illustration. For instance, let's assume that we have a 24-ports switch and 8 PCs which (PC-1 to PC-8) are connected. We are still left with more than 15 ports. Place your sniffer in any of those free ports and then configure port mirroring, which will copy all the traffic from whatever device we want to the port of our choice, where our protocol analyzer sits, which can see the whole bunch of data traveling through the mirrored port.
Once this is completely configured, we will be able to easily analyze each and every piece of information going back and forth from the mirrored port. This technique is one of the easiest among others to configure; the only thing you should know beforehand is how to configure switches with command-line interfaces. These days, admins are provided with a GUI for configuration purposes if it is the case for you to just go for it. The following figure depicts a simple demonstration of port mirroring:
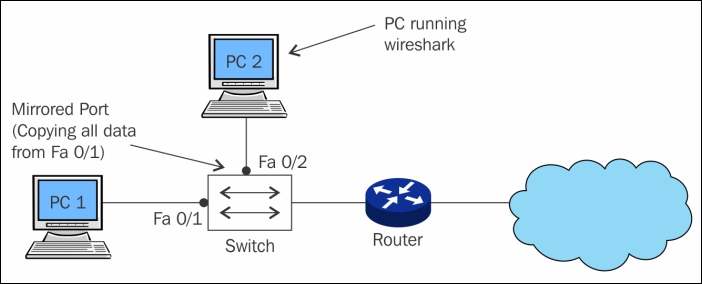
Figure 1.2: Port mirroring
Hubbing out is feasible when your switch doesn't support port mirroring. To use the technique, you have to actually plug the target PC out of the switched network, then plug your hub to the switch, and then connect you analyzer and target device to the switch so that becomes the part of the same network.
Now, the protocol analyzer and the target are part of the same broadcast domain. Your analyzer will easily capture every packet destined to target or originated from the target. But make sure that the target is aware about the data loss that can happen while you try to create hubbing out for analysis. The following figure will make it easier for us to understand the concept precisely:
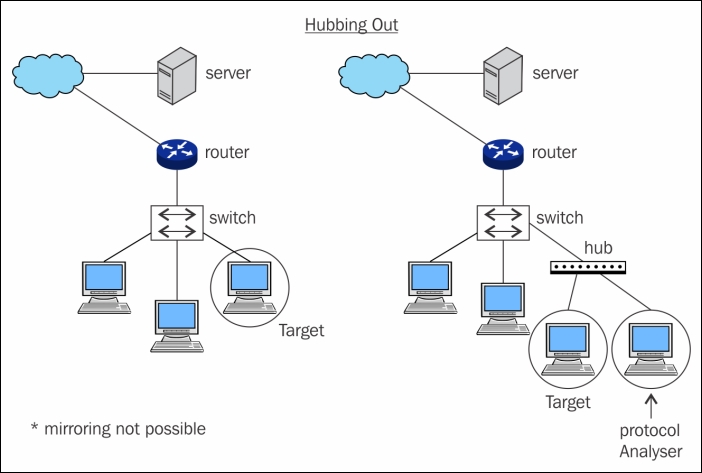
Figure 1.3: Hubbing out
This is an unethical way to capture network traffic where we try to imitate another device between two parties. Let's say, for example, we have our default gateway at 192.168.1.1 and our client is located at 192.168.1.2. Both of these devices must have maintained a local ARP cache that facilitates them to send packets without any extra overhead over the LAN. Now, the question is what kind information does the ARP cache hold, and in which form. Let me tell you, the command to view the ARP cache, which displays MAC addresses associated for a particular IP address is arp -a . Issuing the arp -a command (the same works for most of the platforms) populates a table that holds a device's IP address and its MAC address. Have a look at the following diagram which shows a normal scenario of ARP poisoning:
Before ARP Cache

192.68.1.1 – (Server)
192.68.1.2 – AA:BB:EE
192.68.1.3 – AA:BB:DD

192.68.1.2 – (Client)
192.68.1.1 – AA:BB:CC
192.68.1.3 – AA:BB:DD

192.68.1.3 – (Attacker)
192.68.1.1 – AA:BB:CC
192.68.1.2 – AA:BB:EE
Now that we've understood what is stored inside an ARP cache, let's try to poison it.
After ARP Cache

192.68.1.1 – (Server)
192.68.1.2 – AA:BB:DD
192.68.1.3 – AA:BB:DD

192.68.1.2 – (Client)
192.68.1.1 – AA:BB:DD
192.68.1.3 – AA:BB:DD

192.68.1.3 – (Attacker)
192.68.1.1 – AA:BB:CC
192.68.1.2 – AA:BB:EE
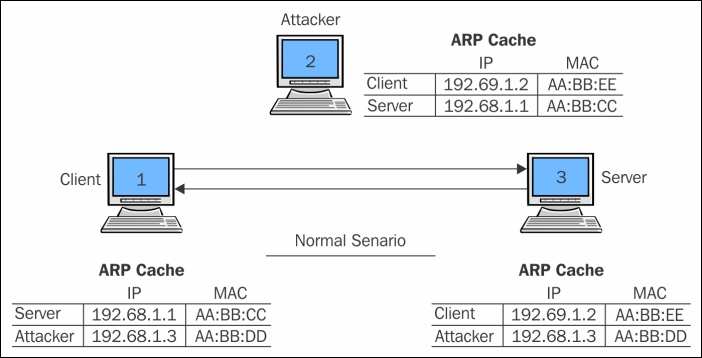
Figure 1.4: ARP poisoning (the normal scenario)
Now that you've understood what is the importance of the ARP protocol and how it works, we can try to poison the arp cache of both the default gateway and the client with the attacker's MAC address. In simple terms, we will replace the client's MAC address in the default gateway's ARP cache with the attacker's MAC address. We will do the same in the client's MAC address, replacing the default gateway's MAC address with the attacker's MAC address. As a result, every packet destined to the client from the default gateway and vice versa will be sent to the attacker's machine.
If port forwarding is already configured on the attacker's side, the received packet will be forwarded to the real intended destination, without giving any hints to the client and the default gateway that the packet is being sniffed.
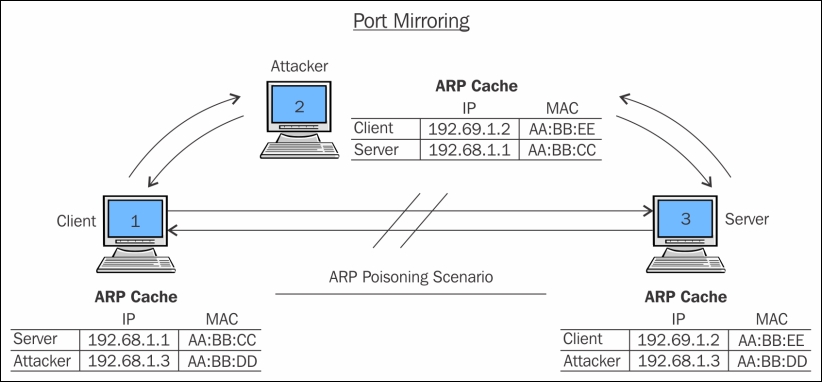
Figure 1.5: ARP poisoning (the poisoned scenario)
Other than these two techniques, there is a variety of hardware available on the market, which are popularly known as taps and can be placed between any two devices to sniff and analyze the traffic. Though this technique is effective to capture network traffic in some scenarios, it should be practised or deployed in a controlled environment because it can prove to be malicious to the internal corporate network.
When dealing with routed environments, the main aspect of packet analyses is to place your sniffer at the right place from where we can gather the required information. Dealing with routed structures demands more skills, as sometimes you need to rethink about the placement of your sniffer. Consider a routed environment with three routers:
Router 1, router 2, and router 3 are working together; each of them owns 2-3 PCs. Router 1 is the acting like a root node while controlling its child networked nodes (router 2 and router 3). Router 3 clients are not able to connect to router 1 clients. To resolve this issue, the admin of the organization has placed the sniffer inside the router 3 area.
After a while, the admin has collected quite a good amount of packets; the admin is still not able to detect the anomaly within the network. So, he/she decides to move the sniffer to another area in the network. After placing the sniffer in the router 1 area, the admin can see quite a useful stream of packets that he/she was looking for earlier. This is quite a simple illustration of moving the sniffer around, which can be helpful in certain situations. The moral is that placing the sniffer in your networked infrastructure is quite an important task.
After reading this, I hope you would now like to see how Wireshark actually looks like, so let's take a look at the GUI of the software and how we have to initialize the process of capturing network packets.
If you do not have Wireshark installed, you can get a free copy from https://www.wireshark.org/download.html. To go through the illustrations in this book, you also need to be familiar with the interface.
I hope I am not the only one who is obsessed with the simplicity of the packet capturing scenario, which Wireshark facilitates for us. I will just quickly point out the reasons why most people prefer Wireshark to other packet sniffers:
- User friendly: It does count for every GUI we have ever seen or worked with, how easily the options are presented, and how convenient it is to use (I guess, even the ones who don't know about packet analysis can start capturing packets in Wireshark without any prior specialized knowledge).
- Robustness: The amount of information Wireshark can handle is outstanding; what I actually mean by this is software of this kind may hang or crash (because of thousands of packets that are captured and displayed every second) when trying to display the packets traveling all over the network. However, Wireshark doesn't—a big hand to Wireshark creators for how well they have structured it.
- Platform independent: Yeah, this one is definitely on the list. This free software can be installed on any platform that is used for computing purposes by administrators these days, whether Linux-based, Windows-based, or Macintosh-based platforms.
- Filters: There are two kinds of filtering options present in Wireshark:
- You choose what to capture (capture filters)
- You choose what to display after you've captured (display filters)
- Cost: Wireshark comes free, and is developed and maintained by a dedicated community. Wireshark offers some paid professional tools also. For more details refer to Wireshark's official website.
- Support: Wireshark is being developed very actively by a group of contributors scattered around the globe . We can sign up to the Wireshark's mailing list or we can get help from the online documentations, which can be accessed through the GUI itself; and various online forums are available to get the most effective; go to Google paid Wireshark support to know more about it.
Before we discuss its awesome features, let me take this opportunity to explain the history of Wireshark and how it came into existence.
Wireshark was built during the late '90s. Combs, a young college graduate from Kansas city developed Ethereal (the basic version of Wireshark), and by the time Combs developed this awesome piece of invention, he had landed himself a job where he signed a formal contract. After a few years of service, Combs decided to quit his job and to pursue his dreams by developing Ethereal further. Unfortunately, as per the legal terms, the Combs invention was part of the company's proprietary software. Despite this, Combs left the job and started working on the new version of Ethereal, which he titled Wireshark. Since 2006, Wireshark has been in active development and is being used worldwide. It supports a majority of protocols (more than 800), which are implemented in the wild today.
Follow these steps to install Wireshark on your system:
- In this book, I am going to you use a Mac PC; for other platforms, the installation is the same. Some OSes, such as Kali Linux, come with a preinstalled version of Wireshark.
- So, if you are using Macintosh, then first and foremost, you need to download X11 Quartz (XQuartz-2.7.7), which will simulate an environment to run Wireshark (for Windows just download the respective executable compatible with your processor).
- Now, you can install Wireshark (Wireshark 1.12.6 Intel 64), which we downloaded earlier in this book.
- Once both of these are successfully installed, we need to restart our computer.
- After the PC has been restarted, start Wireshark. As soon as the packet analyzer opens, you will see that the X11 server starts on its own. You don't need to worry about it; just leave it in the background.
- Once it is opened completely, it will look as shown in the following screenshot:
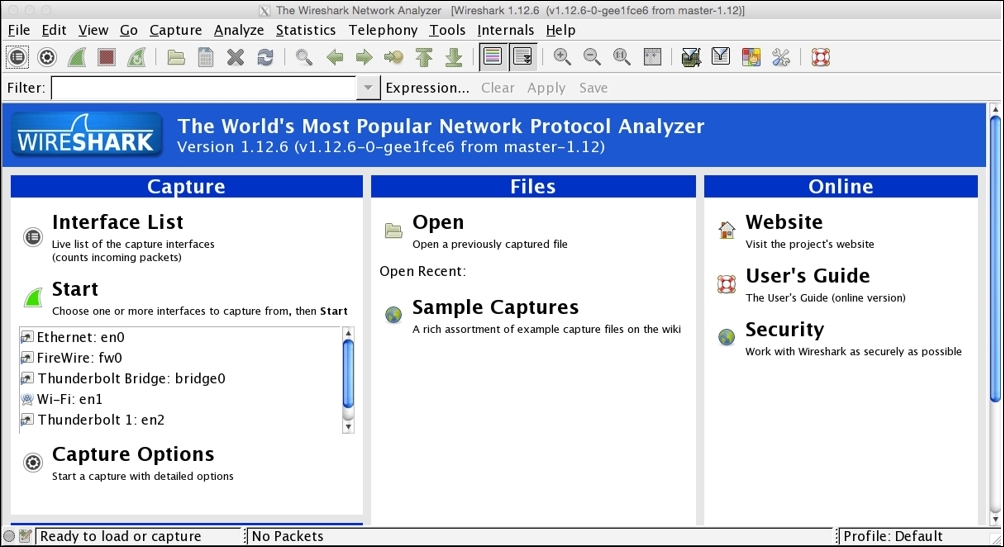
Figure 1.6: The Wireshark screen
Before we go ahead and start the first capture, we need to get a bit familiar with the options and menus available.
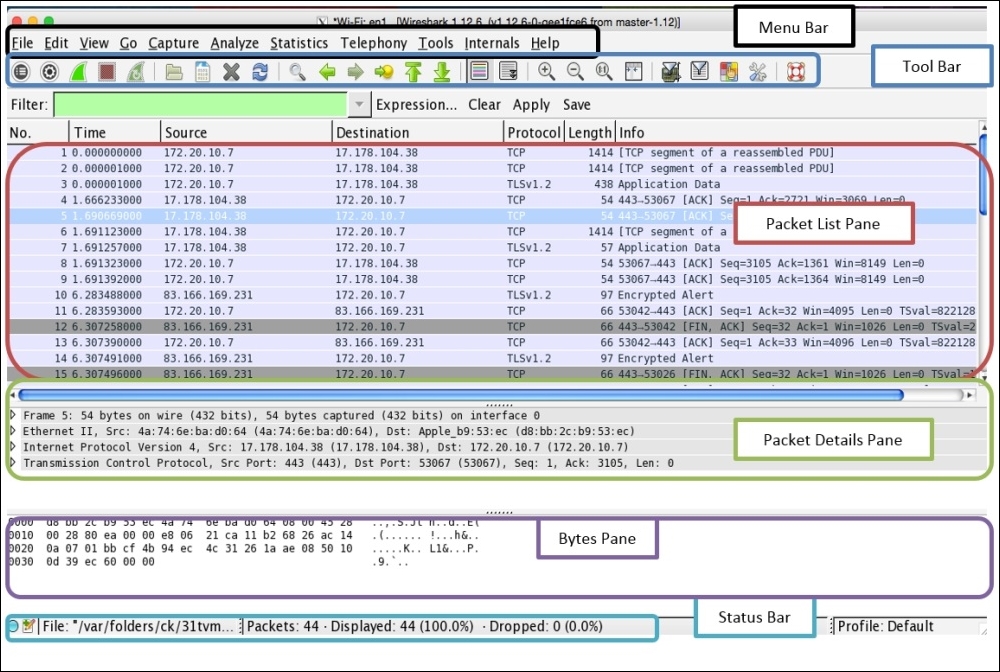
There are six main parts in the Wireshark GUI, which are explained as follows:
- Menu Bar: This represents tools in a generalized form that are organized in the Applications menu.
- Main Tool Bar: This consists of the frequently used tools that can offer efficient utilization of the software.
- Packet List Pane: This window area displays all the various packets getting captured by Wireshark.
- Packet Details Pane: This window gives us details pertaining to the selected packet in the packet list pane are shown. For example, we can view source and destination IP addresses and different protocols used for communication arranged in the bottom-top approach (Link Layer to Application Layer). Information regarding the packets is listed in different categories of protocols that can be expanded to get more details for the selected packet.
- Bytes Pane: This shows the data in the packets in the form of hex bytes and their corresponding ASCII values; it shows the values in the form in which they travel in the wires.
- Status Bar: This displays details such as total packets captured.
The following screenshot will help you to identify different sections in the application, please make sure you get yourself acquainted with all of them before proceeding to further chapters.
Within the toolbar area, we have a few useful tools. I would like to give you a brief overview of some of them:
 : This gives you the option to choose an interface for listening
 : Through this, you can customize the capturing process
 : These are to start/stop/restart the capturing process
 : This is to open a saved capture file
 :This is to save the current capture in a file
 : This is to reload the current capture file
 : This is to close the current capture file
 : This is to go back to the recent most visited packet
 : This icon is to go forward to the most recently visited packet
 : This is used to go to a specific packet number
 : Toggle Color coding for the packets On/Off
 This is used to toggle the autoscroll on/off
 : This is to zoom in, zoom out, and reset zoom to the default
 : This is used to change the color coding as per requirements
 : This is used to narrow down the window in order to capture packets
 : This is used to configure display filters to only see what is required
Even after selecting a working interface, sometimes, you won't be able to see any packets in your packet list pane. There can be multiple reasons for this, some of which are listed as follows:
- You do not have any network traffic
- The packets traveling in the network are not destined to your device
- You do not have the promiscuous mode activated or do not have an option for the promiscuous mode
After launching the Wireshark application, you will see something like the following screenshot on our screens. Although it doesn't look so interesting at first glance, what makes it interesting are the packets that are flowing around. Yeah, I am talking about capturing packets.
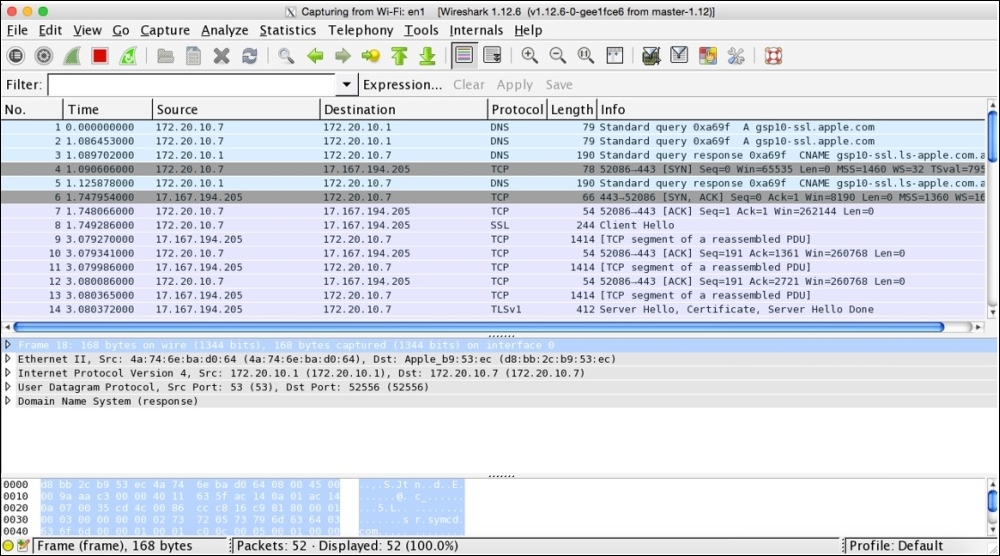
Figure 1.7: The Wireshark capture screen
As you've been introduced to the basics of Wireshark and since you have learned how to install Wireshark, I feel you are ready to initiate your first capture. I will be guiding you through the following series of steps to start/stop/save you first Wireshark capture:
- Open the Wireshark application.
- Choose an interface to listen to.
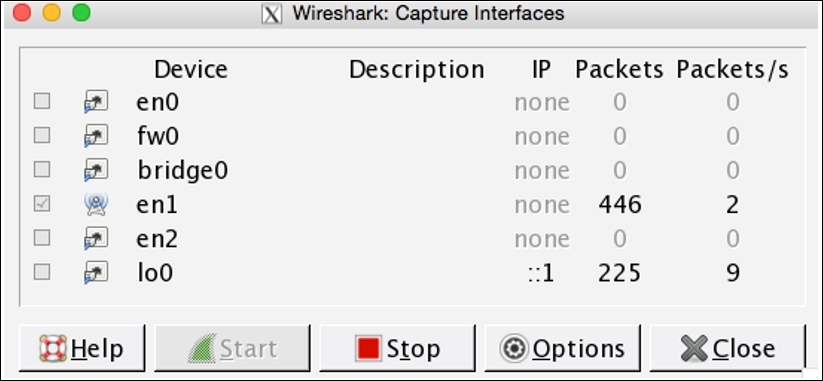
Figure 1.8: The interface window
- Before you click on Start, we have the Options button, which gives us the advantage of customizing the capture process; but as of now, we will be using the default configuration.
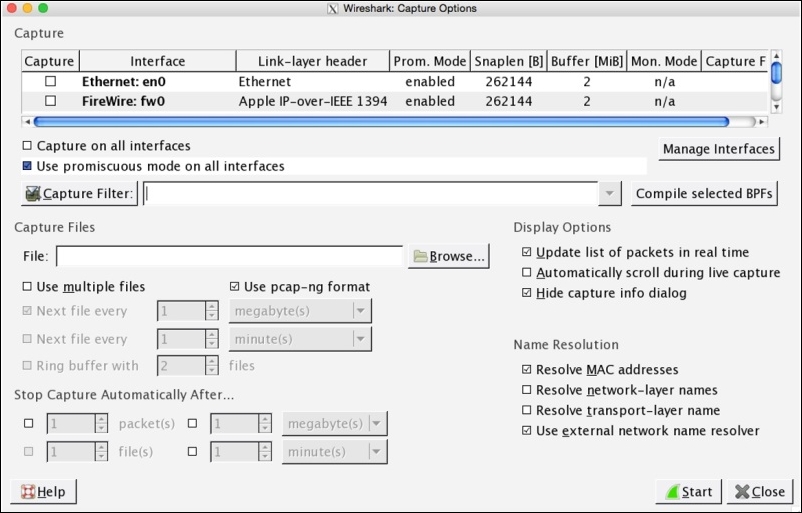
Figure 1.9: The capture customization screen
- Click on the Start button to initiate the capturing process.
- Open your browser.
- Visit any website you want to.
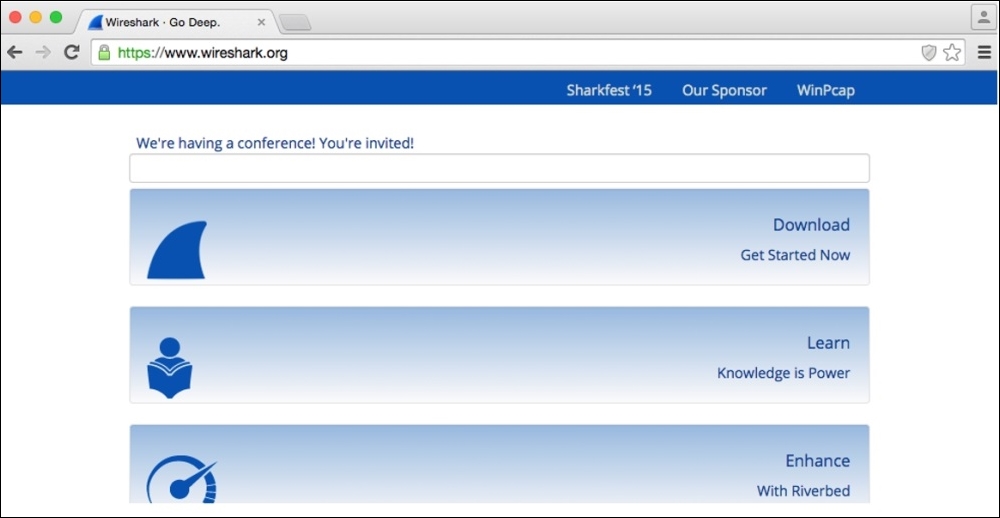
Figure 1.10: The Wireshark website
- Switch back to the Wireshark screen; if everything goes well, you should be able to see a numerous packets getting captured in your Wireshark GUI inside the packet list pane.
To stop the capture, you can just click on the stop capture button in the toolbar area or you can click on Stop under the Capture menu bar.
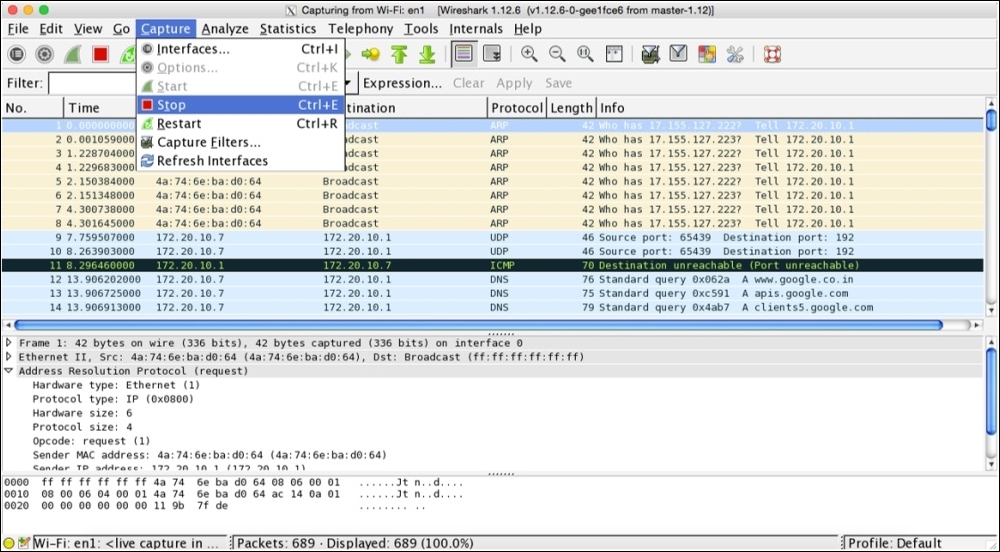
Figure 1.11: Stopping capture
- I know there is an overwhelming amount of information you will see by now, but don't worry about it. I am here to make it simple for you.
- The real process of packet analysis starts when you have captured packets—I mean packet filtering. We will be discussing packet filtering in detail in the upcoming chapters.
- Now, the last step is to save the capture file for later use:
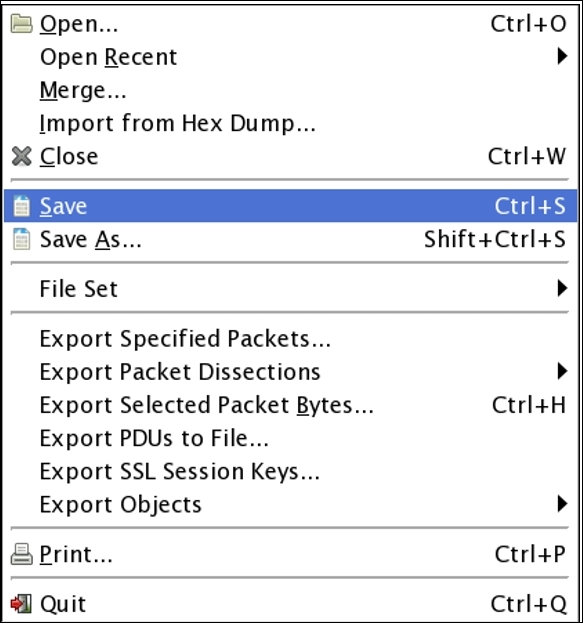
- Save your file with the default
.pcapngextension in you folder.
If you have read all the steps all the way up to this point, I would encourage you to create your first capture file.