
In this chapter, we will look under the hood of the Statistics menu in Wireshark and work with different command-line utilities that come pre-packaged with Wireshark. Here, we will cover the following topics:
- Collecting network stats using Wireshark's Statistics menu
- LabUp—Summary, Protocol Hierarchy, Conversations, and Endpoints
- Mapping overall traffic in graphical form
- LabUp—Graphs
- View network traffic in plain-text form
- LabUp—TCP Streams
- Learn how to view logged anomalies in your trace file
- LabUp—Expert Infos
- Using command-line tools for protocol analysis
- LabUp—CommandLine
- Practice questions
With Wireshark, you can access a variety of statistics about the packets and protocols involved in the communication between two hosts. We can collect basic as well as advanced and specific information about protocols that are involved in the communication process. We will discuss most of the useful tools available in this menu, which can give us a better insight into dealing with day-to-day complex situations.
Statistics in Wireshark are not presented to you just through recorded figures; there are graphical features too, which can present the figures in terms of graphs. Using this, the analysis process becomes easier and much efficient. Multiple types of graphs are available, which we can use to collect valuable information.
Command-line tools are like a samurai's sword, which will enhance the capability of a moderate user to become and act like an advanced user. In this chapter, we will see a couple of inbuilt tools that are command based.
A wide range of tools related to network stats is available in the menu, which facilitate users in gaining information ranging from general info to specific protocol related info in detail.
The general details with respect to the packets captured, filters applied, marked packets, and various other stats can be checked in the Statistics menu. Though this option is just for informational purpose, at times this can be pretty much useful.
To access the summary stats, click on Statistics | Summary; now, you will be able to see a window, as shown in the upcoming screenshot.
The Summary dialog is partitioned into a couple of sections, which are as follows:
- File: General information, such as the name of the file, location of the file, format used, and encapsulation, is listed under this
- Time: This section will tell you the time when the first and the last packets were captured and the time elapsed (total capture duration)
- Capture: This lists the name of the OS along with the version used and the interface used to dump packets from the live network traffic
- Comments: This shows any comments that the user mentioned for reference
- Interface(s): This lists the details of every interface, using which the traffic is captured
- Display: This section gives statistics regarding any display filter that has been used and the percentage of ignored packets after a filter was applied

Figure 3.1: Summary dialog
Just below the Display section, you must see a few columns listing various details, which include a summary in a tabular format that is grouped on the basis of different categories, such as average packet size, total number of packets captured, time elapsed between the first and last packet captured, and so on.

Figure 3.2: Without display filter(screenshot 1)
Let's say, for instance, we have a capture file over which we have applied the display filter http. After this, we can access the Summary option. Take a look at the following screenshot and try to compare them in order to understand the difference a display filter would make in the representation of the packets related summary.
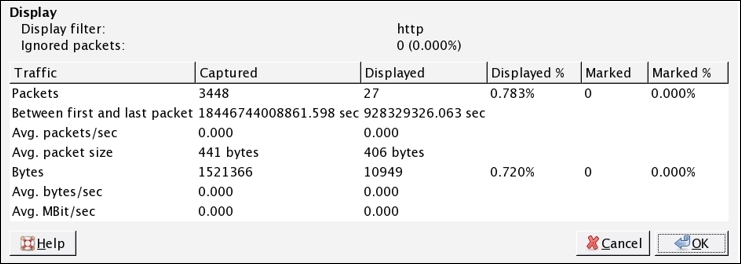
Figure 3.3: With display filter(screenshot 2)
Now, after applying the filter, the variance among the values listed in the stats can be observed. That is, after applying the display filter http, the Displayed% column has a different set of values as compared to the previous one without display filter.
The Protocol Hierarchy window provides us with an overview regarding distribution of protocols used in the communication process and how to spot unusual activities in your network that do not follow the benchmark as expected. By distribution of protocols, I mean in what percentage a certain protocol has been used in the communication between two hosts, and statistics, for example, how many bytes and packets are being sent and received for every protocol, are collected easily. Any form of unusual activity can be easily figured out by matching our current traffic with the baseline created.

Figure 3.4: Protocol Hierarchy window
If you want to check the protocol distribution for a specific host, then before you open the Protocol Hierarchy window, apply a display filter, for example, ip.addr==172.20.10.1. The same filter will be visible at the top of the Hierarchy window just below the title bar. This makes it easy for us to figure out what kind of traffic is actually generated from a certain host, and any malicious traffic from a certain host can be easily figured out.
Refer to the following screenshot:

Figure 3.5: Protocol Hierarchy window after applying display filter
Using the Protocol Hierarchy window, you can create filters too. Just right-click on the protocol you wish to use and then go ahead and specify the expression, as shown in the following screenshot:

There will be situations when a certain host in your network has been breached and you might be observing some unusual traffic associated with a particular host. In such situations, the Protocol Hierarchy window will prove worthy.