 Flow graphs
by Charit Mishra, Yoram Orzach, James H Baxter
Wireshark Revealed: Essential Skills for IT Professionals
Flow graphs
by Charit Mishra, Yoram Orzach, James H Baxter
Wireshark Revealed: Essential Skills for IT Professionals
- Wireshark Revealed: Essential Skills for IT Professionals
- Table of Contents
- Wireshark Revealed: Essential Skills for IT Professionals
- Credits
- Preface
- 1. Module 1
- 1. Getting Acquainted with Wireshark
- 2. Networking for Packet Analysts
- The OSI model – why it matters
- IP networks and subnets
- Switching and routing packets
- WAN links
- Wireless networking
- Summary
- 3. Capturing All the Right Packets
- Picking the best capture point
- Test Access Ports and switch port mirroring
- Capturing interfaces, filters, and options
- Verifying a good capture
- Saving the bulk capture file
- Isolating conversations of interest
- Using the Conversations window
- Wireshark display filters
- Filter Expression Buttons
- Following TCP/UDP/SSL streams
- Marking and ignoring packets
- Saving the filtered traffic
- Summary
- 4. Configuring Wireshark
- 5. Network Protocols
- The OSI and DARPA reference models
- Transport layer protocols
- Application layer protocols
- Summary
- 6. Troubleshooting and Performance Analysis
- Troubleshooting methodology
- Troubleshooting connectivity issues
- Troubleshooting functional issues
- Performance analysis methodology
- Top five reasons for poor application performance
- Summary
- 7. Packet Analysis for Security Tasks
- 8. Command-line and Other Utilities
- 2. Module 2
- 1. Introducing Wireshark
- 2. Using Capture Filters
- 3. Using Display Filters
- 4. Using Basic Statistics Tools
- Introduction
- Using the Summary tool from the Statistics menu
- Using the Protocol Hierarchy tool from the Statistics menu
- Using the Conversations tool from the Statistics menu
- Using the Endpoints tool from the Statistics menu
- Using the HTTP tool from the Statistics menu
- Configuring Flow Graph for viewing TCP flows
- Creating IP-based statistics
- 5. Using Advanced Statistics Tools
- Introduction
- Configuring IO Graphs with filters for measuring network performance issues
- Throughput measurements with IO Graph
- Advanced IO Graph configurations with advanced Y-Axis parameters
- Getting information through TCP stream graphs – the Time-Sequence (Stevens) window
- Getting information through TCP stream graphs – the Time-Sequence (tcp-trace) window
- Getting information through TCP stream graphs – the Throughput Graph window
- Getting information through TCP stream graphs – the Round Trip Time window
- Getting information through TCP stream graphs – the Window Scaling Graph window
- 6. Using the Expert Infos Window
- 7. Ethernet, LAN Switching, and Wireless LAN
- 8. ARP and IP Analysis
- 9. UDP/TCP Analysis
- Introduction
- Configuring TCP and UDP preferences for troubleshooting
- TCP connection problems
- TCP retransmission – where do they come from and why
- Duplicate ACKs and fast retransmissions
- TCP out-of-order packet events
- TCP Zero Window, Window Full, Window Change, and other Window indicators
- TCP resets and why they happen
- 10. HTTP and DNS
- 11. Analyzing Enterprise Applications' Behavior
- Introduction
- Finding out what is running over your network
- Analyzing FTP problems
- Analyzing e-mail traffic and troubleshooting e-mail problems – POP, IMAP, and SMTP
- Analyzing MS-TS and Citrix communications problems
- Analyzing problems in the NetBIOS protocols
- Analyzing database traffic and common problems
- 12. SIP, Multimedia, and IP Telephony
- Introduction
- Using Wireshark's features for telephony and multimedia analysis
- Analyzing SIP connectivity
- Analyzing RTP/RTCP connectivity
- Troubleshooting scenarios for video and surveillance applications
- Troubleshooting scenarios for IPTV applications
- Troubleshooting scenarios for video conferencing applications
- Troubleshooting RTSP
- 13. Troubleshooting Bandwidth and Delay Problems
- 14. Understanding Network Security
- A. Links, Tools, and Reading
- 3. Module 3
- 1. Welcome to the World of Packet Analysis with Wireshark
- 2. Filtering Our Way in Wireshark
- 3. Mastering the Advanced Features of Wireshark
- 4. Inspecting Application Layer Protocols
- 5. Analyzing Transport Layer Protocols
- 6. Analyzing Traffic in Thin Air
- 7. Network Security Analysis
- 8. Troubleshooting
- 9. Introduction to Wireshark v2
- Bibliography
- Index
This is one of the nicest features in Wireshark, where we are assisted with troubleshooting capabilities in scenarios like facing a lot of dropped connections, lost frames, retransmission traffic, and more. Flow graphs let us create a column-based graph, which summarizes the flow of traffic between two endpoints, and it even lets us export the results in a simple text-based format. This is the easiest way of verifying the connection between client and server.
For instance, I have a web server running at 172.16.136.1 and a client running at 172.16.136.129. The client will request the web server for a certain resource. Let's see what the flow graph looks like for such kind of requests. There will be hundreds of packets generated, but we will look only at HTTP packets, just to make the results more confined and understandable. Click on Flow Graph under Statistics, and then from the pop-up dialog, choose Displayed Packet. Click on OK. Refer to the following screenshot that illustrates the same:
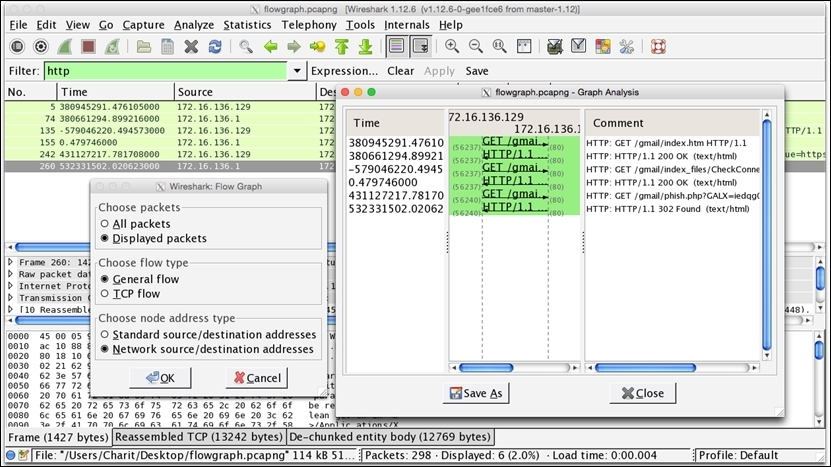
Figure 3.13: Flowgraph
Now, from the Graph Analysis window, we can see at what time a certain request was made and what response did we receive, which TCP port was used, along with some plain English comments, and the flow of traffic is also marked. This makes it simple for us to understand how TCP packets flow around.
-
No Comment