
This chapter will help you understand TCP and UDP protocols, how they communicate, the problems you can face with these protocols, and how you can use Wireshark to assist them. You will also learn how to analyze TCP and UDP protocols and look for any anomalies that may follow. The following are the topics that we will cover in this chapter:
- Understanding the TCP header and how it communicates
- Understanding the TCP analysis flags
- Lab up—TCP
- How to check for different analysis flags in Wireshark
- Understanding UDP traffic
- Lab up—UDP
- Practice questions
We will discuss TCP and UDP protocols using various practical examples that can give you an insight about how low-layer protocol packets communicate and travel in your network in order to transmit data successfully. We will also look at some common anomalies that you might witness in your day-to-day operations.
A TCP is a connection-oriented protocol used by various other application-layer protocols to ensure data delivery without any loss of packets during transition. On the basis of sequence numbers and acknowledgement numbers, a TCP ensures fail-proof delivery of packets between the hosts that intend to communicate. A TCP is supposed to provide an end-to-end, reliable form of communication, which should be robust at all times. It sits in between the network layer and the application layer and uses the IP datagram to transfer data packets between the sender and receiver. Because of this approach, the TCP and IP are used by various application layer protocols for their reliable delivery.
A TCP is like a two-way communication process where not only the sender is involved in the communication, but even the receiver actively works to make it a successful connection. You can imagine it to be like a landline connection, where you dial a number; if the number you dialed is correct, you will hear a ringtone (if the other side is open to communicate). Only when the receiver responds by picking up the receiver, you can start talking. Likewise, in TCP-based communication, a process called three-way handshake takes place between the parties that are involved in the communication to create an independent channel between the two hosts.
The TCP header is normally 20 bytes long, but at times, due to the presence of the options field, the TCP header size can vary up to 60 bytes. Refer to the following illustration of a simplified TCP header:
|
Source port |
Destination port | |
|
Sequence number | ||
|
Acknowledgement number | ||
|
Data offset |
Flags |
Window size |
|
Checksum |
Urgent pointer | |
|
Options | ||
Now, let's get acquainted with the header fields to get a stronger grasp over the basics of a TCP:
- Source port: This is the port number associated with the sender side of the communication or you can say the port responsible for listening on the sender side.
- Destination port: This is the port number associated with the recipient side of the communication or you can say the port responsible for receiving the transmitted packets.
- Sequence number: These are the unique values that are used to ensure reliable delivery of data. TCP tracks each segment using sequence numbers.
- Acknowledgement number: These values are sent in response from the receiver side as part of the confirmation process that the packet was successfully received.
- Data offset: This indicates where the data packet begins and the length of the TCP header. The size can vary due to the presence of the options field.
- Flags: There are various types of flag bits present; each of them has its own significance. They initiate connection, carry data, and tear down connections, and on the basis of their assigned purpose, we've named them as follows:
- SYN (synchronize): These are the packets that are used to initiate a connection that is commonly known as the handshake process.
- ACK (acknowledgement): These packets are used to confirm that the data packets have been received, and this also confirms the initiation and tear down of the connections.
- RST (reset): These packets signify that the connection you were trying to create has been shut down or may be the application we were trying to communicate with is not accepting connections.
- FIN (finish): These packets indicate that the connection is being torn down after the successful delivery of data packets. Both the sender and receiver send the FIN packets to gracefully terminate the connection. If they want to communicate again, they will start from the beginning, that is, from the three-way handshake process.
- PSH (push): These packets indicate that the incoming data should be passed on directly to the application instead of getting buffered. To state this simply, the other host should receive data without waiting for it.
- URG (urgent): Marked packets indicate that the data that the packet is carrying should be processed immediately by the TCP stack and the urgent pointer field should be examined if it is set.
- CWR (congestion window reduced): These packets are used by the sender to inform the receiver that due to the transmit, the buffer is getting overfilled, and because of congestion, both the parties should slow down the transmission process to avoid any packet loss that might happen.
- Window size: This field in the header indicates the amount of data that the sender can send, . The amount is decided during the handshake process where both the hosts that communicate match the buffer size compatible for transmission. Flow control can be achieved through this field.
- Checksum: To cross check the integrity of the data that is being received, this field is used, where the contents of the TCP segments are validated.
- Urgent pointer: This field tells us about the value that the urgent pointer contains. It specifically indicates the sequence number of the octet that lies before the data.
- Options: This field length can vary due to the presence of various options. This field has three parts: the first part specifies the length of the option field, the second part denotes the options being used, and the third actually contains the options in use. One of the important options maximum segment size (MSS) is also part of this field.
- Data: The last part in the TCP header is the real data that travels around.
The preceding information gives us an overview regarding TCP headers and the significance of various parts of the header. While analyzing TCP sessions, it becomes quite important to know about these details.
To understand and analyze the packets in real time, I have configured a server that runs at 172.16.136.129 and a client that runs at 172.16.136.1, as shown in the following figure. Using Wireshark, I will try to illustrate the three-way handshake process, which happens before the actual data transfer as well as the tear down process (graceful termination). The three-way handshake ensures that the server and client are open to making connections and are ready with resources to create a dedicated channel between each other for a reliable delivery of packets.
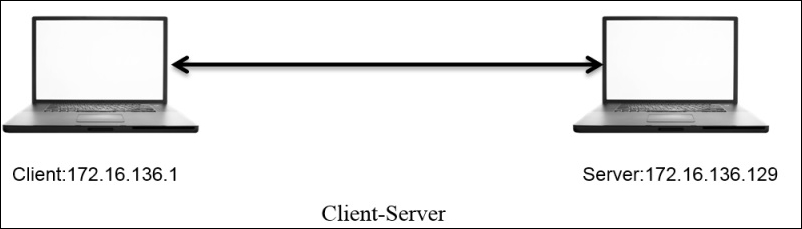
The server runs an HTTP server daemon at port 80. On the client, I will visit the default webpage hosted at http://172.16.136.1 while capturing all the packets taking part in the communication process.

Figure 5.1: Connection Process:Three-way handshake, data transfer and tear down process
In the packets 282, 283, and 284, it is clearly visible that the client and server are trying to create a dedicated channel. The client initiated the creation by sending a SYN packet in the 282 packet with the SEQ set to 0. Since the server was open for communication, the server responded with a SYN/ACK packet with ACK set to 1 and SEQ set to 0. This is followed by a confirmation sent from the client side that is seen in the packet number 284 with SEQ=1 and ACK=1. This is what a three-way handshake process looks like. This can be seen before any real data transfer that happens that follows the TCP approach.
After the successful completion of channel creation, the client sends a GET request to access the contents of the web-root directory. The server acknowledged this in the packet number 287 and sent the requested content to the client's machine with the 200 OK status message, which is acknowledged by the client in the next packet. As seen in the list pane again, the client was requesting a new resource, which the server wasn't able to find and thus sent a 404 Not Found status message, which was acknowledged by the client in the the packet 295.
After all the data transfer takes place, when the client has nothing left to request, or when the server has nothing left to send, the client sends FIN/ACK packets to properly terminate the connection. The server acknowledges this and sends its own FIN/ACK packets, which are acknowledged by the client as well in the packet number 302. This way of termination is often referred to as the teardown process. Take a look at the following screenshot that illustrates this process:

This was a small and sweet conversation that we captured and through which you learned about the process flow. I think I've one more interesting way to illustrate the process flow using graphs that we've already seen in the previous chapters. Refer to the preceding screenshot.
From this flow graph, it becomes more clear and concise to view the requests and responses shared between the two communicating hosts. The most interesting part that I like in the preceding screenshot is the comment section that lists out the SEQ and ACK numbers, which are sent and received by the hosts.
You must be wondering how these are generated and incremented. Let me tell you the trick behind this amazing world of numbers that is used while transferring data. The host that initiates a new connection uses Initial Sequence Numbers (ISN) that are generated by the host's operating system. It can be any random number that has no significance with respect to the data. The sequence number we see in the packet one is zero is actually a relative referencing technique used by Wireshark to ease the numbering system for the sake of users. First of all, you should know that the numbers are used to keep track of how much data is being transferred between the two hosts.
Starting from the packet 1, where SEQ=0 (the relative sequence number in real is 704809601), which is received by the server and in return replies with its own SEQ=0 and ACK=1 for the client's SEQ=0. At the end of this three-way handshake, the client replies with SEQ=1 and ACK=1 without any further increments as no data is being transferred during the process.
Then, by the fourth packet, the client sends a GET request with SEQ=1 and ACK=1 where the data payload length equals 323 (refer to the following figure), which the server receives and acknowledges with SEQ=1 and ACK=324. Did you see what just happened? The server replied by adding a total data payload length into ACK to denote that the data was successfully received. Hence, it sends the requested resource to the client with data payload length equals 451, which in return gets acknowledged by the client with ACK=452 and SEQ=324. In the same way, the transmission goes on until the tear down takes place using FIN/ACK packets at the end.

We saw, in detail, the process of TCP three-way handshake using the captured packets and the flow graph that gave us insight about the process. Similarly, we should be comfortable about the teardown process, which indicates proper termination of a session between two hosts.
Considering the same scenario that we discussed here, let me show you the packets that were generated to terminate the connection in a proper standardized format. Refer to the following screenshot for this:

After the successful delivery of all the required packets, the server initiated the teardown process (as there was nothing left to send or the client was just sitting idle and doing nothing). In the beginning, the server sent its own FIN and ACK packets to the client with SEQ=452 (the client acknowledged the same with ACK) and ACK=324 (this is the client SEQ number when the data transfer was completed). These were acknowledged by the client in the next packet. Following the same approach, the client issued its own FIN and ACK packets (using SEQ and ACK numbers used in the second round of communication, where the client requested something that wasn't available. Refer to the preceding flow graph to know more) to end the connection from its own side (as the connection was bi-directional), which was received and acknowledged by the server. As soon as the client received ACK from the server, the connection between the two hosts was closed completely, and the sockets and other resources involved during the communication were freed up.
Often times, there will be situations when the server daemon is not available, it is not able to process your request due to overload, you are restricted to interact with the server, or the port you are trying to connect to is not open for connections (not associated with any service). There can be a lot of reasons why you will see a RST packet. Let me replicate the scenario and capture the traffic between the client and server I have, which will surely make it easy for you to understand this. An RST packet basically denotes that the connection you were trying to initiate got closed abruptly.
In this scenario, the server daemon is not running and the client is trying to communicate; as a result, it receives RST packets in return for every SYN request sent. I tried visiting the web server just once, but you will notice more than one SYN and RST packets because every browser performs a different number of attempts over a non-responding or a closed socket at a particular interval of time. Hence, in our case, I am using the Apple Safari browser, which made at least three attempts to connect back in a max time of 3-4 minutes. I tried requesting Google Chrome as well, which made approximately 7 attempts to connect back in merely 10 minutes (the browser will continue to make a request at a particular interval of time). Refer to the following screenshot that illustrates the packets captured in the process:
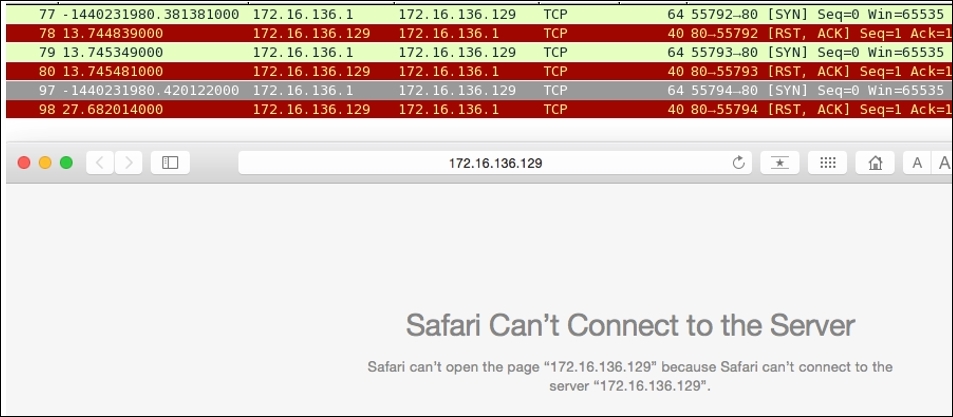
Figure 5.2: RST packets captured
Wireshark purposefully translates real SEQ/ACK flag numbers to a simpler format, which makes it significantly easier for us to keep track of data sent across the wire. For instance, I've a web server at 172.16.136.129 and a client at 172.16.136.1. Using a web browser, I will try to visit the server that will generate a couple of packets, which will be captured by Wireshark. Refer to the following screenshot illustrating the same packets generated for the session.
I have selected the first packet generated for the session in the list pane and its corresponding details in the packet. The details pane and bytes pane can be seen highlighted as follows:
- 1: In the list pane, it can be observed that the
SEQnumber assigned for theSYNpacket to begin communication iszero. - 2: In the details pane, we can see that the number
0is a relative sequence number, which is not the realSEQnumber and has been changed for our perusal by Wireshark. - 3: In the bytes pane, we can see that the corresponding hex value for
SEQ=0is0x2a028a81, which is equivalent to704809601in decimal.
So, the real SEQ number is 704809601, which was converted to 0 to make our analysis easy.

According to our analysis, the ACK value that we must receive should be 704809602 (incremented SEQ value with 1). Let's verify the same using the next packet and its corresponding related information using the details and bytes pane. Refer to the following screenshot for illustration:

Refer to the following list to understand what each pointers highlights:
- The second packet I selected is the
SYN,ACKpacket that the client received from the server. It contains theSEQ=0andACK=1(relative numbers) servers. - The related information for the packet
2in the communication is shown in the details pane and the bytes pane. If you observe, in the details pane, theACKserver sent for the client's request is1. - The hex value for the
ACKreceived is0x2a028a82, which is equivalent to704809602in decimal. This is the same value that we should be expecting.
Now, it would be easy for you to check the absolute numbers translating them from their given hex values. There is one more interesting way by which we can customize the numbering system, where we can view the real absolute numbers directly in the list pane and the details pane. Follow these steps to activate and deactivate it:


As we analyzed, the first packet in the TCP handshake process has an SEQ number 704809601 as an decimal equivalent. Now, after deactivating the Relative sequence numbers options, we can observe the same in the list and details panes.
There are a few more options that are enabled by default in the TCP Protocol Preferences window, which makes the analyses more systematic and advanced. For example, validating the checksum whenever possible and A=analyzing the TCP sequence numbers.
Checksums are generally used during the transmission to ensure the integrity of the data being sent and received. As discussed, there is an extra field in the TCP header. What actually happens is when the sender prepares the packet that needs to be transmitted, the checksum of the packet that contains data is calculated and sent along with the packet. Now, the receiving side will receive the packet and recalculate the checksum using the same algorithm used by the sender. If the checksum value that came along with the packet is identical to the one that the receiver calculated, then the packet is accepted; otherwise, the packet that contains the error (checksum not matched) is discarded and the sender side is not even informed about the error that has taken place. The sender is supposed to know about this by himself. The validation of the checksum is not 100% guaranteed, and even this reduces the performance as TCP packets reassembly won't take place now.
Checksum offloading is a feature that only new network drivers support, where the packets that are ready to be transmitted are passed on to the network hardware that are captured by Wireshark with an empty checksum field that generates the checksum offloading error. The reason is that, even before the actual packet transfer happens, Wireshark captures the packet (the packets will contain the valid checksum once the actual transfer happens). This might lead to several confusion. So, the best approach would be to switch off the offloading feature from your interface if available, or to disable the Validate checksum feature for TCP protocol preferences. Refer to the following figure that illustrates this:

The packets with invalid checksums are displayed with a black background and red foreground color. Look at the error highlighted in red color in the details pane; this states that the checksum is incorrect, and this might be because the checksum-offloading feature is activated. The packets with an invalid checksum cannot be reassembled, and it doesn't look nice (a lot of invalid errors on the screen), so the best option is to deactivate this feature if not required.
Another option that you should know about is the Analyzing TCP sequence numbers feature, which keeps track of the SEQ and ACK numbers and keeps you aware of the various types of errors that can take place during transmission, for example, lost frames, duplicate ACK, retransmissions, window scaling, and several others. Turning this feature off will also affect the Expert Info dialog, where any of the warnings related to transmission errors and other useful information won't be populated.
One of the scenarios that commonly falls under this category is the lost connection or unsuccessful connection attempt scenario, which we have already analyzed in the RST packets section. You might observe several other examples, such as high latencies, due to long-distance communications or queuing up of the traffic. To make the analysis easy and to sort out such problems, use the time column by sorting it, and then, you will be able to figure out large time gaps between the packets at the top of the list pane.
Another example can be where a malicious user is trying to perform a port scan on your network and your firewall responds with RST packets to the user to avoid such attacks, or it might also be possible that the port that the malicious user is looking for is closed. A normal scan can generate a lot of traffic and which is quite noisy. This can be easily observed in the list pane of Wireshark. Refer to the following screenshot where I've tried scanning my machine using nmap from another device, and it seems quite visible and hence is easy to track:

Observe Frame 19, where the port scan initiated by the malicious user sent a SYN packet in order to check whether the port is open or closed. As a result, in our case, port 21 (FTP) was closed; hence our machine sent a RST packet, which will be used by the port scanner on the other side to display statistics. If the port was open, the malicious user will be notified with SYN and ACK (refer to the following screenshot), which signify that our machine is open to a connection over the port 21, and this might become an entry point to the user's malicious attacks.

Figure 5.3: Port 21 open, an entry point for malicious attacks
Take a look at Frame 45, where the client sent a SYN request to the server at 172.16.136.1, and by this time, the port was open so our server sent SYN and ACK packets (Frame 46), acknowledging the connection initiation attempt with a positive confirmation that the server is open to connection over port 21.
There can be various scenarios other than this half-open scan (the scan shown in the preceding screenshot is called half open because the client who initiated the connection attempt, would never complete the connection by sending ACK, which the server will be expecting). If your basics regarding the packet behavior, connection initiation, completion process, TCP headers, flags in packets, and SEQ-ACK numbers are clear, then it would be quite easy for you to point out any unusual form of traffic that is flowing around. There is no such automated tool that can point out these abnormalities until you customize your environment about how to react or alarm you to such traffic anomalies. These are some traffic patterns that you can expect to happen on a regular basis.
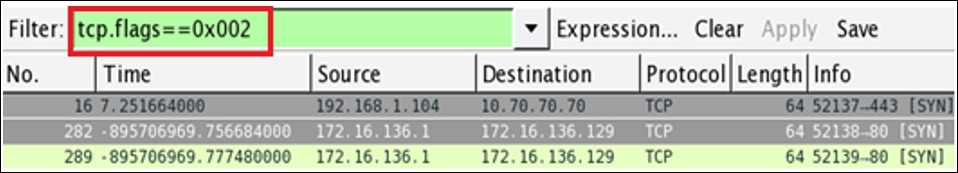
The analysis of the flags present in TCP packets is quite simple while using Wireshark, there is an individual section that is available in the details pane for every TCP packet. Let's take a TCP packet from our previous handshake process that we captured and see how flags are presented in the details pane. Then, we will try to create a display filter corresponding to the same. Refer to the following screenshot that illustrates this:

Now, we will see what each pointer signifies:
- Here, the
SYNpacket sent from the client to the server to initiate the three-way handshake can be seen in the list pane. - Here, the flags related to the same packet are set and the hex equivalent of
000000000010is set to0x002. - For the corresponding TCP packet, the
SYNflag bit is set to 1; the same can be seen in the details pane. The rest of them are still0.
Now, if you wish to create a display filter to see only the SYN packets that you have in the trace file, then apply the filter shown here. As a result, you will see only SYN packets present in your trace file. The following figure illustrates the same:
Let's try to create one more filter to view the SYN and ACK packets only in the list pane. Follow these steps to create the filter: