
This chapter will detail the most important aspect of Splunk, that is, adding data to Splunk. We will go through the newly added feature in Splunk 6.3 of JSON and REST API format of IoT event collections, HTTP Event Collector, and then, we will cover the various interfaces and options to on-board data on Splunk. We will also study how to manage event segmentation and improvise the data input process.
The following topics will be covered in this chapter:
- Deep diving into various input methods and sources
- Adding data to Splunk—new interfaces
- Data processing
- Managing event segmentation
- Improving the data input process
Splunk supports numerous ways to ingest data on its server. Any data generated from a human-readable machine from various sources can be uploaded using data input methods such as files, directories, and TCP/UDP scripts which can be indexed on the Splunk Enterprise server and analytics and insights can be derived from them.
Uploading data on Splunk is one of the most important parts of analytics and visualizations of data. If data is not properly parsed, timestamped, or broken into events, then it can be difficult to analyze and get proper insight on the data. Splunk can be used to analyze and visualize data ranging from various domains, such as IT security, networking, mobile devices, telecom infrastructure, media and entertainment devices, storage devices, and many more. The machine-generated data from different sources can be of different formats and types, and hence, it is very important to parse data in the best format to get the required insight from it.
Splunk supports machine-generated data of various types and structures, and the following screenshot shows the common types of data that comes with an inbuilt support in Splunk Enterprise. The most important point of these sources is that if the data source is from the following list, then the preconfigured settings and configurations already stored in Splunk Enterprise are applied. This helps in getting the data parsed in the best and most suitable formats of events and timestamps to enable faster searching, analytics, and better visualization.
The following screenshot enlists common data sources supported by Splunk Enterprise:
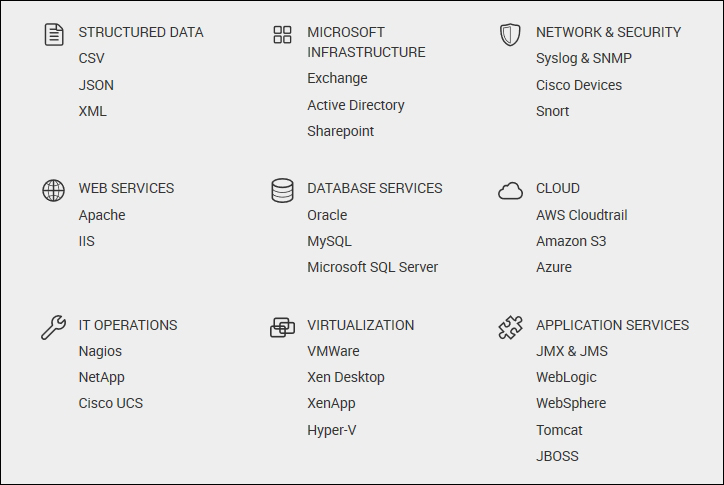
Machine-generated data is generally structured, and in some cases, it can be semistructured. Some of the types of structured data are EXtensible Markup Language (XML), JavaScript Object Notation (JSON), comma-separated values (CSV), tab-separated values (TSV), and pipe-separated values (PSV).
Any format of structured data can be uploaded on Splunk. However, if the data is from any of the preceding formats, then predefined settings and configuration can be applied directly by choosing the respective source type while uploading the data or by configuring it in the inputs.conf file.
The preconfigured settings for any of the preceding structured data is very generic. Many times, it happens that the machine logs are customized structured logs; in that case, additional settings will be required to parse the data.
For example, there are various types of XML. We have listed two types here. In the first type, there is the <note> tag at the start and </note> at the end, and in between, there are parameters and their values. In the second type, there are two levels of hierarchies. XML has the <library> tag along with the <book> tag. Between the <book> and </book> tags, we have parameters and their values.
The first type is as follows:
<note>
<to>Jack</to>
<from>Micheal</from>
<heading>Test XML Format</heading>
<body>This is one of the format of XML!</body>
</note>
The second type is shown in the following code snippet:
<Library>
  <book category="Technical">
    <title lang="en">Splunk Basic</title>
    <author>Jack Thomas</author>
    <year>2007</year>
    <price>520.00</price>
  </book>
  <book category="Story">
    <title lang="en">Jungle Book</title>
    <author>Rudyard Kiplin</author>
    <year>1984</year>
    <price>50.50</price>
  </book>
</Library >
Similarly, there can be many types of customized XML scripts generated by machines. To parse different types of structured data, Splunk Enterprise comes with inbuilt settings and configuration defined for the source it comes from. Let's say, for example, that the data received from a web server's logs are also structured logs and it can be in either a JSON, CSV, or simple text format. So, depending on the specific sources, Splunk tries to make the job of the user easier by providing the best settings and configuration for many common sources of data.
Some of the most common sources of data are data from web servers, databases, operation systems, network security, and various other applications and services.
The most commonly used web servers are Apache and Microsoft IIS. All Linux-based web services are hosted on Apache servers, and all Windows-based web services on IIS. The logs generated from Linux web servers are simple plain text files, whereas the log files of Microsoft IIS can be in a W3C-extended log file format or it can be stored in a database in the ODBC log file format as well.
Cloud services such as Amazon AWS, S3, and Microsoft Azure can be directly connected and configured according to the forwarded data on Splunk Enterprise. The Splunk app store has many technology add-ons that can be used to create data inputs to send data from cloud services to Splunk Enterprise.
So, when uploading log files from web services, such as Apache, Splunk provides a preconfigured source type that parses data in the best format for it to be available for visualization.
Suppose that the user wants to upload Apache error logs on the Splunk server, and then the user chooses apache_error from the Web category of Source type, as shown in the following screenshot:
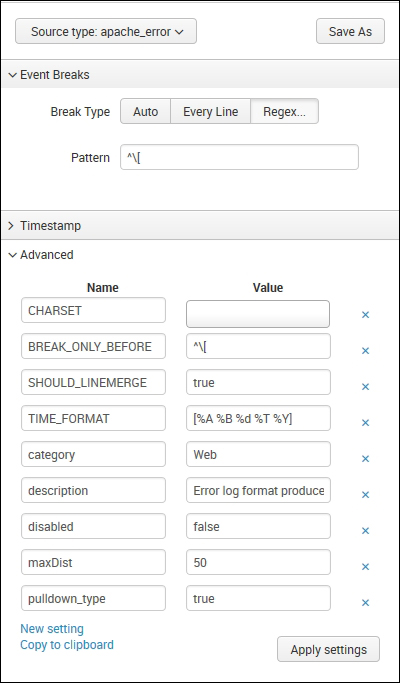
On choosing this option, the following set of configuration is applied on the data to be uploaded:
- The event break is configured to be on the regular expression pattern
^[ - The events in the log files will be broken into a single event on occurrence of
[at every start of a line (^) - The timestamp is to be identified in the
[%A %B %d %T %Y]format, where:%Ais the day of week; for example,Monday%Bis the month; for example,January%dis the day of the month; for example,1%Tis the time that has to be in the%H : %M : %Sformat%Yis the year; for example,2016
- Various other settings such as
maxDistthat allows the amount of variance of logs can vary from the one specified in the source type and other settings such as category, descriptions, and others.
Any new settings required as per our needs can be added using the New Settings option available in the section below Settings. After making the changes, either the settings can be saved as a new source type or the existing source type can be updated with the new settings.
Splunk Enterprise has many applications on the Splunk app store that specifically target IT operations and network security. Splunk is a widely accepted tool for intrusion detection, network and information security, fraud and theft detection, and user behavior analytics and compliance. A Splunk Enterprise application provides inbuilt support for the Cisco Adaptive Security Appliance (ASA) firewall, Cisco SYSLOG, Call Detail Records (CDR) logs, and one of the most popular intrusion detection application, Snort. The Splunk app store has many technology add-ons to get data from various security devices such as firewall, routers, DMZ, and others. The app store also has the Splunk application that shows graphical insights and analytics over the data uploaded from various IT and security devices.
The Splunk Enterprise application has inbuilt support for databases such as MySQL, Oracle Syslog, and IBM DB2. Apart from this, there are technology add-ons on the Splunk app store to fetch data from the Oracle database and the MySQL database. These technology add-ons can be used to fetch, parse, and upload data from the respective database to the Splunk Enterprise server.
There can be various types of data available from one source; let's take MySQL as an example. There can be error log data, query logging data, MySQL server health and status log data, or MySQL data stored in the form of databases and tables. This concludes that there can be a huge variety of data generated from the same source. Hence, Splunk provides support for all types of data generated from a source. We have inbuilt configuration for MySQL error logs, MySQL slow queries, and MySQL database logs that have been already defined for easier input configuration of data generated from respective sources.
The Splunk input source type has inbuilt configuration available for Linux dmesg, syslog, security logs, and various other logs available from the Linux operating system. Apart from the Linux OS, Splunk also provides configuration settings for data input of logs from Windows and iOS systems. It also provides default settings for Log4j-based logging for Java, PHP, and .NET enterprise applications. Splunk also supports lots of other applications' data such as Ruby on Rails, Catalina, WebSphere, and others.
Splunk Enterprise provides predefined configuration for various applications, databases, OSes, and cloud and virtual environments to enrich the respective data with better parsing and breaking into events, thus deriving at better insight from the available data. The applications' sources whose settings are not available in Splunk Enterprise can alternatively have apps or add-ons on the app store.
Splunk Enterprise supports data input through numerous methods. Data can be sent on Splunk via files and directories, TCP, UDP, scripts, or using universal forwarders.
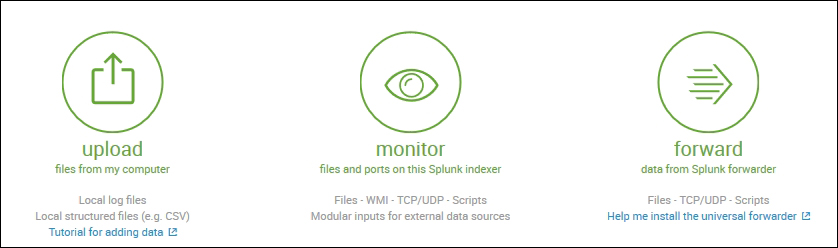
Splunk Enterprise provides an easy interface to the uploaded data via files and directories. Files can be directly uploaded from the Splunk web interface manually or they can be configured to monitor the file for changes in content, and the new data will be uploaded on Splunk whenever it is written in the file. Splunk can also be configured to upload multiple files by either uploading all the files in one shot or the directory can be monitored for any new files, and the data will get indexed on Splunk whenever it arrives in the directory. Any data format from any sources that are in a human-readable format, that is, no propriety tools are needed to read the data, can be uploaded on Splunk.
Splunk Enterprise even supports uploading in a compressed file format such as (.zip and .tar.gz), which has multiple log files in a compressed format.
Splunk supports both TCP and UDP to get data on Splunk from network sources. It can monitor any network port for incoming data and then can index it on Splunk. Generally, in case of data from network sources, it is recommended that you use a Universal forwarder to send data on Splunk, as Universal forwarder buffers the data in case of any issues on the Splunk server to avoid data loss.
Splunk Enterprise provides direct configuration to access data from a Windows system. It supports both local as well as remote collections of various types and sources from a Windows system.
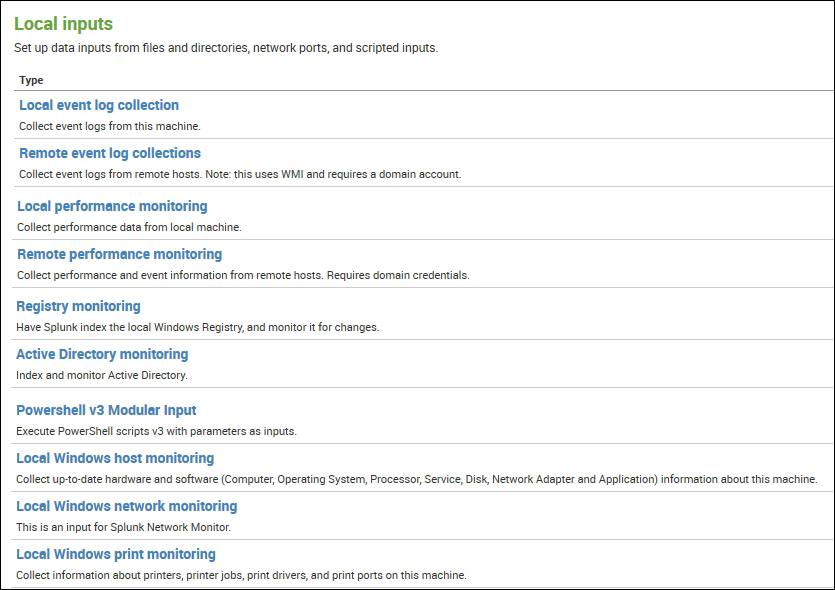
Splunk has predefined input methods and settings to parse event logs, performance monitoring reports, registry information, hosts, networks and print monitoring of a local as well as remote Windows system.
So, data from different sources of different formats can be sent to Splunk using various input methods as per the requirement and suitability of the data and source. New data inputs can also be created using Splunk apps or technology add-ons available on the Splunk app store.