
The Sankey diagram is a special type of visualization that is used to display flow among systems; many-to-many mapping between groups or set of groups; or to visualize energy, material, or cost transfers between processes. In the Sankey diagram, the width of the arrow is directly proportional to the quantity of the flow. Things that are being connected are called nodes and connections are called links. The Sankey diagram visualization is quite widely used to derive quick insights from the dataset. Google uses the Sankey diagram visualization to show the flow of traffic from one page to other pages of a website.
The Sankey diagram can be useful to show information such as:
- Flow of money (money earned and spent)
- Flow of energy from source to destination
- Product manufacturing and sale lifecycle
Let's now learn what information and insights can be generated from the Sankey diagram visualization over the data, and then, we will see how we can implement Sankey diagram in the Splunk dashboard.
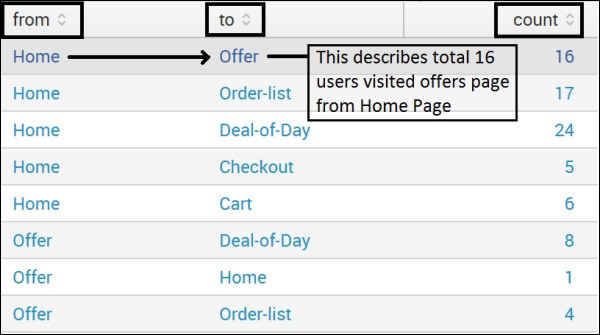
To create a Sankey diagram, it is required to have fields with fieldnames from, to, and count. The following screenshot is a snapshot of test data that is used for the Sankey diagram:
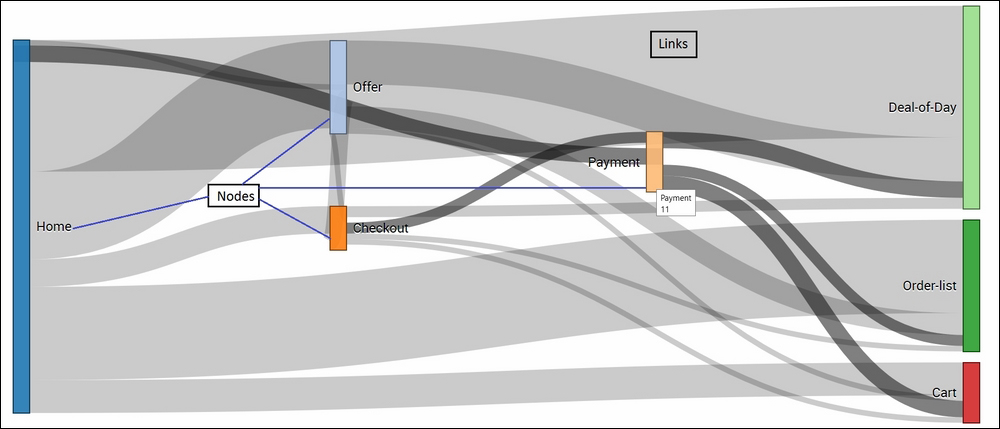
When the preceding data is plotted on the Sankey diagram visualization, it looks like the following screenshot. You can see (with the highlighted markings) that a moderate number of people navigated from the Home page to the Offers page of the e-commerce portal and then moved to the Payment page. Similarly, it can be seen that quite a large number of people navigated from the Home page to the Order list and so on. So, looking at the following Sankey diagram, various inferences can be derived and then an informed decision can be made:
Now, let's see how to implement the Sankey diagram visualization on our dataset on the Splunk dashboard.
Follow the given steps to implement the Sankey diagram.
- We will use the JS (
sankey.js) and CSS (sakey.css) files from theSankeydirectory of the app'sstaticfolder. It is similar to what is already described in theimplementationsection of previous visualizations. There is no need to modify the JS and CSS files until and unless any specific look or functional customization is needed other than what is already provided by default. - Similar to the previous visualization,
autodiscover.jsis added in the XML of the dashboard:<dashboard script="autodiscover.js">
- The following code when added in the dashboard with the respective changes as shown in the screenshot will result in a Sankey diagram, as shown in the example section previously. The search query needs to be replaced with the query that should result in an output having
from,to, andcountfields necessary to draw the Sankey diagram. Thedata-requireparameter should have a proper path of theSankeyfolder containing the JS and CSS files: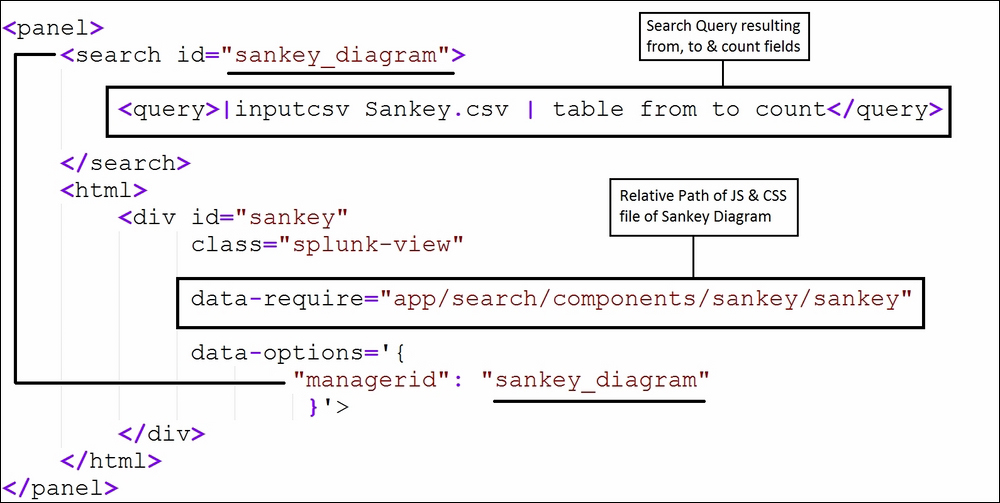
- The Sankey diagram created after following the previous steps allows us to move the nodes to make the visualization clear and understandable in the case of many nodes and links. On hovering the mouse, relevant information becomes visible, and links connected via the respective nodes get highlighted to make it clearer.
- Thus, the Sankey diagram visualization can be used in various scenarios to plot data into a visualization describing the path or intermediate steps between the system in the same way we saw in our example, the user behavior on e-commerce shopping portal.