
We have already learned how to create analytics and visualization over the data on Splunk; now, in this chapter, we will learn to create fully customized, dynamic, and user-interactive dashboards. Splunk provides various customizations by default via Splunk Web console, whereas there are various customizations which can be brought into dashboards via some coding tweaks and using external plugins. In this chapter, we will go through various dashboard customization techniques, which can be implemented to make the most of the data on Splunk. We will learn to make more user-interactive, user-friendly, and user-customizable dashboards in this chapter with examples.
The following are the topics which will be covered in this chapter and explained with the help of examples and code snippets:
- Dashboard controls
- Multi-search management
- Tokens
- Null search swapper
- Switcher
In this section, we will learn about various control options related to display, input, and panel of the Splunk dashboard. We will learn the use of various dashboard controls, with examples, and then we will also learn how to implement the respective controls on Splunk.
We are already aware how to create dashboards on Splunk. The Splunk dashboards are by default in XML format, but Splunk supports the feature to convert the Simple XML dashboard to an HTML dashboard. The features that are not available under Simple XML can be implemented by converting the dashboard to HTML, which is based on the SplunkJS component of Splunk Web framework.
The following are the steps to be followed to convert any simple XML dashboard to an HTML dashboard:
- On any XML dashboard which is to be converted or exported into an HTML dashboard, click on the Edit button.
- From the Edit menu, choose the Convert to HTML option.
- While converting to HTML, two options are available: either to create a new dashboard, which will be the HTML format of the current dashboard with a specified name and description, or to replace the current dashboard with an HTML version.
- Choose the appropriate option and click on Convert dashboard.
The new HTML dashboard is ready to be used on converting a simple XML dashboard into HTML; each of the visualization's layout, definition, and related search queries get separated as follows:
- The layout of Splunk dashboard is converted into Splunk's style, which indicates placement and formatting of items on the page, very similar to Bootstrap's grid system.
- The definition of visualizations or statistical tables is converted into equivalent JavaScript in the HTML dashboard. The converted code for each visualization includes its properties and an auto-generated ID which can later be used to reference the elements of visualization.
- Any search query on an XML dashboard, whether specified for any visualization or for form input, is extracted to be represented in JavaScript. The code for each search includes its properties and an auto-generated ID.
The converted HTML dashboard can be used to implement a custom look and feel by using customized CSS and also custom functionality by using JavaScript. The following are a few high-level customizations, which can be done very efficiently in the HTML dashboard of Splunk:
- Change the layout by creating a highly customized layout of the dashboard panels.
- Implementing customization on pre-existing visualizations on the panels of the dashboard by using custom JavaScript.
- Adding custom behavior on the dashboard panels and visualizations.
Thus, HTML controls and features can be used on the Splunk dashboard by converting the Simple XML dashboard into HTML. Converting the dashboard into HTML helps to remove the limitations of XML and hence customize the dashboard as per requirements.
Splunk provides customization options whereby the header, footer, and edit functionality of the dashboard can be set as per the need. We will learn how we can enable/disable various components of the dashboard as per the user requirement. The following is a sample dashboard with all of its components:
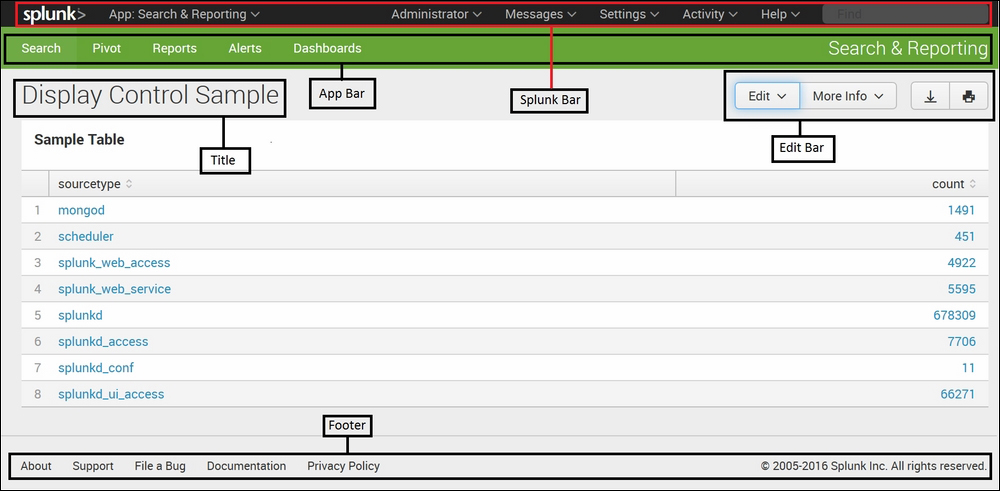
The following are the components of a sample dashboard created in Splunk:
- Splunk bar: This bar is useful for navigating applications, Settings and Activity options, Messages and Notification, along with Splunk administration settings.
- App bar: This bar provides a navigation menu to reach Search, Pivot, Reports, Alerts, and the dashboard of the selected app in the Splunk Bar
- Title bar: The title bar is used to display the name and a short description of Splunk dashboard.
- Edit bar: This bar is useful for editing various components of the Splunk dashboard, like title, description, XML source code, permissions, PDF delivery, and various other editing options.
- Footer: The footer of Splunk dashboard provides navigation link to Support, Documentation, and various Internet links of the Splunk portal.
When industry- and business-standard dashboards are created in Splunk, it may or may not be necessary that all the above components are available for aesthetics, security, and user perspective. Let's say the edit bar can be used to edit the search queries of the dashboard but it may not be required by the user to edit the queries. Thus, for security, the prospective edit bar should not be available for the user. Similarly, it may not be required for the user to be able to navigate to the different apps of Splunk or to access the Settings menu of the Splunk; then, Splunk bar should not be disabled, and so on.
So to consider this kind of requirement, Splunk provides options to control the various components of the Splunk dashboard as per the user's requirements and needs. All the above components can be enabled or disabled by simple tweaks in the XML source code of the Splunk dashboard.
Let us see how we can customize various display components of the Splunk dashboard via XML source code modification.
The following are the parameters/attributes which can be used to customize respective components of the Splunk dashboard in XML source code:
- Splunk bar: To disable/hide the Splunk bar from the Splunk dashboard, use
hideSplunkBar = "true" - App bar: To disable/hide the App bar, use
hideAppBar = "true" - Title bar: The
hideTitle = "true"parameter needs to be set to hide the title and description bar from the Splunk dashboard - Edit bar:
hideEdit = "true"is used to remove the edit bar from the Splunk dashboard - Footer: To disable the footer, we need to use
hideFooter = "true"in the XML source code of the Splunk dashboard - We can also use
hideChrome = "true"to hide the Splunk Bar, App Bar, and Footer, instead of disabling each one of them individually
The following is the syntax for using the above parameters in XML source code:

The preceding parameters/attributes can also be used in the form element of the dashboard as the following syntax:
<form hideSplunkBar="true" hideAppBar="true" hideFooter="true" hideTitle="true" hideEdit="true">
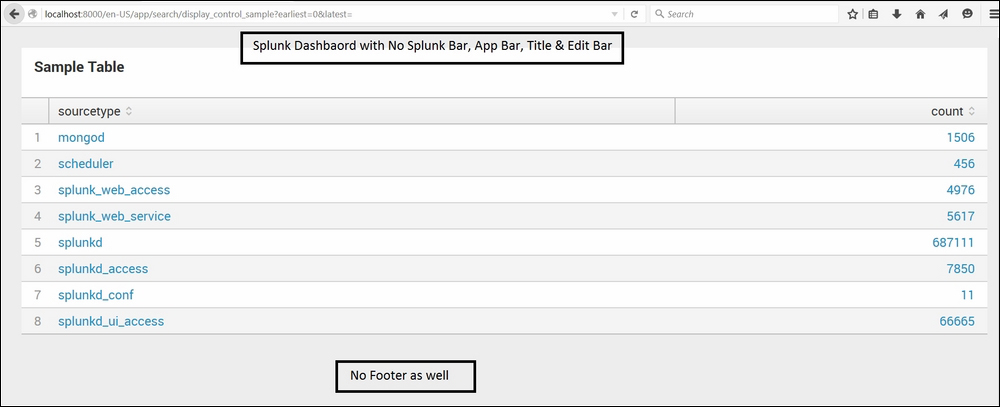
The preceding source code will hide Splunk Bar, App Bar, Footer, Title, and Edit Bar of the Splunk dashboard. The following screenshot shows the result of the preceding modification, namely the dashboard without any display components.
Looking at the following output image, it will be difficult to even judge that the result is a Splunk dashboard. This display component is useful when the user is not interested in having Splunk branding on the dashboard; also, this feature proves to be very useful when integrating such dashboards in any third-party applications:
Splunk also provides features to use and modify display control components via the http get param. This feature can be used to show a dashboard inside a dashboard, and thus, hiding the display components gives the look and feel of a panel rather than a dashboard inside a dashboard.
The iframe feature is used to show the panels of a dashboard inside another dashboard by passing the URL of the other dashboard and passing the respective display components as a parameter in the URL. The following code snippet is an example of a dashboard inside a dashboard in the HTML tag of the XML source code:
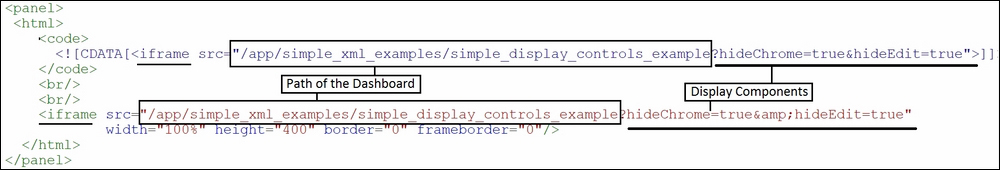
Using the preceding source code and specifying the path of the dashboard in the src parameter, along with displaying component parameters, can also be used to display a dashboard inside a dashboard in Splunk, as per requirements.
In this section of the chapter, we will learn about form input controls, which can be used to customize the behavior of form inputs on the dashboard panel. Input controls can be very useful in a scenario where there is more than one input control to control the behavior as per requirements.
Let us understand the use of form input controls, along with the steps and code snippets to implement them on any Splunk dashboard.
The following are the form input controls that can be implemented on the Splunk dashboard:
- Autorun: This advanced form control customization can be configured to auto-populate the input fields whenever the page loads. For example, in the dashboard, there is a dropdown form input; if autorun is enabled, then on the page load itself, the values of the dropdown will be populated. The XML code to enable autorun for the form input field on the Splunk dashboard is as follows:
<fieldset autorun="True">
- Submit button: The Splunk dashboard can have a Submit button, which when clicked, will update panels with the updated value of the form input controls on the screen. For example, let us suppose that we have more than one input control, so a user selects the required value in all the input controls and then clicks on Submit to get the panels with output as per the value selected from all the input controls of the dashboard. The XML code snippet to enable/disable the Submit button on the dashboard is as follows:
- Enable:
<fieldset submitButton="True"> - Disable:
<fieldset submitButton="False">
- Enable:
- Search on change: This control helps to update the visualizations in the panel of the dashboard as soon as they are changed. There is no need to enable the Submit button in this case, as whenever the input control value is changed automatically, all the panels associated with the form input will get updated. For example, let us say we have a dropdown showing a list of error types and below that we have a visualization showing the details of all error types. Now, if the user selects any one specific error from the dropdown, the panel will get updated with the information associated with the selected error type in the dropdown if Search on Change is enabled. The XML source code to enable Search on Change is as follows:
<input searchWhenChanged="True">
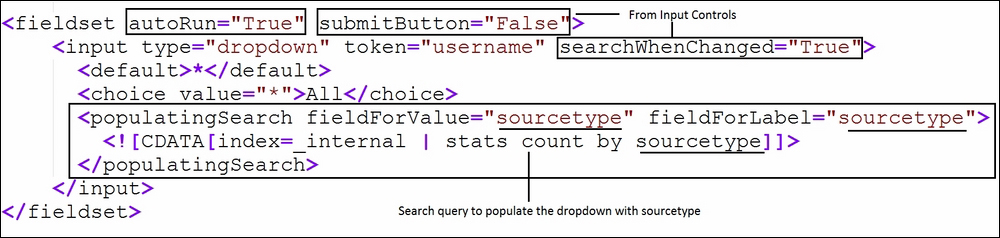
The following is a sample code snippet with all the previously-explained form input controls implemented. We can see from the following image that autorun is enabled and Search on Change is also enabled, and hence the Submit button is set to false.
If Search on Change, is enabled, then the Submit button should be set to false, or else it will conflict in processing and could result in the component not properly working:
Splunk is the Google of log data and Splunk is used for log monitoring, security analytics, and so on. In many or most log monitoring scenarios, Splunk keeps on getting live data, streaming data every second. Splunk supports real-time data analytics and visualizations, so now we will learn about the refresh controls of the Splunk dashboard. Splunk provides options for enabling and disabling of auto-refresh and manual refresh on panels on the Splunk dashboard.
Splunk provides the following controls in the context of refreshing panels in the dashboard:
- Enable/disable refresh time
- Enable/disable manual refresh link
- Enable auto-refresh
Let us understand, with the help of examples and implementation, the uses and differences among all the preceding refresh control options available in Splunk.
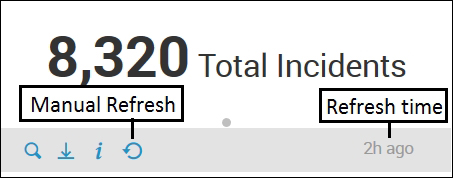
Any visualization or statistical output on any panel of the Splunk dashboard by default has refresh time enabled, namely the panel was last refreshed or the output shown on the panel is older by how much time is shown by default. The following snapshot shows a non-customized single value dashboard panel with Refresh time and a Manual Refresh option:
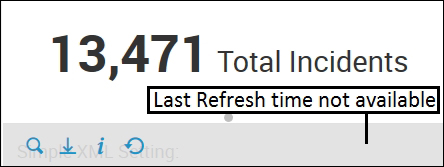
The default refresh time can be disabled by modifying the XML source code of the panel, and once that is disabled, the last refresh time will not be available, as shown in the following image. The default (refresh time enabled) and the following (disabled) image can be compared to see the difference. The placeholder where the last refresh time was available in the preceding image is now empty:
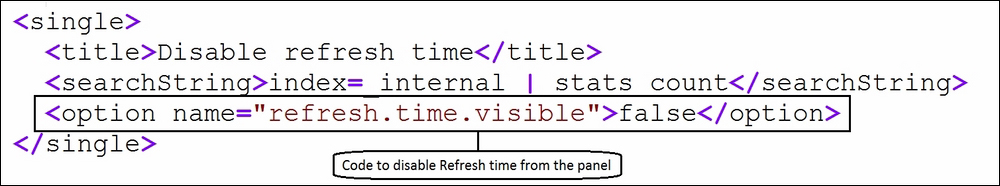
The following code snippet shows an example of a single value in which the refresh time of the panel is disabled:
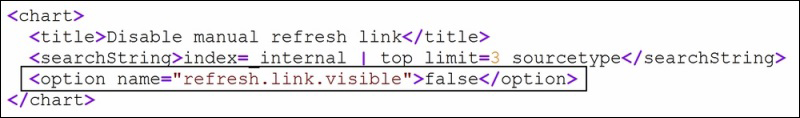
The manual refresh link is by default enabled and can be seen in the preceding example images. The manual refresh link can be disabled from the XML source code and the output will appear as in the following image after disabling the Manual Refresh button. As seen in the following screenshot, the refresh link is not visible, hence manual refresh is disabled:

Now let us have a look at the code snippet for the preceding bar chart example to disable the manual refresh link:
We have seen how to enable/disable the manual refresh link and refresh time visibility on the panel of the Splunk dashboard. Now we will see how we can create a panel which auto refreshes itself after every specified interval of time. The following code snippet refreshes the dashboard panel every specified interval (30 seconds). The interval can be user-defined as per requirements to get real-time analytics on the dashboard:
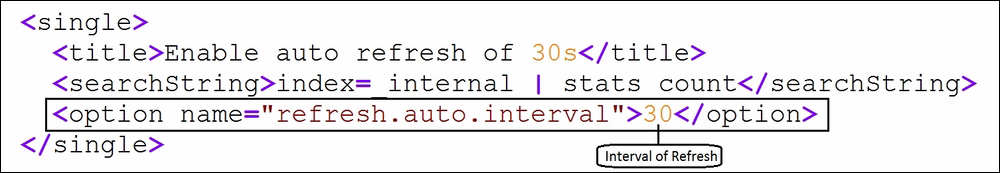
Thus, refresh controls can be used to customize the dashboard with restricting manual searches, enabling auto refresh at given intervals, as required.