Parallel coordinates visualization is a very powerful tool to understand a multidimensional, multivariate numerical dataset. This visualization works best for datasets with a moderate number of dimensions with around a few thousand records. The parallel coordinates visualization is related to time series visualization. Rather, it is applied on data whose axes do not correspond to points in time.
Parallel coordinates visualization is a very versatile and useful technique to find structures in the given dataset. It can be used to quickly find patterns and the strength of correlation in a mid-sized dataset.
Let's now see what data can be plotted with parallel coordinates visualization and the insights derived from it. Then, we will look at implementing it on the Splunk dashboard.
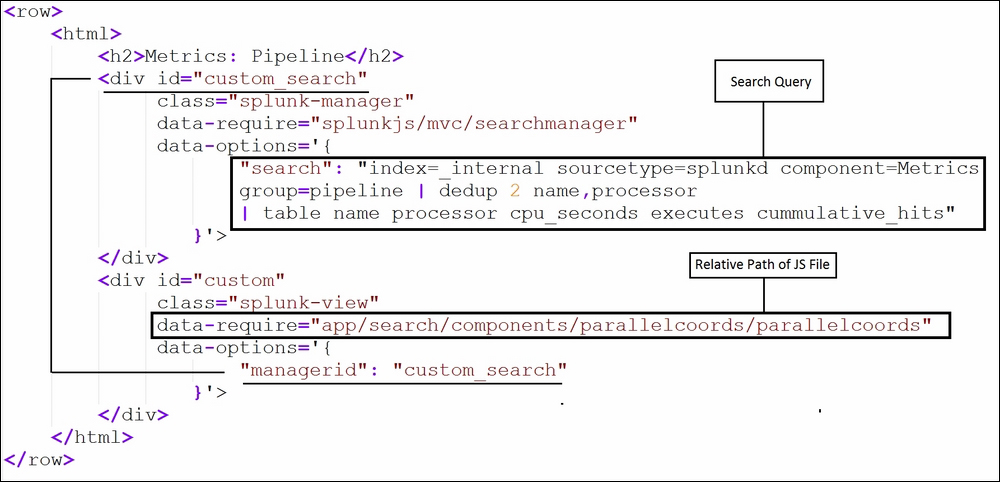
The following search query is used for parallel coordinates visualization:
index=_internal sourcetype=splunkd component=Metrics group=pipeline | dedup 2 name, processor | table name processor cpu_seconds executes cummulative_hits
The preceding search query uses the internal index where Splunk logs its activity by default, and the result of the search query is as follows:
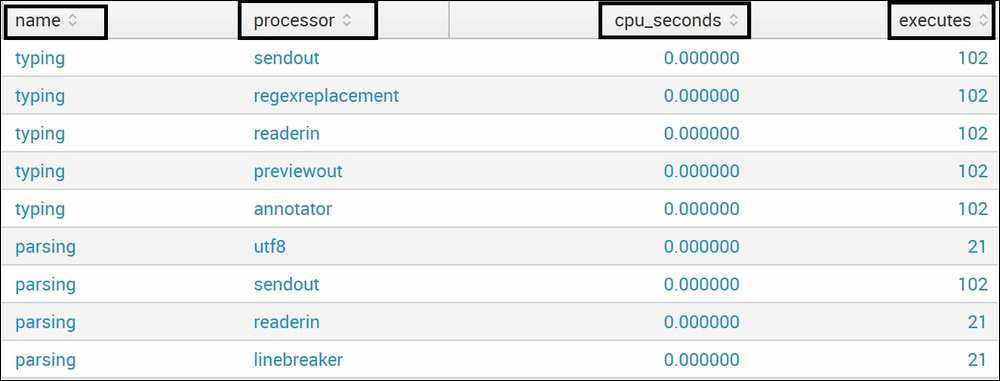
The preceding statistical output can be termed as an informative type of output, as no inference seems to be taken directly by looking at the output. Also, the preceding output is just a subset of the complete result. To derive inference, let's now plot this on the parallel coordinates visualization to understand the data better and in an informative way.
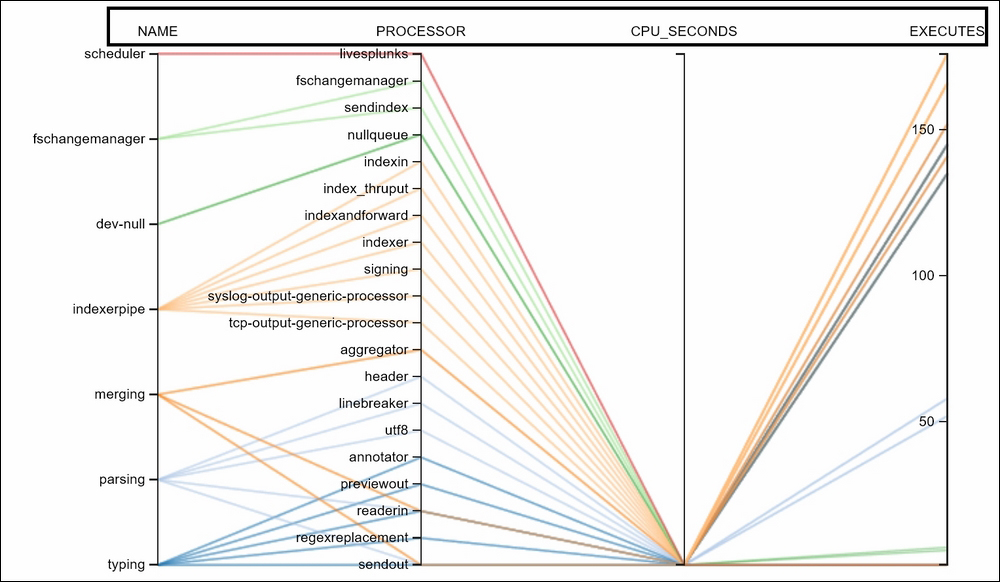
Let's see how the parallel coordinates visualization for the preceding dataset looks. The following image shows four fields (name, processor, cpu_seconds, and executes) and their interrelation with each other using different colors/shade lines. Thus, by looking at the following chart, a quick inference can be made that most/all of the processors are taking less (the same) CPU_SECONDS to execute. Also, we can derive inferences such as indexerpipe is having the highest number of executes (150+) and so on.
Such a kind of inference, and that too very quickly, would have been very difficult if there had been a large number of records to be analyzed in a statistical tabular output. Thus, parallel coordinates can be handy and useful to derive inference and take quick corrective decisions.
Now, since we have seen the dataset and the uses of parallel coordinates, let's see how we can implement parallel coordinates on the Splunk dashboard with users' own dataset.
The following are the steps to be taken for implementation of the parallel coordinates visualization:
- The parallel coordinates visualization also uses D3 extension similar to what we have already seen in other visualizations such as the Sankey diagram, punchcard visualization, calendar heatmap, and so on. Similarly, we will use the JS (
parallelcoords.js) file from theparallelcoordsdirectory of the app'sstaticfolder. The JS file needs to be copied to respective apps directly, similar to what we have already done in previous D3 visualizations. - We can modify the XML of the dashboard to include
autodiscover.jsas follows:<dashboard script="autodiscover.js">
- The following code is to be added in the XML source of the dashboard to make parallel coordinates available on the dashboard. The search query and the relative path needs to be modified per the requirement to make the visualization work in the user dashboard. Since the dashboard may have more than one visualization, the search
idandmanageridshould be properly mapped: