
This chapter will help you understand how to analyze the data and get insight on the data that is uploaded on Splunk from various sources. Right from searching, sending search results over e-mail, combining search results, and accessing the data, you will be able to do basic analytics and data manipulation on Splunk Enterprise via the web console. The reader will also be able to add, extract, and modify fields and format the output as per their requirements. We will use Splunk search commands to fetch the desired the insights and statistics on Splunk Enterprise.
In this chapter, we will cover the following topics:
- Data and indexes
- Search
- Subsearch
- Time
- Fields
- Results
When data is sent on Splunk Enterprise, it consumes the raw data and converts it into searchable events. This processed data gets stored in an index in Splunk. We will now go through the search commands that can be used on Splunk Web to view and manage the data and indexes.
You will now learn to use Splunk commands to analyze the data. There are many Splunk commands, and each command has many parameters. We will go through the important commands and the required parameters.
The following set of commands can be used to access data from indexes. These categories of commands just fetch the information and display it. They do not modify the data or indexes.
Splunk's index command displays the event data of the specified index. On installation, Splunk Enterprise already has the default index as main. It also has few other indexes names, such as _audit, _internal, _introspection, and so on. They can be used for Splunk error lookup, Splunk health status, and Splunk license usages and violations.
The available list of indexes can be seen by navigating to Settings | Indexes from the Splunk Web console. This Indexes page can be used to create, delete, and manage indexes.
The syntax for the index command is as follows:
index = <index_name>
Refer to the following example for better clarity:
index = _internal
index = main
The following screenshot shows the event data for the _internal index:
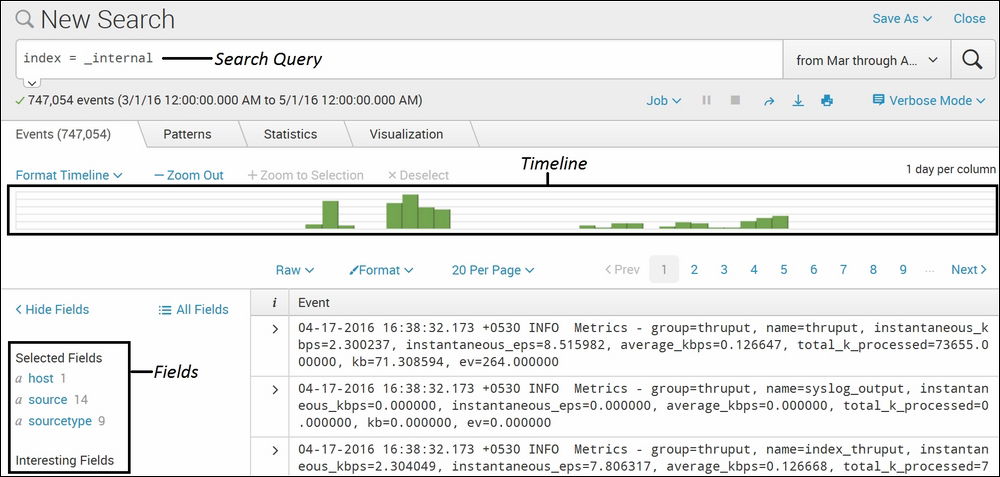
Using the index command along with index_name, you can fetch all the information of a specific index. Using index = _internal will list out the data only of the _internal index. There can be many indexes on which various sources may be forwarding data. Specifying which index to search narrows the search to a specific index only and, thus, gives faster results. The _internal index can be used to debug issues with respect to Splunk. The splunkd.log file is continuously being indexed in _internal index, and thus, any errors and issues can be searched using this index.
If, while searching, the index is not specified, then Splunk searches in the default index, that is, the main index. So, if the data is in any index other than main, it needs to be explicitly specified in Splunk CLI queries to get the desired results.
This Splunk command is used to get the count of the events for the specified index or indexes.
The syntax for the eventcount command is as follows:
| eventcountindex=<string>
    summarize=<bool>
    report_size=<bool>
    list_vix=<bool>
This is the parameter description of the eventcount command:
index: This is the name of the index or indexes whose event count is to be fetched and needs to be specified here.summarize: This accepts the Boolean value which determines whether to summarize events from all the peers and indexes or not.report_size: This accepts the Boolean value which determines whether to display the size of the index or not. The index size is reported in bytes.list_vix: This accepts the Boolean value which determines whether to list virtual indexes or not.
Refer to the following example for better clarity:
| eventcount index=* summarize=false
The following screenshot describes the eventcount command:
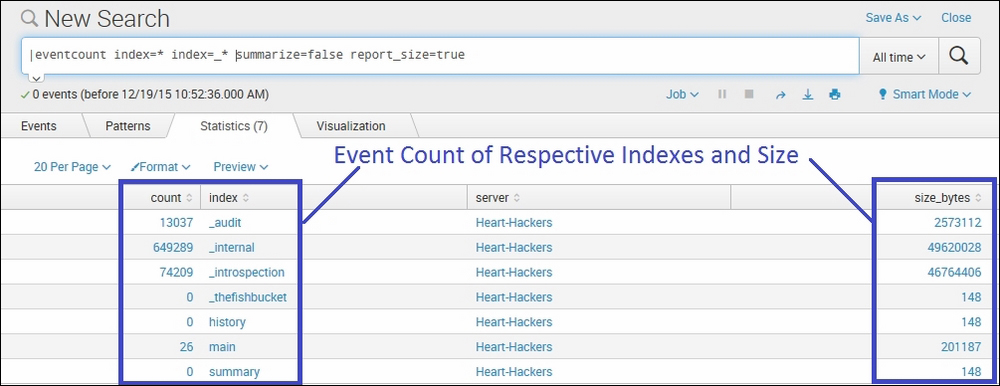
In the preceding example, the eventcount command is used to list the count of events for all the index=* (all indexes default or user created) and index=_* (all internal Splunk indexes created by Splunk Enterprise for auditing and debugging of the Splunk instance) indexes, along with the size of the eventcount (report_size=true). The event count is split by index and search peers by the summarize=false parameter.
Splunk Knowledge Manager generates a hierarchical structured data model from one or more datasets to generate reports for pivot users. The data model has enough information to run specialized searches to create visualization as per user needs.
The syntax for the eventcount command is as follows:
| datamodel
    <data_model_name>
    <object_name>
    <search>
This is the parameter description of the datamodel command:
data_model_name: This specifies the name of the specific model, and the result will be restricted to only the specified modelobject_name: This specifies the name of the object to be searched in the specified data modelSearch: This specifies that Splunk should search for the specified object name and data model
Refer to the following examples of the datamodel command:
- Example 1:
| datamodel internal_server daily_usageThe following screenshot describes the
datamodelcommand: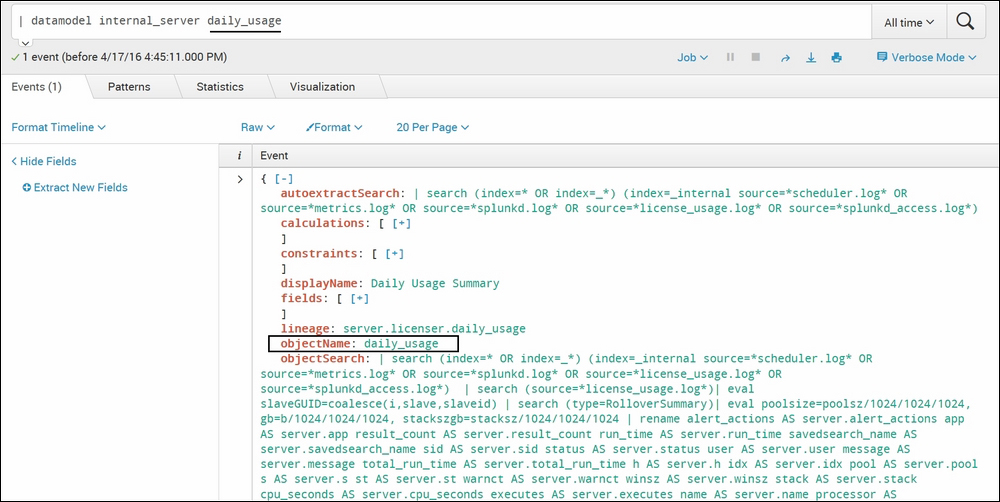
In this example, Splunk will show the data model of the
internal_serverdataset and thedaily_usageobject in the JSON format. Ifdata_model_nameandobject_nameare not specified, then all the data models available on Splunk will be listed. - Example 2:
| datamodelinternal_serverdaily_usage searchThe following screenshot describes the
datamodelcommand usage in the second way: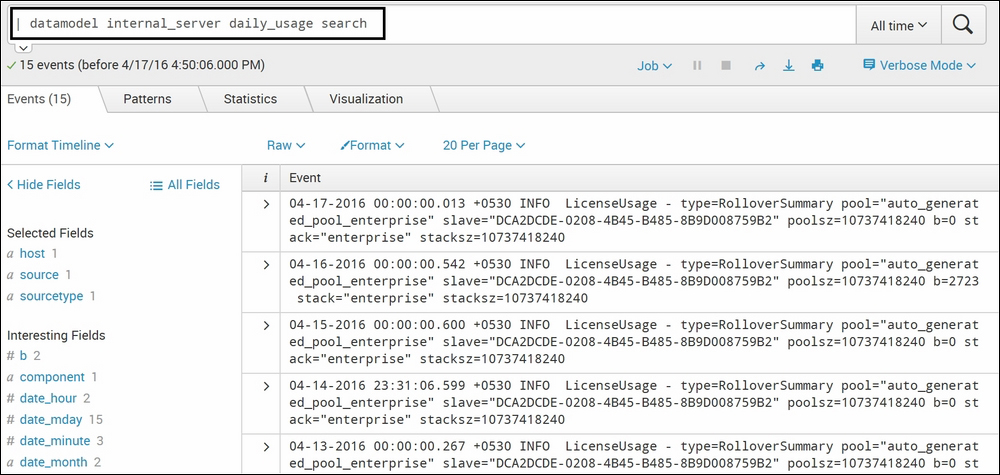
In this example, all the entries of the
internal_serverdata model with thedaily_usageas the object will be searched and displayed. In short, all the entries that satisfy thedaily_usageobject criteria defined during the creation of the data model creation will be searched and displayed.
The Splunk command—dbinspect enlists comprehensive information about the index, such as the bucket ID, event count, path of the database index, state of the index, and so on. This command basically helps users fetch information about the index, thus, the name dbinspect.
The syntax for the dbinspect command is as follows:
| dbinspect
    index=<string>
    span=<timeformat>
This is the parameter description of the dbinspect command:
Refer to the following examples of the dbinspect command:
- Example 1:
| dbinspect index=_*The following screenshot describes the
dbinspectcommand: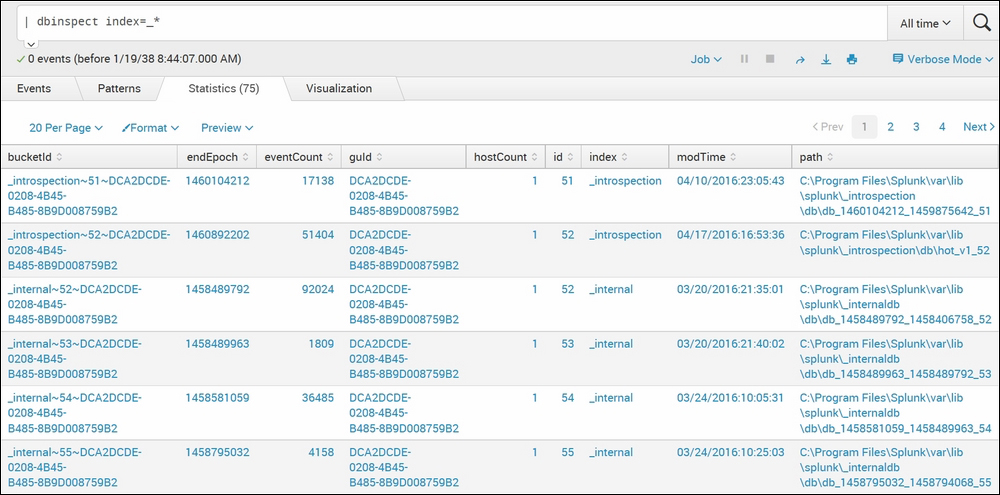
The
dbinspectcommand of Splunk lists our detailed information about the specified index(index=_*). In this case, it provides information about all the internal indexes. If the index is not specified, then the default index data is shown. - Example 2:
| dbinspect index=_*span=1weekThe following screenshot describes the usage
dbinspectcommand with thespanparameter: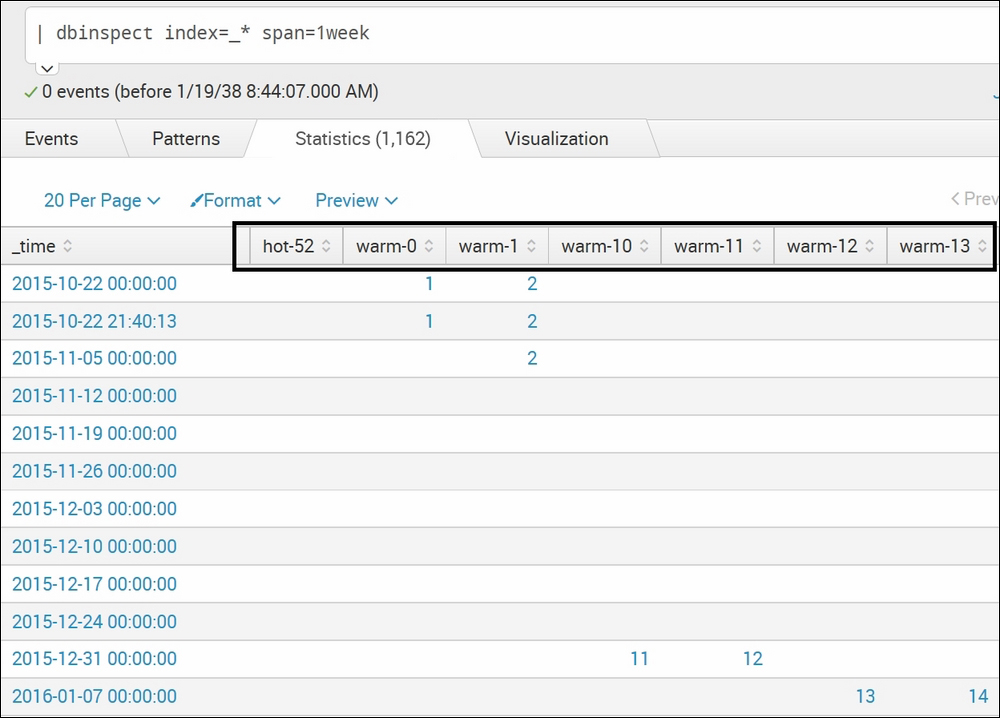
On specifying the span
(span=1week), the output shows bucket information with respect to time for the specified index.
The
crawl Splunk command is used to index files from different sources such as a file system or from network sources as well. The default behavior of crawl can be configured in the crawl.conf file. Splunk also logs the circumstances in which the crawl command is used, which can be referred to track the usage of this command.
The syntax for the crawl command is as follows:
|crawl <file/Network_Path>
    <options>
This is the parameter description of the crawl command:
fileorNetwork_Path: Path of the file system or the network which is to be crawled to index the data to Splunk.options: Any specific settings that are to be overridden from the defaultcrawl.conffile can be specified here. A few examples ofoptionsthat can be configured here areindex,collapse_threshold,big_dir_filecount, and so on.
Refer to the following example for better clarity:
|crawl
The following screenshot describes the crawl command:
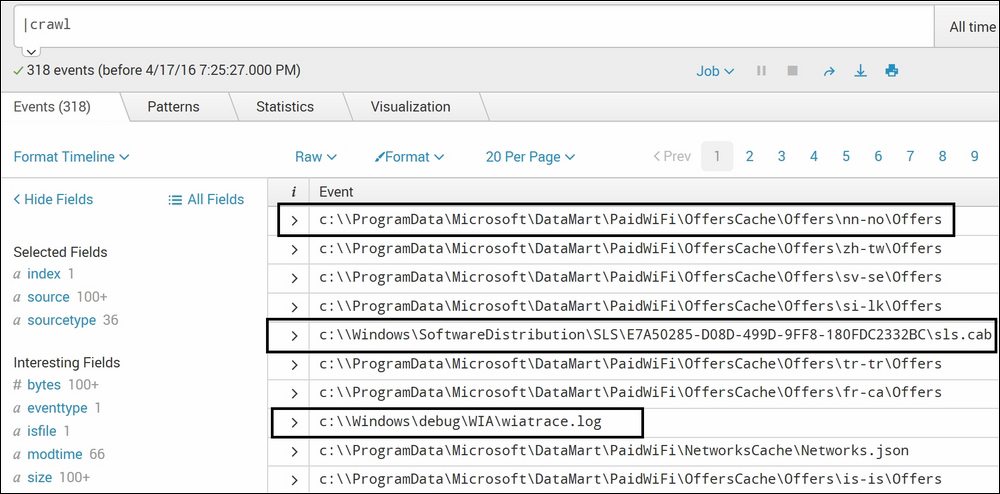
The crawl command of Splunk is used to crawl to all the files and folders in the specified directory or network location. In the preceding example, the file location or network path is not specified. Hence, the crawling will take place at the default path specified in crawl.conf. The default path is specified in crawl.conf is C:.
If crawling is to be done at a location other than the default location, then root=<path> can be specified after the crawl command, as shown here:
|crawl root=d:	emp; #for directory
|crawl host=10.20.8.47 #for network path
All the preceding commands under the Accessing Data section were generating commands, that is, these commands do not alter the data. They just fetch and display the data. Now, you will learn about how to manage the data on indexes.
The input command is used to enable or disable sources from being processed in a Splunk Enterprise index. Any attributes added using the input command will be added to the inputs.conf file. The logs of the input command are available in the inputs.log file.
The input command is generally used along with the crawl command to add sources obtained from the crawl command in the inputs.conf file.
The syntax for the input command is as follows:
input add/remove
    sourcetype=string
    index=string
    string_name=string
The parameter description of the input command is as follows:
add/remove: whether the input is to be added or to be removedsourcetype: specifies the source type in which the data is to be addedindex: specifies the index in which the data is to be addedstring_name: custom user fields that need to be added
Refer to the following code of the input command:
| crawl | input add sourcetype=CrawlTest index=CrawlIndex
The following screenshot describes the input command:
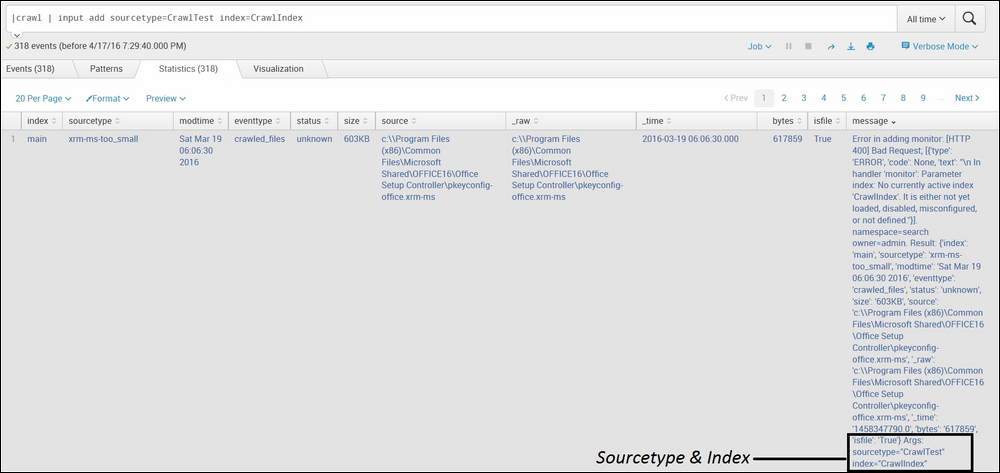
In the preceding example, the input command is used along with the crawl command to add as an input with the source type as CrawlTest and the index as CrawlIndex. If the index and source type are not specified, then the data will be added in the default index, and automatic source type will be classified by Splunk Enterprise, depending on the type of data.
The delete command of Splunk is an irreversible command used to make events irretrievable from the indexes. This command marks the event as deleted. Hence, the deleted events will not be returned in any search result even by the user with admin privileges.
Using the delete command will not free up any space on the disk, and if the deleted data is required, then it has to be reindexed from the original source. This command cannot be used for real-time search.
The syntax for the delete command is as follows:
delete
Refer to the following example for better clarity:
sourcetype="crt-too_small" Address | delete
The following screenshot describes the delete command:
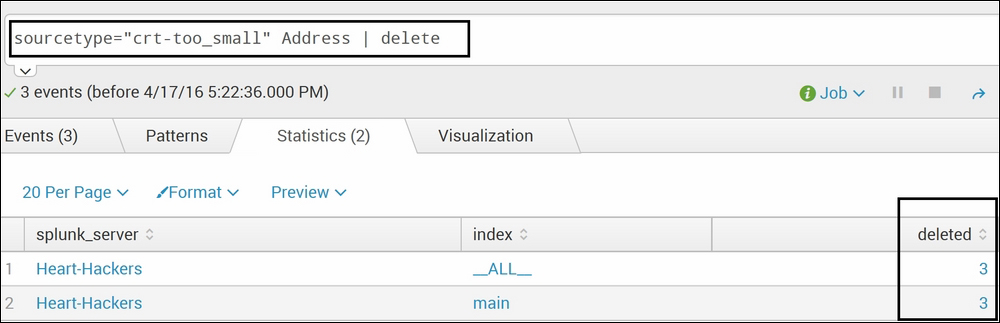
In the preceding example, all the events that had Address in the crt-too_small source type will be deleted and will be inaccessible from the Splunk index. If the address is not mentioned as in the preceding example, then all the events under the crt-too_small source type will be deleted.
The
clean command is used to delete all the events of the specified index. Generally, this command is used when using the trial-and-error method to choose the best source type and event-breaking configuration while defining new source types to empty the index. This command makes an irreversible change in the index, and the data removed can be brought back in Splunk only by reindexing it.
The syntax for the clean command is as follows:
splunk clean eventdata
   -index <index_name>
The Index_name parameter of the clean command specifies the name of index that is to be cleaned.
Following is an example of the clean command:
splunk clean eventdata -index TestIndex
The screenshot that follows shows the execution of a clean command instance:
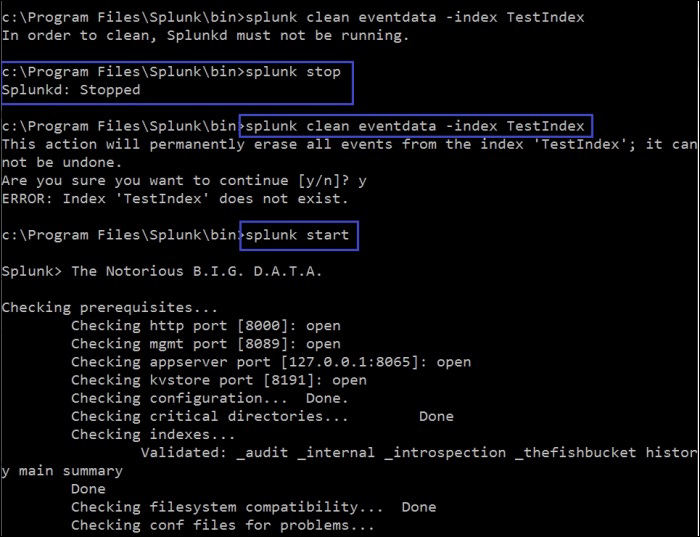
To run this command, the Splunk instance needs to be stopped first. The Splunk instance can be stopped by running the splunk stop command from the Command prompt. Once the Splunk instance is stopped, then the splunk clean eventdata -index TestIndex command cleans the TestIndex. If just the splunk clean eventdata command is run, then the event data of all the events are cleaned. After the index is clean, Splunk can be restarted using the splunk start command.
Summary indexing is used to speed up searches that do not qualify for report acceleration. Using summary indexing commands such as sichart (the summary index version of the chart command), sitimechart (the summary index version of the timechart command), sistats (the summary index version of the stats command), sitop (the summary index version of the top command), and sirare (the summary index version of the rare command), you can compute the relevant information required to later run the non-summary indexing version of the respective commands on the summary index. The summary index is created by the collect command.
The syntax for performing a summary indexing operation is as follows:
|collect index=<index_name>
         File=<file_name>
         Host=<host_name>
         Source=<source_name>
         Sourcetype=<sourcetype_name>
The parameter description of the above summary indexing instance is as follows:
index_name: Name of the summary index in which the events are to copied. The specified index name should be created before running this command.File_name: Name of the file can be specified where the summary index data will be written.Host_name: Host name can be configured using this parameter for the summary index.Source_name: Source can be specified for the summary index data.Sourcetype_name: Source type can be configured using this parameter for the created summary index.
Following this is an example of a summary indexing operation:
index=_internal error | collect index=TestIndex
The following screenshot describes a summary indexing operation performing the collect action:
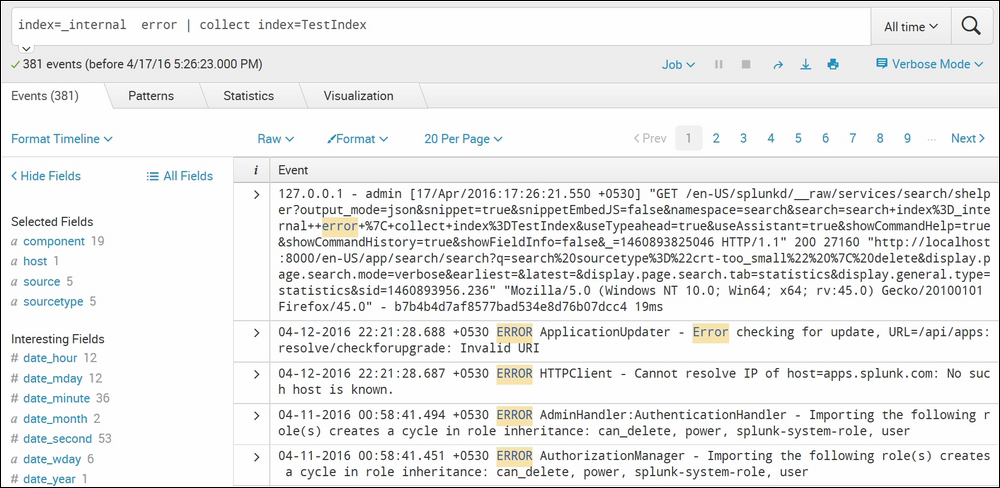
The preceding search query will export all the events of the _internal index that has error to index entries named TestIndex. Similarly, the collect command can be used to create summary indexes for the hourly error statistics based on the host value using the following search query:
index=_internal |search error _time span=1h | stats count by host _time | collect index=TestIndex
Also, the sichart command can be used to compute the necessary information to later do a chart sum(field_name) by _time operation on the summary indexed results:
| sichart sum(field_name) by _time
Similarly, sistats and sitop can be used to create computation for respective commands on summary indexes:
|sistats count(field_name) by _time
sourcetype="android_data" | sitop android_version
Thus, using different summary indexing commands, searches can be accelerated, and long-running search results can be obtained faster.