
In this section, you will learn how to use custom CSS and JS to customize the look and feel of Splunk dashboards. In the previous topics and chapter, we used CSS and JS to customize the functionality of the dashboard. In this section, we will modify the look and feel (aesthetics) of the Splunk dashboard.
The Splunk dashboard has its predefined stylesheets, which are automatically applied on any new dashboards created in Splunk. You will now learn how to override the default stylesheet behavior with your own custom CSS file.
The following steps are required to use custom CSS file on any dashboard XML page:
- Create a CSS file (say,
layout.css) at$SPLUNK_HOME$etcappsapp_nameappserverstatic. - Go to the Splunk Web Console | Dashboard | Edit Source (for which the custom layout is to be applied).
- Direct the dashboard to use custom CSS file by modifying the XML code as follows:
<dashboard stylesheet="layout.css">
If the dashboard has a
formtag, then modify it as follows:<form stylesheet="layout.css">
- Now, whenever the dashboard is loaded apart from the default style, it will also load the style as defined in the custom (
layout.css) stylesheet. - Since
layout.cssdoes not have a definition of any custom modification, the dashboard loads as it is. Now, we will see how to customize different elements of the dashboard using this custom stylesheet:- Changing the color of the panel background: Add the following code in
layout.cssand replace the color as per your requirement, and there, you have the panel color background of your choice:.dashboard-panel,.dashboard-cell { background: #D52121 !important; }The preceding code snippet will change the dashboard panel background to red
(D52121). The!importantvalue is required to override Splunk's default style with the one we specified. The following screenshot shows a panel that has no results to display and is customized by the preceding CSS code: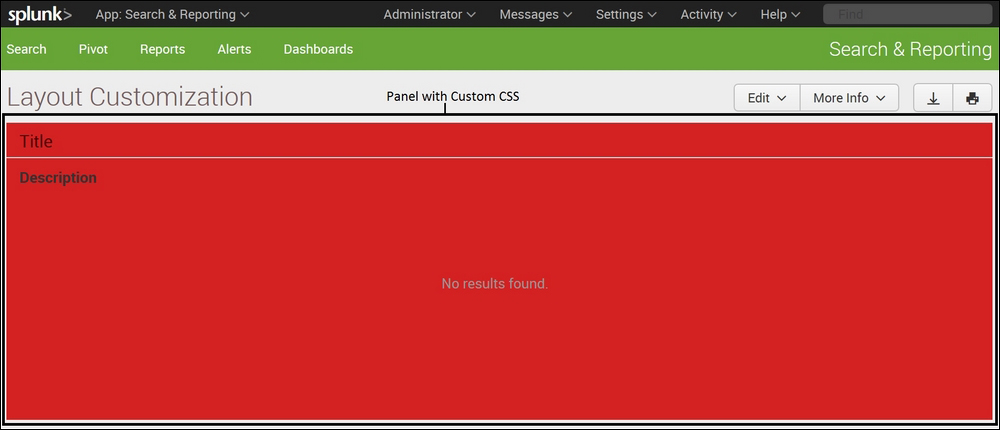
- Change the color of Title, Header, and Description of the panel, as follows:
.dashboard-row {
  color: #4D0303;
}
.panel-head h3,.dashboard-header h2, p.description {
  color: #745B5B;
}
Depending on what element of the dashboard is to be customized, the respective CSS element is modified in this custom CSS.
- Changing the color of the panel background: Add the following code in
The important issue that arises here is how to know which stylesheet is applied and to which segment of the dashboard so as to be able to modify any segment of the dashboard. Let's understand this with the help of an example figure:

The preceding example figure is a sample dashboard highlighting the different elements of it. All the elements seen on the dashboard can be formatted as per our requirement, that is, color, font, size, and so on.
So, to change any specific element as required, how can we identify what CSS needs to be added in the preceding custom layout.css file? The browser's debugging functionality is generally accessible by pressing the F12 button.
Let me explain how to identify the corresponding CSS file and modify it as per the requirement. The debugging console is available by pressing the F12 button in most of the browsers, such as Mozilla Firefox, Google Chrome, and Internet Explorer.
Suppose we are interested in changing the aesthetics of the title of the dashboard. When the dashboard is open in the browser, press F12, and the debugging console similar to the one in the following screenshot will appear.
Note that the following example figure is explained using the Mozilla Firefox browser. The debugging console looks pretty much the same for other browsers as well:
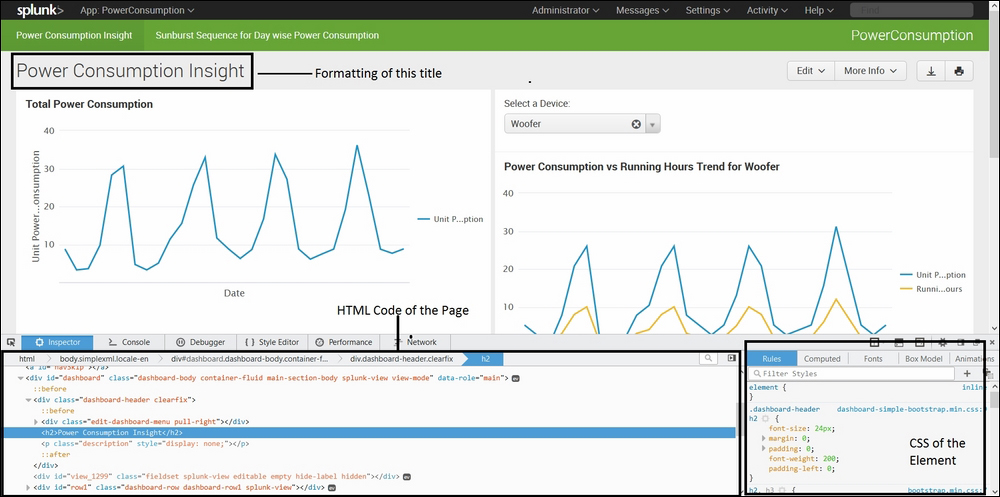
The lower part of the browser, which shows the HTML code and CSS, is part of the browser's debugging console. We are interested in changing the aesthetics of the title, as highlighted in the preceding figure. The following are the steps to implement it:
- Right-click on the part of the element that is to be modified, and click on Inspect Element. In our example, the element on which we right-click is Title, as highlighted in the preceding figure.
- The HTML and CSS code of the inspected element will be available in the debugging console.
- The respective styles already applied on the element will be visible, and the CSS element tag used to modify the properties can be found in the CSS segment of the debugging console. The following figure shows the CSS debugging console:
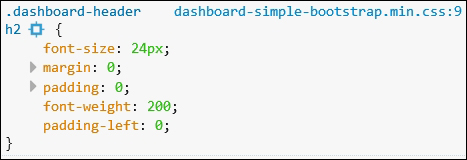
So,
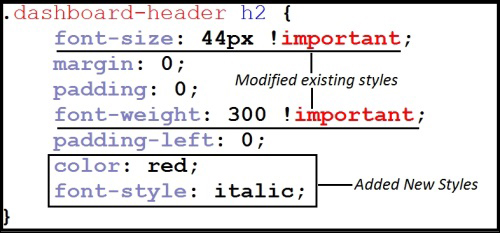
.dashboard-header h2is the style applied on the title of the dashboard, and we can modify it by overriding the preceding default properties in our custom CSS file as follows:The preceding example figures show that
font-sizeandfont-weightare modified and two new styles,colorandfont-style, have been added to customize the title as per our requirement.Note that the existing styles that are modified have
!important, whereas the ones that are newly added are missing this postfix. The reason is that in CSS,!importantis used to override wherever added. So, this postfix is added to only those that have a pre-existing style, and new styles need not have this postfix.In many cases, the modified custom CSS code is not applied on the dashboard until the Splunk server is restarted and browser cache is cleared.
- The result of the preceding custom modification in
layout.csswill be similar to the one shown in the following figure. Thecolorvalue is changed toredfrom the defaultblackcolor. The size is increased from24pxto44px. Thefont weightvalue is increased to300and thefont-stylevalue is set toitalic. The following is the output of these changes: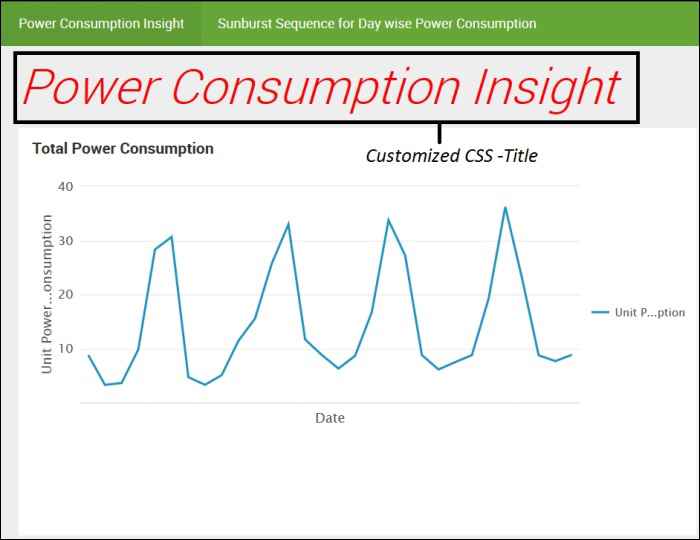
Similarly, depending on the requirement, any of the elements of the Splunk dashboard can be modified as per the requirement using custom CSS.