
In the preceding section, we saw how to use R along with Splunk to generate useful insight from the data using R libraries from Splunk itself. In this section, we will see how to use the processing power of Splunk and the visualization power of Tableau for interactive visualization.
Tableau is a very advanced, interactive, business-intelligent software. It helps in deriving instantaneous insights by data transformation into interactive visualizations. It has an easy-to-use drag and drop feature that helps in making highly useful dashboards in minutes. Splunk already has a pivot feature and ample visualization, but Tableau can be used to answer many unknown questions from the data.
With Splunk being a big data tool and Tableau being an excellent interactive visualization tool, their integration can be very useful to derive insight and take informed business decisions on time.
There are various variants of Tableau, and a suitable version of Tableau can be downloaded from its website (http://www.tableau.com/products), and this needs to be installed so that we are able to integrate it with Splunk.
Splunk's integration with Tableau requires the Splunk ODBC driver, which can be downloaded from the Splunk app store (https://splunkbase.splunk.com/app/1606). Proper care is to be taken while installing the ODBC driver, and depending on the Tableau version (32 bit/64 bit), a corresponding ODBC version needs to be installed.
Let's understand how the data from Splunk can be fetched in Tableau using the ODBC drivers to create interactive dashboards. The following screenshot shows the complete procedure of accessing data:
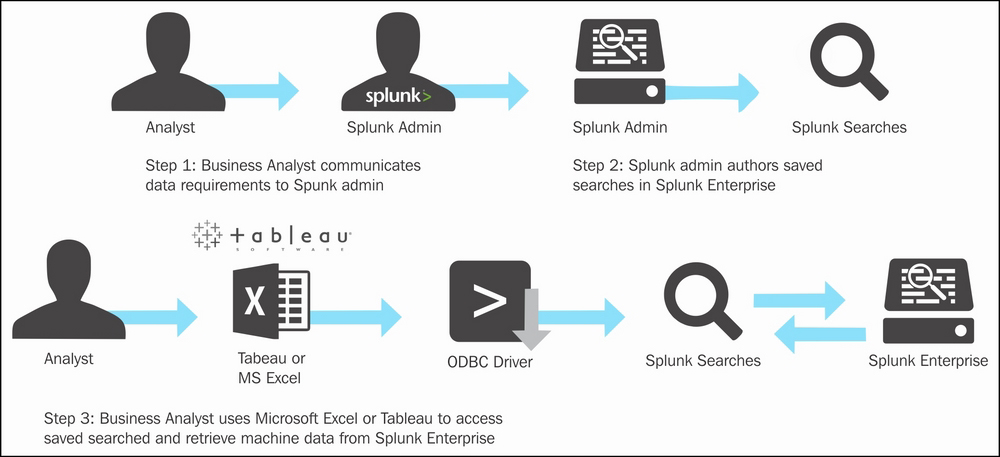
Tableau accesses data from Splunk via saved searches. Saved searches are search queries that are saved in Splunk Enterprise. Basically, saved searches are stored by the Splunk admin on the instructions given by business analysts. Now, an analyst can use Tableau and connect to Splunk using the Splunk ODBC drivers. The ODBC driver fetch all the saved searches from Splunk Enterprise in Tableau for the corresponding login. The saved searches then help to fetch the respective data from Splunk Enterprise, which can be used to create visualizations in Tableau.
The following is the procedure to connect Splunk from Tableau (in this example, Tableau 9.3 is used):
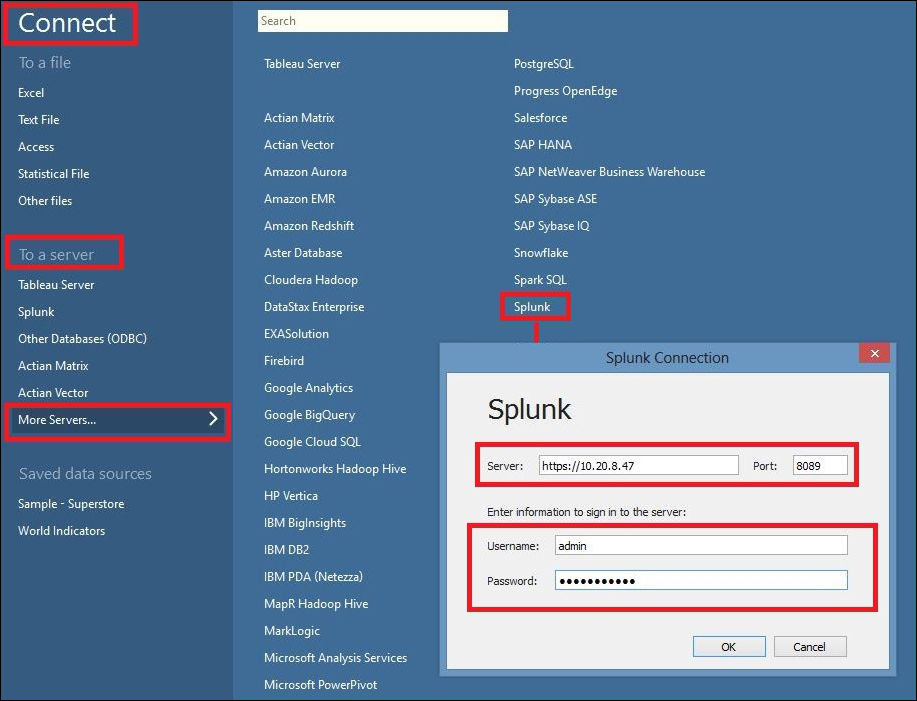
- Navigate to Tableau | Connect | To a server | More Servers… | Splunk. A page similar to the following will appear. Fill in the corresponding details, for fields like Server, Username, and Password of Splunk to connect to it.
- On successful authentication, Tableau will be able to communicate with the Splunk Server and fetch all the saved searches available for the login credentials used. The following screenshot shows saved searches fetched from the Splunk Server:
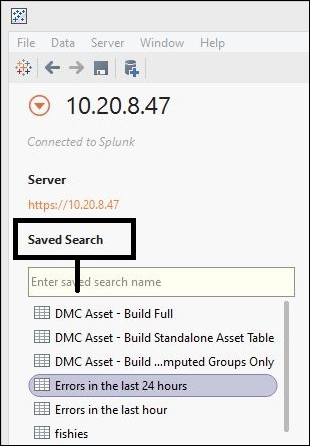
- Select the Saved Search from the list on which analytics are to be done using Tableau. Once the Saved Search is selected, Tableau provides an option for the connection type, that is, Live or Exact.
- The Live connection can be selected when the data in Splunk is updated every moment and the visualization to be created on Tableau should have real-time data.
- The Exact connection is selected to fetch only the data that is available for the given saved search at that time. In this case, any change in data on Splunk will not be reflected on Tableau.
- After the connection type is selected, click on the Update Now/Update Automatically button to fetch data from Splunk for visualization.
Once the preceding procedure is complete, Tableau can be used to create interactive visualization over the data fetched from Splunk. Thus, Tableau can be integrated with Splunk to use the power of visualization of Tableau for advanced analytics and better visualization.