
Anomaly detection, also known as outlier detection, is a branch of data mining that deals with identification of events, items, observations, or patterns that do not comply to a set of expected events or patterns. Basically, a different (anomalous) behavior is a sign of an issue that could be arising in the given dataset. Splunk provides commands to detect anomalies in real time, and this can useful in detecting fraudulent transaction of bank credit cards, network and IT security frauds, hacking activity, and so on. Splunk has various commands that can be used to detect anomalies. There is also a Splunk app named Prelert Anomaly Detective App for Splunk on the app store. It can be used to mine the data for anomaly detection. The following commands can be either used to group similar events or to create a cluster of anomalous or outlier events.
The anomalies Splunk command is used to detect the unexpectedness in the given data. This command assigns a score to each event, and depending on the threshold value, the events are then classified as anomalous or not. The event will be reported as anomalous if the unexpected score generated by the anomalies command under the unexpectedness field is greater than the threshold value. Due to this, it is very important to decide and specify the appropriate threshold value to detect anomalies in the given dataset.
According to Splunk documentations, the unexpectedness score of an event is calculated based on the similarity of that event (X) to a set of previous events (P) based on the following formula:
unexpectedness = [s (P and X) - s(P)] / [s(P) + s(X)]
The syntax for the anomalies command is as follows:
… | anomalies
    threshold=threshold_value
    normalize= True / False
    field=Field_Name
    blacklist=Blacklist_Filename
All the parameters for this command are optional. Running the anomalies command creates the unexpectedness field with the unexpectedness score. The parameter description of the anomalies command is as follows:
Threshold: Thethreshold_valueparameter is the upper limit of normal events. All the events having theunexpectednessfield value greater than this threshold value will be reported as anomalous.Normalize: The default value of this parameter istrue, which means the numeric text in the events will be normalized. In the process of normalizing, all the numeric characters from 0 to 9 are considered identical to calculate the unexpectedness value.Field: Using this parameter, the field on which the unexpectedness value is to be calculated to detect the anomaly can be specified. The default value for this parameter is_raw.Blacklist: The name of the file located at$SPLUNK_HOME/var/run/splunk/containing the list of events that should be ignored while calculating the unexpectedness score.
Take a look at the following sample query:
source="outlierData" | anomalies labelonly=false by Strength | table Strength Latitude unexpectedness
The output of the preceding query would look similar to the following screenshot:
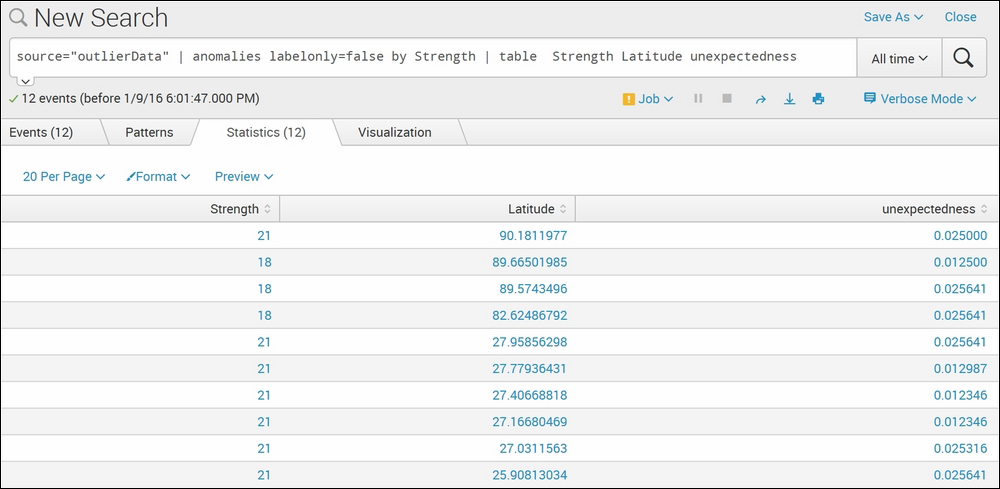
The example dataset is of mobile signal strength with respect to location. The dataset has respective signal strength (fieldname—Strength) reported by the mobile device at the given location (fieldname—Latitude). The Splunk anomalies command resulted in 12 anomalies in the dataset, with their respective unexpectedness value. Thus, using the anomalies command can help find out the anomalies in the given dataset, along with the unexpectedness value. The threshold parameter can be set to get the result with less or more unexpectedness value.
The Splunk anomalousvalue command, as the name suggests, is used to find the anomalous value from the given dataset. This command calculates the anomaly score for the specified field-list by calculating the frequency of occurrence or by means of standard deviation. This command can be used to find anomalous values that are less frequent or the values that are at a distance from the other values of respective fields of the dataset.
The syntax of the anomalousvalue command is as follows:
… | anomalousvalue
    action = filter / annotate / summary
    pthresh = Threshold_value
    field-list
The parameter description of the anomalousvalue command is as follows:
Action: This parameter defines what action is to be taken on the result. If the value of this parameter isfilter, which is also the default value of this parameter, it will show only the anomalous value in the result. The non-anomalous values are ignored in the result. If the value of this parameter issummary, then the result shows the statistical table containing fields such ascount,distinct count,mean,Standard deviation,Support, and various statistical frequencies. If the action is set to annotate, then the result will show a new field containing the anomalous value.pthresh: This parameter is used to specify the threshold value to mark a value as an anomalous value. The default value of this parameter is0.01.field-list: The list of fields for which the anomalous value is to be outputted. If the field list is not specified, then all the fields of the events will be considered to calculate the anomalous value.
Refer to the following example for better clarity:
source="outlierData" |table Strength Latitude | anomalousvalue Strength
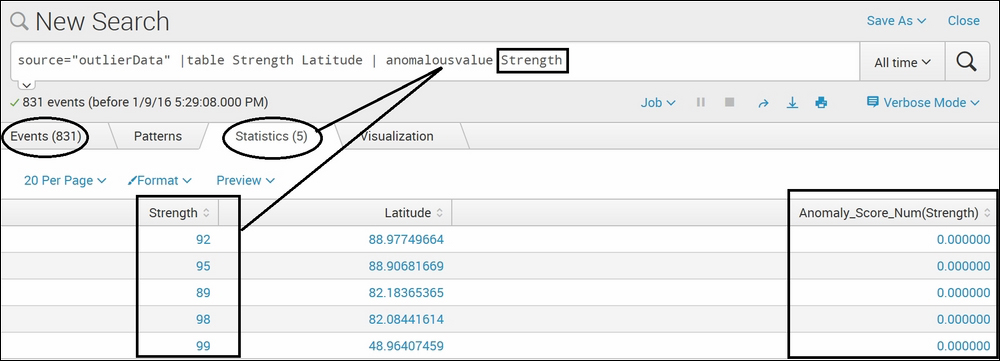
The dataset used for this example is the same as the preceding example of the anomalies command. The anomalousvalue Splunk command on the strength field, Strength, resulted in five events out of a total of 831 events. This means that for the respective Latitude values, the corresponding Strength value is anomalous in the result. This command also resulted in Anomaly_score for the Strength field, which depicts the anomaly score of the respective anomalous value.
Clustering is a process of grouping events on the basis of their similarity. The cluster Splunk command is used to create groups based on content of events. According to the Splunk documentation, Splunk has its own algorithm of grouping the fields into clusters. The events are broken into terms (match=termlist), and then the vectors between events are computed. This command creates two custom fields, one that is the size of the cluster and the other cluster has the grouped events in it.
The syntax of the cluster command is as follows:
… | cluster
      t = Threshold_value
      field = Fieldname
      match = termlist / termset / ngramset
      countfield = Count_FieldName
      labelfield = Label_FieldName
The description of the parameters of the preceding query is as follows.
There are no compulsory parameters for this command. All the parameters are optional:
T: This parameter is used to specifythreshold_valueto create the clusters. The default value for this parameter is 0.8, which can range from 0.0 to 1.0. Let's say ifthreshold_valueis set to1, that means a greater number of similar events will be required to be placed in one cluster than if the value is 0.8.Field: This parameter can be used to specify on which field of every event the clusters are to be created. The default value for this parameter is the_rawfield.Match: The grouping to create clusters in Splunk is done in the following three ways, which can be specified in this parameter:Termlist: This is the default value for a match parameter that required the exact same ordering of the terms to create a cluster.Termset: An unordered list of terms will be considered to create the cluster.Ngramset: Compares sets of three character substrings (trigram).
Take a look at the following example:
source="DataSet.csv" |cluster
The output of the earlier query would generate an output like the following:
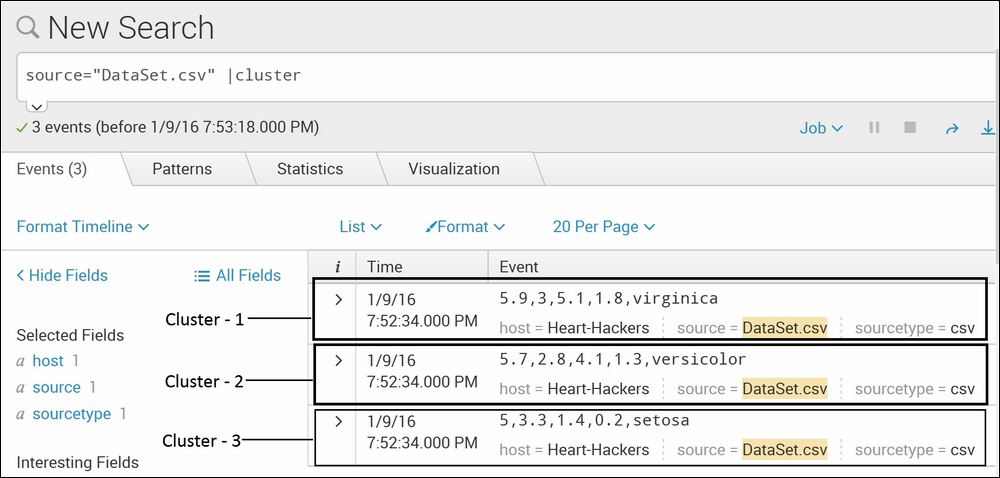
The dataset used for this example contains sepal length, sepal width, petal length, and petal width of three different species of plants. Given the values of sepal length, sepal width, petal length, and petal width their species could be determined. The cluster Splunk command creates three clusters, each containing each of the species in the given data. This is a very simple example for explanatory purpose, but this command can be very useful in creating clusters of events with similarities. Splunk provides the match parameter, which can be used for different grouping methods such as Termlist, Termset, and ngramset. If the algorithm is not giving accurate results of the clusters, then the threshold value can be set accordingly by proving value to the T parameter in this command.
K-means is an algorithm of cluster analysis in data mining. The kmeans Splunk command is used to create clusters of events defined by its mean values. The k-means clustering can be explained with the help of an example. Let's say I have a dataset that has information about Jaguar cars, jaguar animals, and Jaguar OS. Using k-means, three clusters can be created, with each cluster having events of respective types only. Basically, k-means creates a cluster of events on the basis of their occurrence of other events. If event X occurs, then almost 90 percent of the time, event Y also occurs. Hence, k-means can be used to detect issues, frauds, network outages, and so on in real time.
Take a look at the following query syntax:
… | kmeans
    k = k_value
    field_list
The list that follows describes the parameters of the preceding query.
There are no mandatory parameters for this command. All the parameters are optional.:
K: Specifies thek_value, which is the integer value defining the number of clusters to use in the algorithm. The default value ofkis2.Field_list: List of fields that are to be considered to compute the algorithm. By default, all the numeric fields are considered and non-numeric fields are ignored.
An example of the kmeans query looks like the one that follows:
sourcetype=kmeans | table Group Alcohol diluted_wines |kmeans k=3
The output would look similar to this:
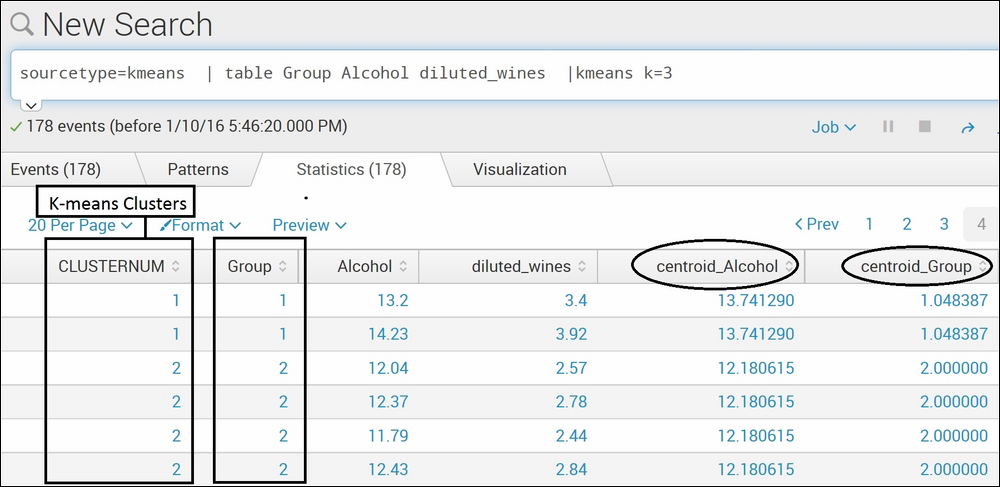
The dataset used in the preceding example is data containing various ingredients of three different alcohols. The Splunk command kmeans creates three cluster (k=3) under the CLUSTERNUM fieldname. To verify the result, if the clusters made by kmeans match with the actual group, the Group field is shown in the preceding example image. Cluster 1 matches with group 1, and cluster 2 matches with group 2. The kmeans command can be useful in creating clusters as per requirement. Let's suppose we are aware that the dataset is of three different alcohol types but want to cluster it into two groups only. In this case, k=2 can be used in the command. The kmeans command also calculates the centroid of each field and displays it in the result. K-means is one of the efficient algorithms of clustering.
According to statistics, an outlier is an event that is at a distance from other events in the typical distribution of data points. An outlier can be caused due to issues or errors in the system from where the dataset is generated. The outlier Splunk command is not used to find out the outliers, but it removes the outlier events from the data. This command removes the outlying numeric values from the specified fields, and if no fields are specified, then the command is processed on all the fields.
The Splunk documentation states the filtering method used in the outlier command is Inter-quartile range (IQR).that is; if the value of a field in an event is less than (25th percentile) - param*IQR or greater than (75th percentile) + param*IQR, that field is transformed or that event is removed based on the action parameter.
The syntax for the outlier command is as follows:
… | outlier
      action = remove / transform
      mark = true / false
      param = param_value
      uselower = true / false
The parameter description of the outlier command is as follows.
There are no mandatory parameters for this command. All the parameters are optional:
Action: This parameter specifies the action to be performed on the outliers. If set toremove, then the outliers containing events are removed, whereas if set totransform, then it truncates the outlying values with the threshold value. The default option for this parameter istransform.Mark: This command prefixes the outlying value with000ifactionis set totransformand this parameter is set totrue. Ifactionis set toremove, then this parameter is ignored. The default value for this parameter isfalse.Param: This parameter defines the threshold value for theoutliercommand with the default value as2.5.Userlower: If set totrue, then the values below the median will also be considered for the outlier calculation. The default is set tofalse, which only considers the values above the median.
Take a look at the following example:
source = "outlier2.csv" | outlier action=remove Strength
The output should look like that shown in the following screenshot:

As explained earlier, the outlier Splunk command can be used to either remove or transform the outlier values. In the preceding example, action is set to remove for the outlier command on the strength field which removes the outlying values from the result. In the preceding screenshot, the last three entries of strength are not available as those values of the strength field were outliers. Using this command and setting action to transform can transform the outlying values into the threshold limit. Thus, this command can be useful in finding out outlier values for the specified or, by default, for all the numeric fields.
As the name suggests, the rare Splunk command finds the least frequent or rare values of the specified field or field list. This command works exactly the opposite of top commands, which return the most frequent values. The rare command returns the least frequent values.
The syntax for the rare command is as follows:
… | rare
    countfield=Count_FieldName
    limit= Limit_Value
    percentfield= Percentage_FieldName
    showcount= true / false
    showperc= true / false
    Field_List… by-clause
The description of the parameters of the preceding query is as follows.
Of all the preceding parameters, Field_List is the compulsory field. The rest are optional and can be used as per requirement:
Field List: This is the only compulsory field of this command is used to specify the list of fields on which therarecommand is to be run to calculate the rare values. The specified fields or the field list's rare values will be calculated and shown in the results. The field lists can be followed by thebyclause to group one or more fields.CountField: This parameter defines the field name (Count_FieldName) where the count of rare values is written. The default value for this parameter iscount.Limit: This parameter defines the number of results returned by this command. The default value is10.PercentField: The fieldname (Percentage_FieldName) in which the percentage values are to be stored can be specified in this parameter.Showcount: If this field is set tofalse, then theCountfield is not shown in the results. The default value of this parameter istrue.Showperc: If this field is set tofalse, then thePercentagefield is not shown in the results. The default value of this parameter istrue.
The sample query should look like this:
index="web_server" | rare limit=6 countfield=RareIPCount PercentField=PercentageRareValuesdevice_ip
The above query will generate an output like the following screenshot:
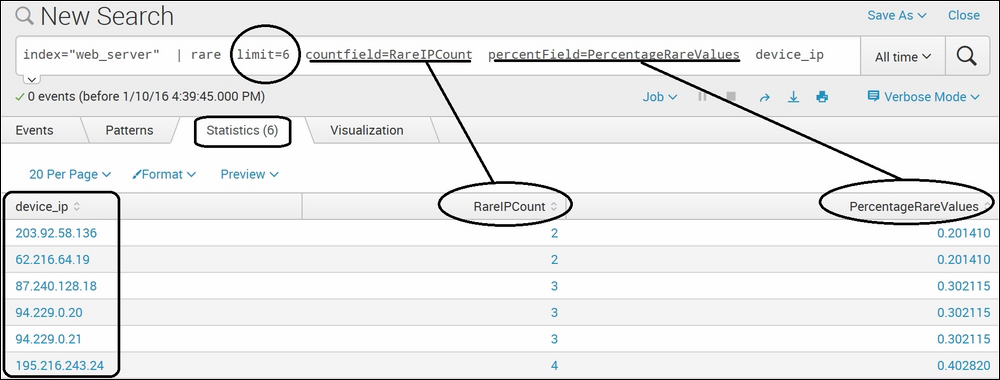
In the preceding screenshot, for the rare Splunk command, we have used data that contains visitor information on an Apache-based web server. Using this command on the device_ip field with a limit of 6 resulted in the top six rare IP addresses, along with the count (RareIPCount) and the percentage (PercentageRareValues). Thus, this command can be used to find rare values from the given dataset, along with the count and percentage of their occurrence.