
Splunk Enterprise introduced new interfaces to accept data that is compatible with constrained resources and lightweight devices for Internet of Things. Splunk Enterprise version 6.3 supports HTTP Event Collector and REST and JSON APIs for data collection on Splunk.
HTTP Event Collector is a very useful interface that can be used to send data without using any forwarder from your existing application to the Splunk Enterprise server. HTTP APIs are available in .NET, Java, Python, and almost all the programming languages. So, forwarding data from your existing application that is based on a specific programming language becomes a cake walk.
Let's take an example, say, you are a developer of an Android application, and you want to know what all features the user uses that are the pain areas or problem-causing screens. You also want to know the usage pattern of your application. So, in the code of your Android application, you can use REST APIs to forward the logging data on the Splunk Enterprise server. The only important point to note here is that the data needs to be sent in a JSON payload envelope. The advantage of using HTTP Event Collector is that without using any third-party tools or any configuration, the data can be sent on Splunk and we can easily derive insights, analytics, and visualizations from it.
HTTP Event Collector can be used when you configure it from the Splunk Web console, and the event data from HTTP can be indexed in Splunk using the REST API.
HTTP Event Collector (EC) provides an API with an endpoint that can be used to send log data from applications into Splunk Enterprise. Splunk HTTP Event Collector supports both HTTP and HTTPS for secure connections.
The following are the features of HTTP Event Collector, which make's adding data on Splunk Enterprise easier:
- It is very lightweight is terms of memory and resource usage, and thus can be used in resources constrained to lightweight devices as well.
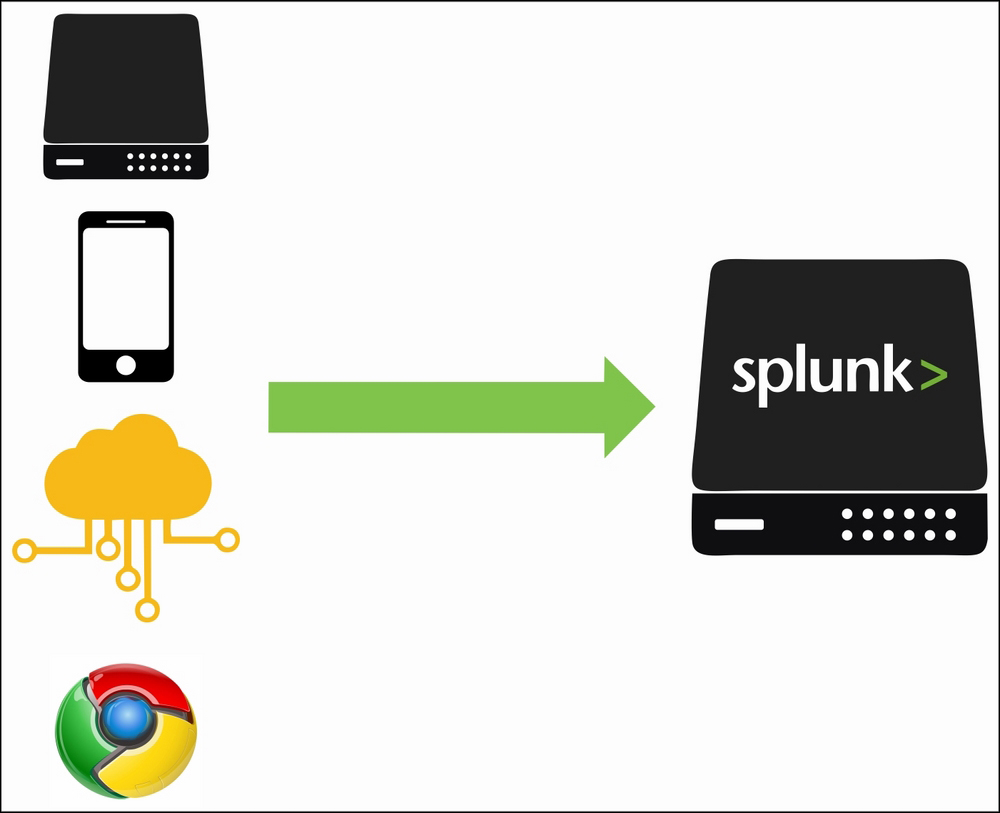
- Events can be sent directly from anywhere such as web servers, mobile devices, and IoT without any need of configuration or installation of forwarders.
- It is a token-based JSON API that doesn't require you to save user credentials in the code or in the application settings. The authentication is handled by tokens used in the API.
- It is easy to configure EC from the Splunk Web console, enable HTTP EC, and define the token. After this, you are ready to accept data on Splunk Enterprise.
- It supports both HTTP and HTTPS, and hence it is very secure.
- It supports GZIP compression and batch processing.
- HTTP EC is highly scalable as it can be used in a distributed environment as well as with a load balancer to crunch and index millions of events per second.
The following are the steps to configure HTTP EC via Splunk Web:
- Enabling the Event Collector:
- Open the Splunk Web console and go to Settings | Data Inputs.
- On the Data Inputs page, click on HTTP Event Collector.
- On the HTTP Event Collector page, in the top right corner, click on Global Settings.
- The Edit Global Settings page pops up after this, which is similar to the following screenshot:
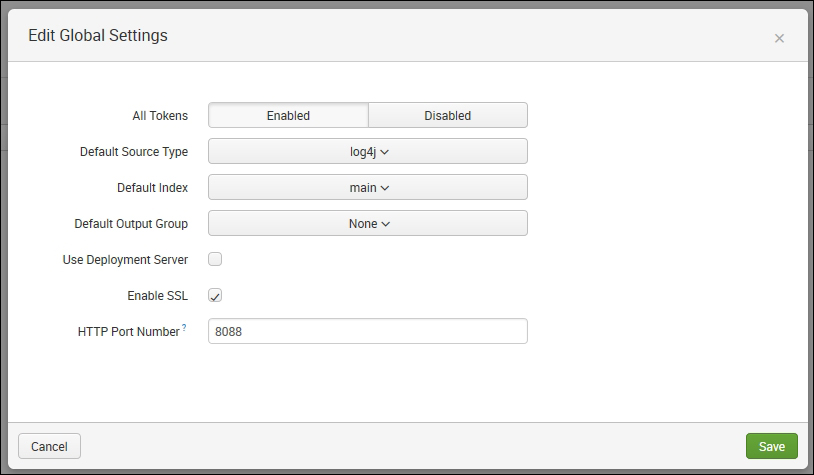
For the All Tokens option, click on Enable
- Depending on the source from where the data is coming or the type of data, choose your respective source type. On selecting the specific source type, relevant configuration and event parsing settings will be applied by default to the data getting uploaded through EC.
- If you wish to use the deployment server to configure EC tokens, then the Use Deployment Server checkbox needs to be selected.
- Various other settings such as the index in which data needs to be uploaded, whether to use HTTP or HTTPS (the SSL option), and the port number to be used in the endpoint can be configured accordingly from the Settings section.
- After modifying the relevant settings, click on Save to apply the settings.
- Creating a new token: New tokens can be created either from the Add Data section of Splunk or from the HTTP Event Collector page from where the Global Settings were modified.
The following are the steps to create a new token from the Global Settings page:
- Click on the New Token button on the top right-hand side of the Global Settings page. This takes the user to the Add Data screen with the HTTP Event Collector options
- This page asks for Name, Source name override, and Description of the token, similar to what is shown in the following screenshot:
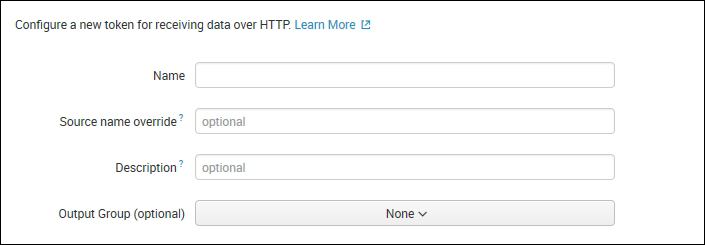
Enter the Name, Source name override, and Description to identify the token. Also, users can set Output Group if any and then click on Next.
- The next page gives users the option to choose the index and source type. If the user wants to create a new index or a new source type, then it can be created from this page itself. After selecting the index and source type, click on Next.
- A review page appears, where you can verify all the inputs and settings configured for the new token, and then click on the Submit button to create the new token.
- After clicking on Submit, the HTTP Event Collector token is generated and displayed on the screen. This token can now be used in the HTTP API to forward data on Splunk.
- Verifying HTTP Event Collector: Follow the given series of steps to verify Event Collector:
- To test and verify whether the Event Collector and token is properly configured, developers can use the following simple
curlcommand:curl -k https://IPAddress:PortNumber/services/collector/event -H "Authorization: Splunk TOKEN_GENERATED_IN_ABOVE_STEP" -d '{"event": "This is a test of HTTP Event Collector"}'Note that
PortNumberrefers to the port number which was configured in the Edit Global Settings page. In our case, we used8088.In response to the preceding
curlcommand, the following response concludes that the events were successfully uploaded on Splunk:{"text": "Success", "code": 0} - The uploaded event can also be checked by logging into the Splunk Web console and using the search in the selected source type or index.
- To test and verify whether the Event Collector and token is properly configured, developers can use the following simple
Event Collector tokens can be modified by going to the Settings menu from the Splunk Web console and then clicking on Data Inputs. On the Data Input page, click on the HTTP Event Collector option. This page will list all the tokens that we created.
The tokens can be created, modified, and deleted from the Data Input section. Click on the respective Edit button of the token that needs to be modified. On doing so, various parameters such as Source type, Index, Output group, and others can be modified from here for the selected tokens. If any token is not in use for some time or not required at all, then it can be disabled or deleted as per the need.
The HTTP Event Collector data needs to be in a specific format that is understood by Splunk Enterprise for it to parsed correctly by Splunk. Splunk HTTP Event Collector accepts the data sent from various sources in a series of JSON packets. The JSON packets comprise of two parts, one is the metadata and the other part is the data contained in the event key. The metadata has various parameters in a key-value format, whereas the event key has the actual data in it.
The sender of data is responsible for packaging data in the JSON format. The data can be packed either using Splunk logging libraries available for Java and .NET or using Java Apache HTTP Client or scripts or code can be written which encodes the data in the format specified in the following sections.
The authentication is done by Splunk Event Collector using tokens. The data source needs to be authenticated and authorized first before it starts sending data to the Splunk server. The authorization is done using a client-side authorization header. Each JSON data package carries the same unique token in the authorization header. When the token is verified by HTTP EC, it consumes the data and sends a positive response to the sender. The response looks like this:
Authorization: Splunk 87654321-4321-1234-4321-0987654321XZ
The following are the key-value pairs that can be included in the event's metadata for any set of settings that are to be overridden by what is defined in the token settings:
time: The event data can be timestamped using this key-value pair of metadata. The default time format is epoch time in the<seconds>.<milliseconds>format.host: The hostname of the source can be defined in this key. This key can be very useful to identify the device from which the data came. In case of IoT, there can be a number of devices to uniquely identify the data of specific devices to which the hostname can be assigned.source: The source name can be specified in this key. This along with the host can be used to identify the source of the data in multiple-source deployment of Splunk.sourcetype: This key is used to identify the type of data so that the respective parsing and event processing can be done as per the data type or data source.index: This is the index in which the event will be uploaded on Splunk.
An example of metadata is as follows:
{
  "time": 1448190998,
  "host": "192.168.10.150",
  "source": "Humiditysensor-Mumbai",
  "sourcetype": "csv",
  "index": "IoT"
}
Event data is associated with the event key, and it contains the actual data that needs to be uploaded on Splunk for analytics and visualization. Event data is also represented in the JSON format:
An example of event data is as follows:
"event":
{
  "8.00": "32",
  "12.00": "35",
  "16.00": "33",
  "20.00": "29",
}
The following is a complete JSON packet with metadata and event data:
{
  "time": 1448190998,
  "host": "192.168.10.150",
  "source": "Humiditysensor-Mumbai",
  "sourcetype": "csv",
  "index": "IOT",
  "event":
  {
    "8.00": "32",
    "12.00": "35",
    "16.00": "33",
    "20.00": "29",
  }
}
When a collected HTTP event receives the preceding JSON packet, it parses the data and then sends it to the indexers for event processing. It uses the metadata if any specific set of settings and configurations is applied on the uploading data by the event collected before it gets uploaded in the indexer.
Splunk introduced HTTP-based and JSON-based REST APIs to encourage the use of Splunk for IoT devices. There are various messaging and communication protocols and message brokers that are more widely used in IoT, such as CAOP, MQTT, Apache KAFKA, JMS, AMQP Broker, and the cloud streaming protocol such as Amazon Kinesis. The Splunk app store has modular input technology add-ons for all of these protocols supported by HTTP Event Collector that are ready to use. Respective modular inputs can be used along with HTTP EC to upload data on Splunk Enterprise.