
The Splunk dashboard provides options to link various visualizations or statistical output in a panel to be switched without navigating from the Dashboard page. Technically speaking, links are used to perform a few sets of activities, like show/hide panel, switch visualizations, and so on, without navigating to another dashboard or screen on Splunk.
Data can be visualized in many forms, like tabular statistical output, or charts, graphs, and many more. From each different visualization of the same data, different kinds of insights can be derived. We have already learned in previous chapters about different types of visualization and the respective insights available from each of these visualizations. We will now use the link switcher, which is nothing but a link to toggle the content of the dashboard. The link switcher can be used to change the visualization type on the result of the same search query, or run different searches on each link, as required.
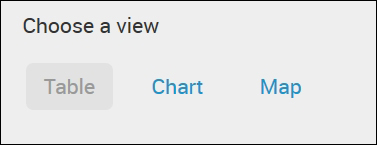
Let us understand the use of the link switcher in the dashboard along with the implementation part of the link switcher on the Splunk dashboard. In our example, there are three links (Table, Chart, and Map), which the user can click and choose to get the selected visualization on the dashboard.
The link on the visualization dashboard looks as in the following image. In the following example image, the Table link is selected and hence, it looks highlighted:
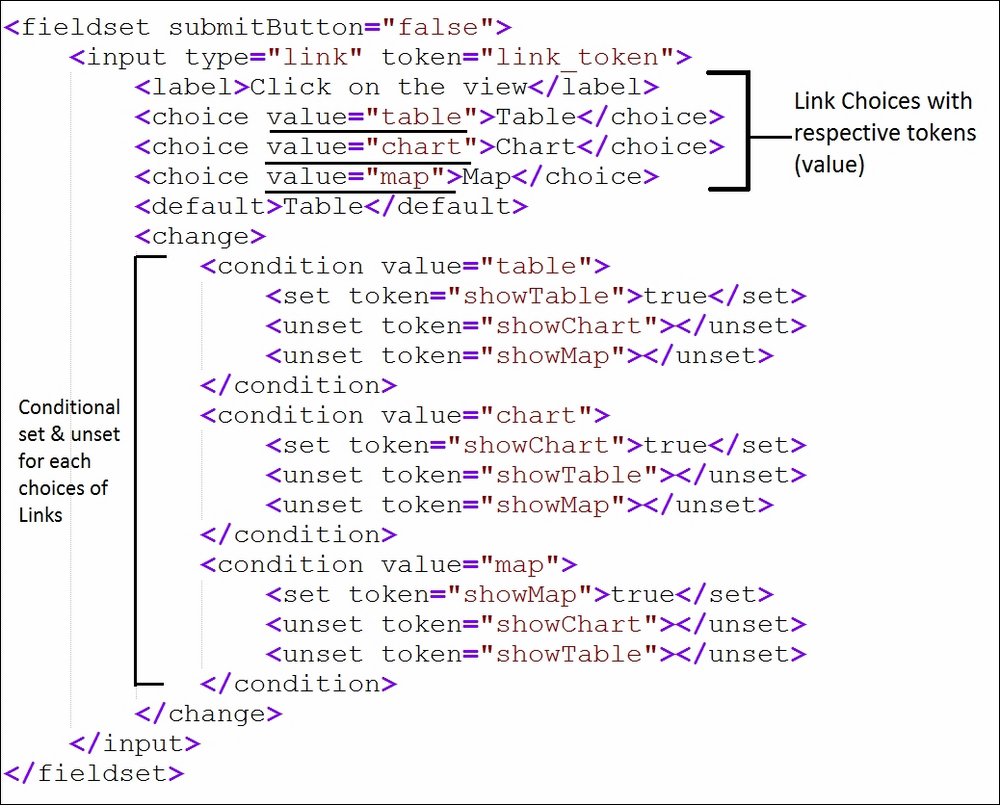
The following source code is need to create a link along with the condition definition of each of the links. Let's say, for instance, when the condition value is set with Table by clicking on the Table link, then Chart and Map are hidden by the unset parameter in the <condition> tag. Similarly, for other links, respective visualization are unset and the selected visualization is set:
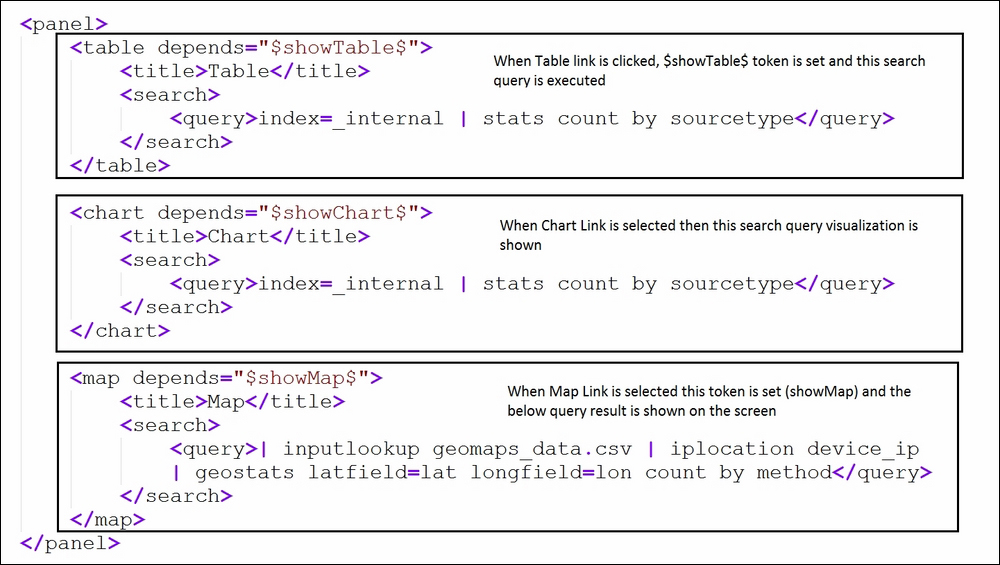
Now since we have defined the conditions for the respective links, let us have a look at the source code snippet, which will be shown as a visualization on clicking respective links. Let me explain one part of the following snippet with an example. When the Table link is clicked, the showTable token is set and showChart and showMap are unset, as shown in the preceding code snippet image. So by setting the showTable token, the following search query gets executed and the resulting visualization is shown in the panel of the dashboard. Since the <table> tag is used, the resulting output is a statistical table; likewise, for chart <chart> and map <map> tags are used:
The output of the preceding code snippet will be as follows, which shows the links and the selected links visualization. In the output image, as we can see, the Chart link is selected and hence, the visualization in the visible panel is showing the Chart output of the preceding code snippet search query. So, if the Map link is selected in the dashboard, then the chart visualization will be hidden and the map visualization will be visible in the same panel of the dashboard, and so on for the other links as well:

We have already learned about the link switcher, in which the dashboard panels are switched to different visualizations by clicking on different links on the dashboard. Now we will look into the button switcher, which is similar to the link switcher, but in this case the value of the token is set/unset by clicking on buttons. The output of the example will be the same as that of the link switcher, but the background processing and implementation logic differs. The link switcher and button switcher look analogous in terms of functionality on the dashboard, but functionality-wise, the uses of the link switcher and button switcher are different.
In the case of the link switcher, the visualization is changed in the same panel of the dashboard, whereas in the button switcher, we will add another panel, keeping the pre-existing panel also in the dashboard. For example, let's say we have a panel which shows the visualization of the data, and if the user is interested in having a look at statistical tabular output along with the visualization, a button switcher can be added.
Let us understand what the button switcher actually is and how it differs from the link switcher with the help of an example. We will also have a look at the implementation of the button switcher on Splunk dashboard, along with an example.
The following panel of the Splunk dashboard has a button, which we will use as a switcher:

When the button (Show Details) is clicked, the current panel resizes itself in half, accommodating another panel with a defined visualization. The output, when clicked, shows details which look as shown here:
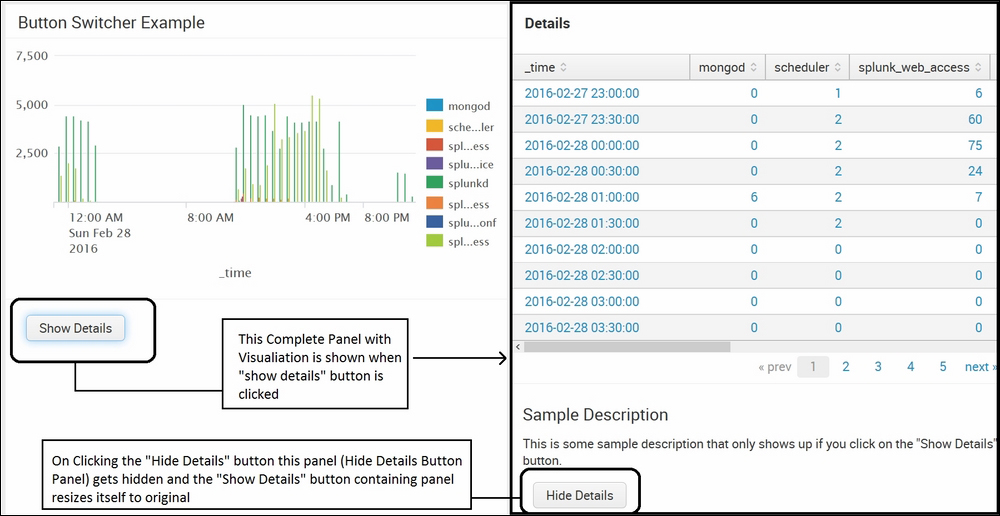
As seen from the preceding image, on clicking Show Details, the panel resizes itself and a new panel with a visualization and a Hide Details button is available. On clicking the Hide Details button, the panel hides itself and restores the Show Details panel to its original size. Thus, the button switcher can be used to create such customized dashboards where the information that is optional is kept hidden, and can be viewed by clicking a button.
Now, to summarize the difference between the link switcher and button switcher, The link switcher shows different visualizations in the same panel, whereas in the button switcher, a new panel with visualization is accommodated by resizing the current panel and thus can be useful to hold many panels in a single visualization efficiently.
The data attributes on clickable HTML elements (such as links or buttons) allow users to set or unset tokens for the dashboard. The following are the available data attributes, along with the syntax:

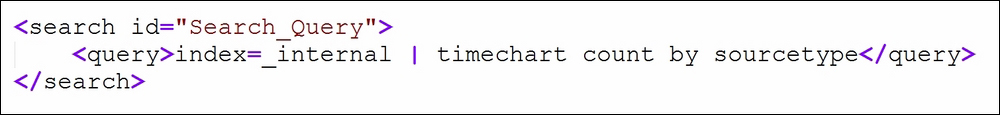
Let us now have a look at the XML code to use the button switcher on the dashboard. The following image is the search query, which runs on the panel of the dashboard. The important point to note down here is the search ID (Search_Query), which we will be using in the later section.
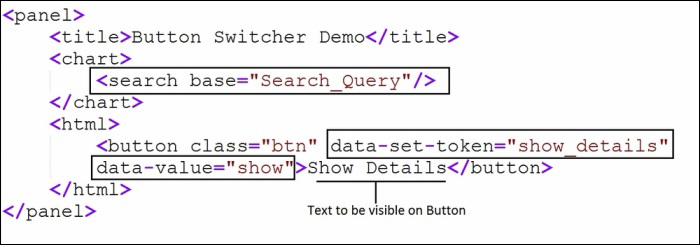
Now we will see the code snippet to create a button which also sets data-set-token="show_details", which we will use to show the new panel with visualization:
The following image shows the code snippet, which depends on the show_details token. This panel will only be visible whenever the show_details token is set, and that will be done by clicking the Show Details button, as explained in the preceding code snippet:
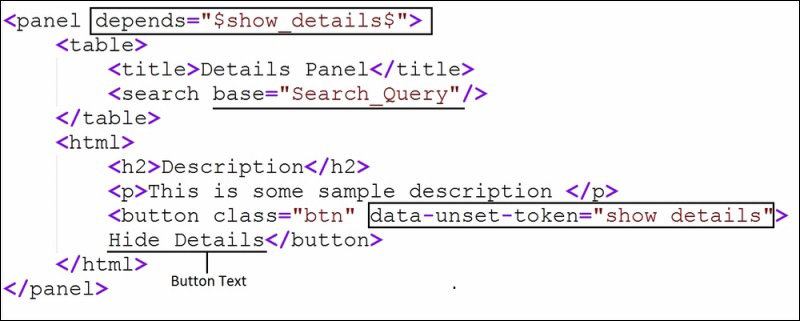
The preceding code snippet runs when the show_details token is set with the search query defined in the Search_Query token, and results in a statistical table. The code snippet also has an HTML code to create a button (Hide Details), which unsets the token show_details and thus, the panel gets hidden on a click of this button.
Thus, the button switcher can be used to customize the dashboard to show a panel with a click, and then the panel can be hidden on another button click when required. This kind of customization helps in building industry-quality dashboards.