
Splunk visualization provides a feature to drill down events by clicking on a cell or row. This feature can be enabled from the Format option, and either cell drilldown, row drilldown, or none can be selected from the menu options. The drilldown features help users to navigate to the events and have a detailed analysis and inference of the findings that are derived from the events. Instead of looking at the entire large dataset, the drilldown feature takes the user to the filtered set of events for better insight.
Apart from the cell and row drilldown using custom settings, various other customizations can be brought in the Splunk drilldown feature and more user-interactive dashboards can be built. Now, you will learn how custom drilldowns can be implemented in Splunk visualization. Custom drilldowns include dynamic drilldown, contextual drilldown, URL field value drilldown, and single value drilldown.
The dynamic drilldown feature in Splunk visualization can be used to control the content filter and the drilldown destination by passing the required information via a click. The dynamic drilldown feature can be implemented to pass an x-axis or y-axis clicked token to a form or destination page and a row or column value/name to populate a form or destination page.
Let's see how to implement the dynamic drilldown feature.
The following is our search query for the line chart visualization:
index=* | chart count by sourcetype
The output of the preceding search query for the line chart visualization is as follows:
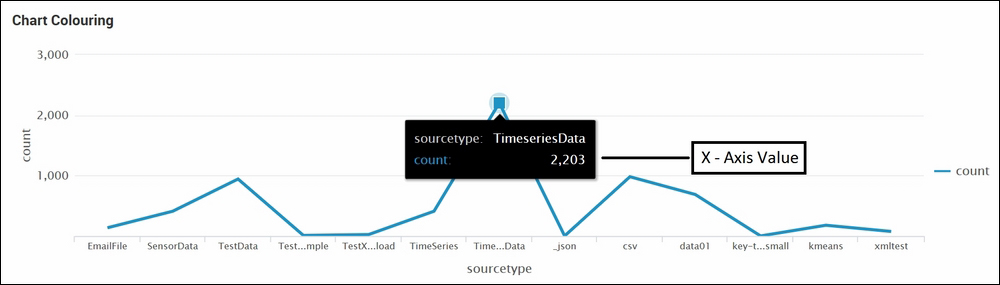
In the preceding figure, if drilldown is enabled, clicking on any point on the line chart will run a search command, showing the events relevant to the clicked data. Now, we will customize that instead of running the search query to show events, and the value that we've clicked on should be sent to a form:
<drilldown>
  <link>/app/search/test_form?form.textvalue=$click.value2$</link>
</drilldown>
Adding the preceding code in the XML file of the dashboard will navigate you to the test_form dashboard of the search app and will pass the clicked value to the field value that has the textvalue token of the test_form dashboard.
In the preceding example, when we clicked on the y-axis of the line chart, as shown in the preceding figure, it passed the 2203 value to the textvalue input of the test_form dashboard.
Similarly, if the visualization is a bar chart instead of a line chart, the same code can be used to pass the x-axis value to the form.
The heading sounds confusing, but this can be explained with the help of the following screenshot. Taking reference of the following example figure, when you click on TestData, it will pass 943 as the value to the field of the navigating form or search query as a token value. Similarly, for any row that we've clicked on, a corresponding value of the count field is passed:

The following code can be added in the respective panel of the dashboard in which this customization is required:
<drilldown>
  <link>/app/search/test_form?form.textvalue=$row.count$</link>
</drilldown>
In the preceding code, the corresponding value of the count field ($row.count$) will be passed to the textvalue input token of the test_form dashboard. If the value of any other field is to be passed, then in the preceding code instead of $row.count$, the count can be replaced in the field name of the file whose value is to be passed or used in a search query on drilldown.
The following code will facilitate the use of the fieldname as a value that can be passed as a parameter or can be used as a search query to filter results based on the fieldname of the clicked row or column:
<drilldown>
  <link>/app/search/test_form?form.textvalue=$click.name2$</link>
</drilldown>
The preceding code can be modified with the following dynamic textvalue to get desired results as explained in the following list:
click.name2can be used to pass the fieldname of the clicked row or columnclick.value2can be used to pass the clicked value of the row or columnrow.fieldnamecan be used to pass the value of the corresponding field name of the clicked row or column
Now, you will learn how to create an in-page contextual drilldown, that is, drilldown to access contextual information without leaving the page. In this section, you will learn how to pass the required value from a table/chart to another search query whose result will be populated on the same page below the current search result.
Let's first understand with an example what is contextual drilldown, the search query for which is as follows:
index=* |chart count by sourcetype
The output of the preceding search query will return a count of all sourcetype in all the indexes of Splunk. Now, suppose the user wants a scenario where clicking on a Sourcetype option shows the events of that respective sourcetype in the same page. This can be done using contextual drilldown. In the following screenshot, the top panel is the output of the preceding search query and the following panel is the result of clicking on EmailFile and the following search query:
index=* sourcetype=$sourcetype$
The preceding code generates the following output:
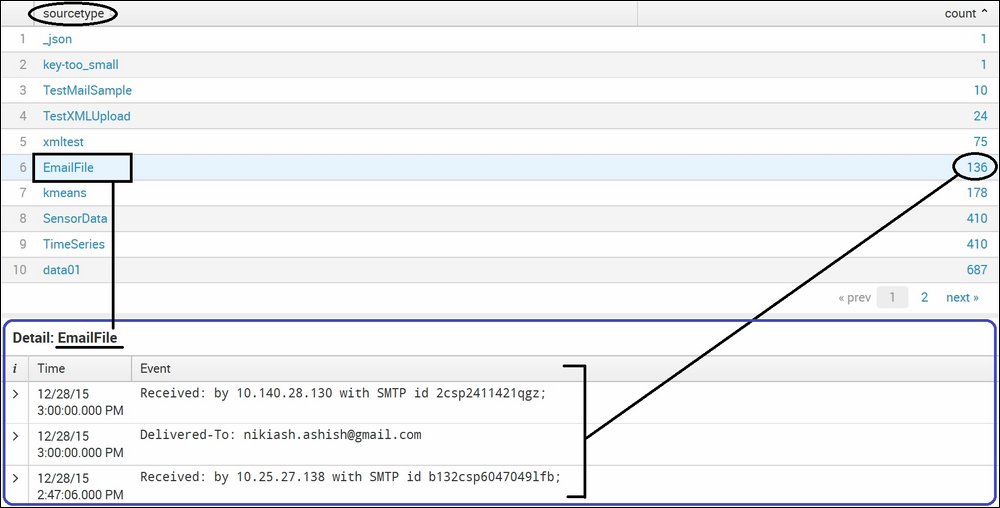
In the preceding example, the clicked value of the sourcetype field is passed as a value to the second search query, which runs on the second panel of the preceding screenshot. Let's see how we can customize a panel to implement contextual drilldown.
The following code needs to be added to the respective panel of the dashboard where contextual drilldown is to be implemented.
First, enable drilldown in the respective panel by adding the following code. The following code enables row drilldown. Then, it can be added in the XML file (the source code of the corresponding panel anywhere after the </search> tag or before the </table> tag):
<option name="drilldown">row</option>
The following code will get the value in the sourcetype token from the click event:
<drilldown>
  <set token="sourcetype">$row.sourcetype$</set>
</drilldown>
If the dashboard has any input field and the clicked event value is to be updated in the input field, then the following code can be added using the form keyword along with the ID of the input field. If the ID of the input field is sourcetype, then the token will be form.sourcetype. The following is the example code:
<drilldown>
  <set token="form.sourcetype">$row.sourcetype$</set>
</drilldown>
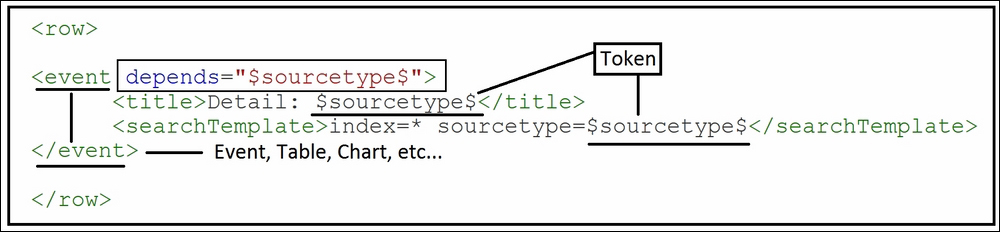
Now, the following source code is to be added for the second panel, which is not visible until we click on an event in the first panel:
The following are important sections and their use in the preceding code snippet:
<event>: The<event>tag describes that the result of search query will be shown in the event format. This can be replaced with a table, chart, or any other type of visualization.depends: This parameter should be provided with the value of the token. Thedependsparameter describes that the search query will run only when the token is available. If the token value is not available, then the panel will not be visible, since the token value will not be available and the search query will not result in any output.title: This is optional, but can be used to specify any static or dynamic title. In our example code, we used$sourcetype$as a title to have the value of the clickedsourcetypedynamically on every click.<searchTemplate>: This parameter is used to specify the search query whose result will be shown in the output of the second panel when we click on a respective event.
Thus, using the preceding set of code in XML, contextual drilldown can be implemented.
In this drilldown customization feature of Splunk Visualization, the field value having a URL can be used as a drilldown link. We will now see how to take a URL field value and configure drilldown to redirect users to that site.
Let's understand how to implement the URL field value drilldown using an example. Our search query is as follows:
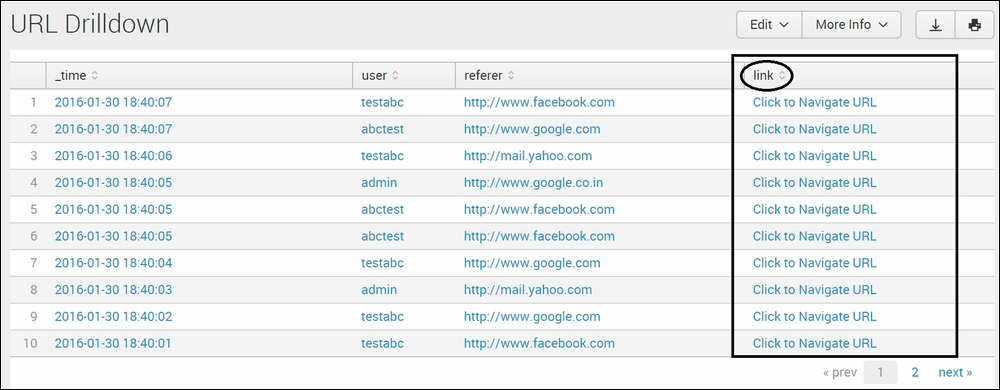
sourcetype=urldrilldown | table _time user referer link
The output of the search query is as follows:
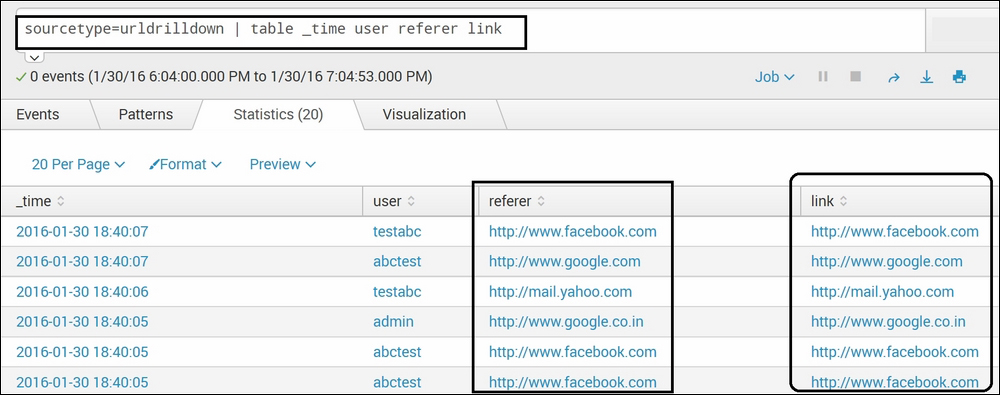
Now, we will customize the link field so that the drilldown on any link navigates to the respective URL that was clicked.
Create a new JavaScript file with the url_field.js name at $SPLUNK_HOMEetcapps<app_name>appserverstatic. The content of the JS file is as follows:
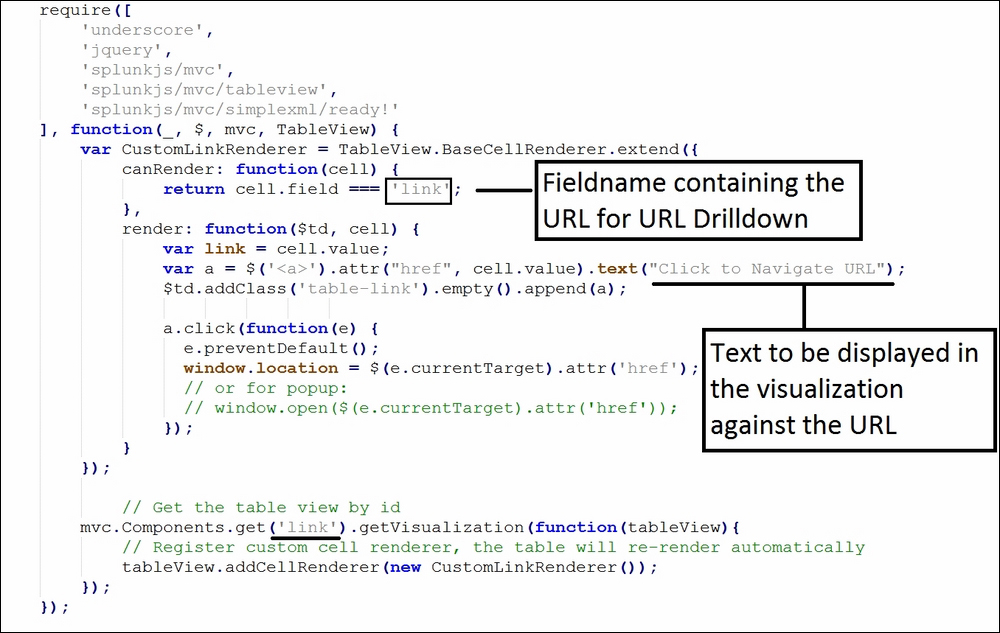
In the preceding JS file, for field name (link in our example) and the text (click to Navigate URL), which the user wants to be visible on, visualization needs to be modified and the rest of the code can be used as it is.
In the dashboard XML file, add a reference to the JS file, as follows:
<dashboard script="url_field.js ">
Also, add id to the table for a reference using the following code:
<table id="link">
The output after the preceding customization will be as follows; clicking on any value of the link field will navigate you to the search with the actual URL link:
There is no option by default for drilldown in single value visualization. You will now learn how to modify the XML of the panel holding a single value to link the other pages or run a search query to show events filtering the single value.
We will see how to add links for drilldown to the single value result, before the label, after the label, and under the label using XML customization.
The following code needs to be added in the XML panel that holds the single value:
<option name="drilldown">all</option>
The preceding code enables drilldown when we click on a single value result from the dashboard. Clicking on a single value navigates to the search screen with the search query used to derive the single value. This drilldown can be useful when comprehensive information or events are needed. Let's understand this with the help of an example. If the search query results in a number of errors, then drilldown customization can list down those errors.
The following code will be required to create a drilldown for Before Label, Under Label, and After Label:
- For Before Label, we need the following code:
<option name="linkFields">beforelabel</option>
- For After Label, we need this code:
<option name="linkFields">afterlabel</option>
- For Under Label, we need the following code:
<option name="linkFields">underlabel</option>
<option name="linkFields">result</option>
The following code can be used to see the result:
The following code will be required to specify any search query for linkFields (beforelabel, afterlabel, and underlabel). The search query can be specified as per the requirement and visualization/insights required:
<option name="linkSearch"> index=* | chart count by sourcetype
</option>