
Event pattern detection is a feature in Splunk which helps in increasing the speed of analytics by automatically grouping similar events to discover meaningful insight in the given machine data. It helps users to quickly discover relationship, patterns, and anomalies in the given data, to build meaningful analytics on top of it.
In simpler terms, event pattern detection not only helps to find out the common patterns in the data but also highlights those events which are rare and could be anomalies. The event pattern detection feature of Splunk can be helpful in the following ways:
- Auto discover meaningful patterns in the given dataset
- Search data without the need to know what to search for
- Detection of anomalies, rare events, and so on
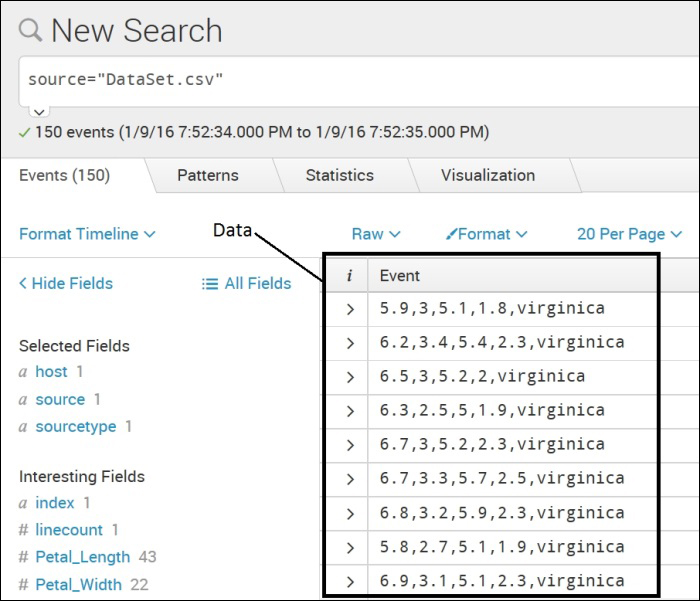
The following image shows a sample of data events when queried on Splunk. The sample data has mostly numbers in it, and if not much domain information is available about the data it would be difficult to get insight from it:
Now we will see how event pattern detection helps in getting quick insights from the preceding data. The following image shows the output of the Patterns tab for the preceding data:

The Patterns tab output shows that the total data shows three different patterns, and those are listed in the output. Looking at the preceding output image, it is clear that the data has information about three different species. There is a slider tool available, which when moved to the Larger side tries to return a greater number of patterns, and when moved toward the Smaller end returns a smaller number of events.
Basically, sliding toward the Larger side shows those results as well which have a low percentage of common patterns, which could be of no use, and similarly, sliding towards the Smaller side will return only those event patterns which have a very high percentage of common patterns. Thus the slider can be adjusted and the best suitable for the respective data can be defined.
Clicking on any identified pattern will display the detailed information about the pattern. The following image is a sample output of detailed pattern information:
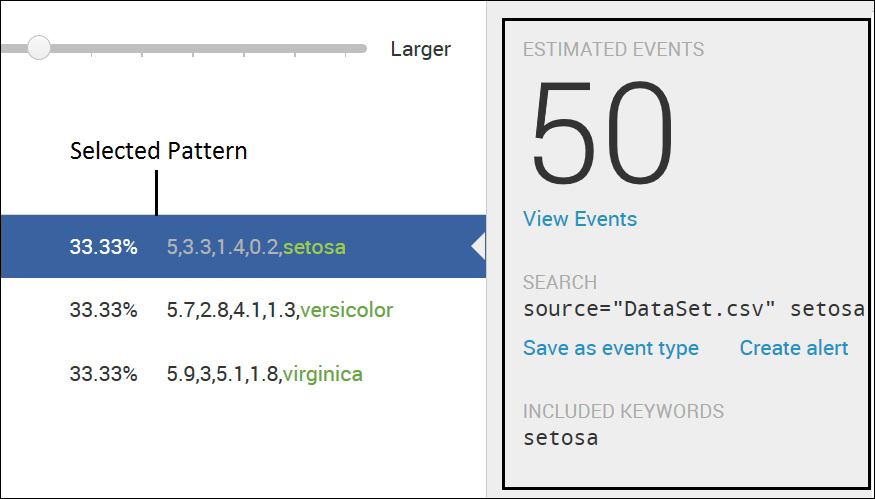
In the preceding example output, the first pattern (highlighted) is selected and information regarding the selected pattern is shown on the right-hand side. The information includes the following:
The detailed panel also has the option to do the following actions:
- View the events on which this pattern is shown.
- Create an alert so that when such a pattern is detected in future, it is notified.
- Save the entered search query as an event type for future classification and while using analytics over data having a similar pattern.
Thus, event pattern detection can be used to derive meaningful insights from the data quickly and automatically.