
In the previous chapter, you learned various important commands that can be used in Splunk over data. These Splunk commands provide data in a statistical format. Now, in this chapter, you will learn the details of the basic visualizations that can be used in Splunk to represent the data in an easy-to-understand format. You will learn data representation in terms of visualization and along with that, we will also go through how to tweak graphics as per the required format that is more understandable.
The following topics will be covered in this chapter:
- Tables
- Single value
- Charts
- Drilldown
The Splunk command usually opens the Statistics tab by default when we run Splunk search queries over the web console. The following are generic steps to be taken to view the respective visualization on the Splunk Web dashboard. When we run a search command on Splunk, the results are shown in the Statistics tab, as shown in the following screenshot:

Once the output is available and a statistical command is used in the search query, when we click on the Visualization tab, the default visualization will be visible, as shown in the following screenshot. The top-left option, Format, can be used to format of the visualization:

The respective visualization can be chosen from the visualization picker (marked with a rectangular box in the preceding screenshot), which is available at the top-left corner of the Visualization tab. The following screenshot shows the default visualization available in Splunk, and apart from the following visualization, custom and advanced visualization can also be added, which we will cover in the next chapter:

Now, since we are aware of how to choose different types of visualization, as shown in the preceding screenshot, we can start learning which visualization is used in which scenario.
The preceding visualization can be added to a dashboard panel so that we can access XML (eXtensible Markup Language) to customize the visualization in a more convenient and required format.
The following are the steps to add visualization as a dashboard panel:
- Run the Splunk search query so that the result is available in the "Statistical" or "Visualization" panel on the Splunk Web console.
- From the top-right corner, navigate to Save As | Dashboard Panel. A window similar to following one will pop up:

- Fill in all the details, such as Title, Description, and Content, and then click on Save.
- The next screen will take you to a dashboard, where the search panel with the output will already be available.
- To customize the panel with the prebuilt options, from the top-right corner Edit option choose the Edit Panels option. Then, all the respective panels' Searching, Formatting, and Visualization options can be configured.
- To customize a single panel or complete dashboard with the features that are not prebuilt in the option menu, we need to modify XML. XML can be changed by navigating to Edit | Edit Source:

- In the Source edit screen, for each row and for each panel in the dashboard, the search query and formatting options' code will be available. In the section, a new code can be added for the customization. Once the modification is done in the code, click on Save to see the changes in the result.
In order to make changes and access values in XML, respective tokens need to be defined and accessed from time to time. The following is the list of comprehensive tokens that can be used in XML of the Splunk dashboard to set or access corresponding values from the visualization:
$click.name$: This token will return the field name of the leftmost column of the clicked row$click.value$: This token will return the value of the leftmost column of the clicked row$click.name2$: This token will return the field name of the clicked row value$click.value2$: This token will return the value of the clicked row$row._time$: This token will return the valueholder by _time fieldof the clicked row$row.fieldname$: This token will return the value of the respective field name of the clicked row$earliest$: This token can be used to get the earliest time specified for the search query$latest$: This token can be used to get the latest time specified for the search query
The following screenshot illustrates a necessary example to understand the use of the preceding tokens. The sharp-cornered boxes are values of the round-cornered boxes (tokens):
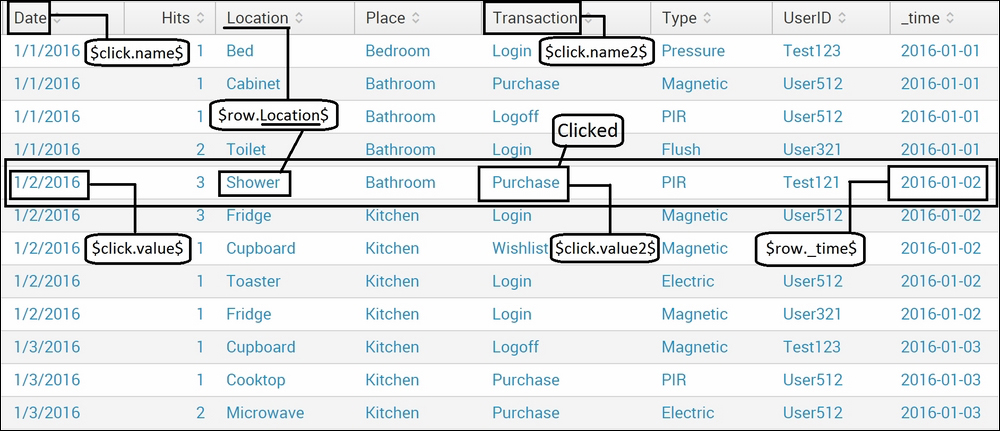
The following are the respective values of the token when the fifth row, Purchase (as marked in the preceding screenshot), is clicked as present in the Transaction field:
$click.name$: Date$click.value$: 1/2/2016$click.name2$: Transaction$click.value2$: Purchase$row._time$: 2016-01-02$row.Location$: Shower$row.Place$: Bathroom$row.Hits$: 3$row.Type$: PIR$row.UserID$: Test121