
31
THE DESIGN AND ECONOMICS OF LARGE‐SCALE CHROMATOGRAPHIC SEPARATIONS
Firoz D. Antia
Antisense Oligonucleotide Process Development and Manufacturing, Biogen Inc., Cambridge, MA, USA
31.1 INTRODUCTION
Chromatography (“color writing”) was the fanciful name given in 1906 by the botanist Mikhail Tswett to the adsorptive separation method he employed to separate plant pigments on columns of calcium carbonate using petroleum ether as the eluting solvent [1]. Chromatography is a differential migration process: components of a mixture that distribute differently between a particulate adsorbent and a fluid separate because they move at different rates through the fluid‐perfused1 adsorbent bed. If conditions are chosen correctly, the individual species in the mixture emerge at the outlet of the chromatographic column in pure bands. The broad array of sorbent and fluid combinations available today make chromatography a versatile and widely applied analytical and preparative purification tool at the laboratory, pilot, or industrial scale for virtually any class of pharmaceutical compound, particularly when gentle, but nonetheless highly selective, separation conditions are required. Chromatography is an enabling technology in biotechnology – practically all industrial biopharmaceutical purification processes contain one or more chromatography steps. While employed less frequently in small molecule drug (API) manufacturing processes, it is nevertheless heavily used in early stages of API development and does find important industrial applications in natural product and chiral separations. In addition, it is indispensable for the large‐scale purification of synthetic peptides and oligonucleotides. In this chapter, the focus is on chromatography as it is practiced in the purification of chemically derived compounds.
Chromatography is considered by many to be an expensive step, a useful tool to obtain from milligrams to a few hundred grams of intermediates or drug substances for deliveries early in development, but ultimately a step that must be superseded in favor of more cost‐effective methods (extractions and crystallizations or improved synthesis routes) before commercialization of the process. However, done properly, chromatography is economically competitive; indeed, with modern equipment, method optimization, and solvent‐sparing technologies – including solvent recycling and continuous multicolumn chromatography (MCC) techniques – chromatography can be both effective and efficient for industrial‐scale purifications.
This chapter will begin with an outline of the key design elements in chromatography and a discussion on fundamental chromatographic relationships such as retention and selectivity. The various available chromatographic chemistries will then be discussed. This will be followed by brief sections on chromatographic operating parameters, the choice of the mode of operation including multicolumn systems, choice of equipment, scale‐up, a short section on parametric design space, and a discussion on chromatographic economics.
31.2 KEY DESIGN ELEMENTS
Choice of the combination of the adsorbent (also known as chromatographic media or the stationary phase) and the fluid (or mobile phase) is the first design element in chromatography. This choice sets the chromatographic “chemistry”, dictating the type of physicochemical interactions that take place within the system as well as the means to manipulate their intensity to achieve the desired separation goals. Many types of adsorbents with a wide array of surface chemistries are available today, and several are prepared with large‐scale applications in mind, i.e. they are manufactured under controlled conditions in large batch sizes. The mobile phase, an aqueous or solvent‐based mixture that could also contain other components such as acids, bases, buffers, or salts, is selected to be compatible with the adsorbent and acts to mediate adsorption and release of the separating species from the stationary phase. Manipulation of the mobile phase composition is the primary means to control retentivity (a measure of the strength of adsorption of the separating species on the adsorbent) and obtain selectivity (a measure of the difference in retentivities of separating species, which is the key to affecting the desired separation). Solubility of the separating species in the mobile phase is also an important consideration; high solubility is desirable to achieve high productivity. A classification of the various adsorbents and compatible mobile phases based on the underlying physicochemical factors governing retention is provided in Section 31.4.
Another important design element is the choice of operating mode. Most chromatographic separations are carried out in the elution mode, where the separating species move through the system in the presence of all components of the mobile phase. However, there are other means to carry out chromatography. In the displacement mode, a mobile phase component known as the displacer (introduced after the feed) binds tightly to the adsorbent, swamping available binding sites so that the separating species move ahead of it. Continuous chromatographic techniques are operating modes in their own right; simulated moving bed (SMB) chromatography and the multicolumn solvent gradient process (MCSGP) have become more popular in recent years as applications for large‐scale chromatographic processes increase. These are discussed in more detail in Section 31.5.
Once the choice of media and operating mode is determined, the chromatographic process is defined by its operating parameters such as the column dimensions, the adsorbent particle size, mobile phase flow rate, the operating temperature, and other factors pertinent to the operating mode (e.g. cycle and column switching times in SMB systems). The outcome of varying these operating parameters forms the basis for process and economic optimization as well as the regulatory design space for a chromatographic process. Operating parameters and design space are also discussed later in this chapter.
31.3 FUNDAMENTAL CHROMATOGRAPHIC RELATIONSHIPS
31.3.1 Chromatographic Velocity
Chromatographic operations take place in a column packed with particles. The volume fraction of the interstitial space between the particles in a randomly packed bed, or the interstitial porosity, εe, typically has a value of about 0.4. The totally porous sorbent particles commonly used in chromatographic applications often have an internal void fraction, εi, of approximately 50%, so that the packed bed has a total porosity, εT (= εe + (1 − εe)εi), of roughly 0.7. For a fluid flow rate F in a bed of cross‐sectional area A, three flow velocities2 may be defined and are related as follows:
where
- us is the superficial velocity.
- ue is the interstitial velocity.
- u0, the average velocity of an unretained molecule that explores the entire void space, is the chromatographic velocity.
For modeling purposes, it is assumed that the mobile phase migrates through the system at the chromatographic velocity.3
31.3.2 Operating Pressure
Chromatographic operations are mostly carried out at a fixed velocity or flow rate. The pressure drop, ΔP, across a packed column is related to the chromatographic velocity, u0; the column length, L; the adsorbent particle diameter, dp; and the mobile phase viscosity, η, via Darcy's law as
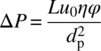
where the factor φ is a proportionality factor related to porosity given by the Kozeny–Carman equation

For the typical values of the porosities given above, this factor has a numerical value of approximately 710, while in practice it may vary from 600 to 1000 depending on the exact porosities, as well as the regularity and roughness of the particles. In the equation above the variables can be expressed in any consistent units; the equation is also consistent without the need to add correcting factors if the pressure drop is expressed in bars, the velocity in centimeters per second, the column length in centimeters, the particle size in microns, and the viscosity in centipoise.
31.3.3 Mass Balance Equation
A differential one‐dimensional mass balance for a retained species in a chromatographic system can be written in simplified form as
where
- the parameters t and x are time and distance along the column, respectively.
- c is the concentration of the species in the mobile phase.
- q is its concentration in the stationary phase.
- ϕ is the ratio of stationary to mobile phase volumes (i.e. (1 − εT)/εT).
In this simplified view, all dispersive effects including molecular diffusion, transport of the species to and within the particle, and any dispersive influence of slow adsorption kinetics are lumped into the effective dispersion coefficient, De.
31.3.4 Retention and Retention Factor
A system of mass balance equations (one for each migrating species), with suitable initial and boundary conditions, serves as an adequate model for chromatography [2]. The adsorbed concentration q is related to the mobile phase concentration c via an equilibrium relationship known as the adsorption isotherm. In general (and particularly in the case of preparative chromatography that is carried out at high concentrations of the migrating species), the adsorption of each species depends not only on its own concentration in the mobile phase but also on that of all the other species present. Consequently, migration through the system is concentration dependent; the system of equations is nonlinear and must be solved numerically. On the other hand, at low concentrations it can be assumed that the distribution coefficient (K = q/c) for each species is an independent constant. In this circumstance, in an ideal system without dispersion, the mass balance equation reduces to

This is a one‐dimensional wave equation with propagation velocity – or the migration velocity of a species through the system – of u = u0/(1 + ϕK). The product ϕK is known as the retention factor, k′. Despite being defined only at low concentrations in limited circumstances, k′ is a key factor in the understanding and characterization of chromatographic behavior.
Conditions where the distribution coefficient K of each migrating species is independent of concentration (the Henry's law region) are known as “linear” (or “analytical” conditions, as these are conditions under which chromatographic analyses are carried out). A system in which the mobile phase composition is kept constant over time is termed “isocratic.” In a linear isocratic system, if the mixture to be separated is injected to approximate a δ‐function, the retention factor k′ of each separating species can be determined from its retention time, tR (the time of elution of the center of gravity of the migrating component), and the dwell time, t0 (the time of elution of an unretained component), as follows [3]:

(VR and V0 are the corresponding elution and dwell volumes: VR = FtR, where F is the mobile phase flow rate, and V0 = Ft0 = εTVC, where VC is the total column volume (CV).)
The distribution coefficient K is a thermodynamic property, related to the free energy of adsorption, and as a result k′ is a function of temperature via the relationship [3]
where
- ΔH and ΔS are the enthalpy and entropy of adsorption.
- T is the temperature in degrees Kelvin.
- R is the universal gas constant.
Values of k′ can increase or decrease with increasing temperature depending on the sign of the enthalpy of adsorption; in most instances, the latter is true as adsorption is often enthalpically favored (i.e. ΔH is negative), but there are important exceptions, such as in hydrophobic interaction chromatography (HIC) of proteins and in other individual cases, where the opposite can hold.
31.3.5 Selectivity
The power of a chromatographic system to discriminate between two species is quantified by the ratio of their retention factors, termed the “selectivity,” α (= ![]() /
/![]() , where the subscripts refer to the two species and
, where the subscripts refer to the two species and ![]() >
> ![]() , so that α > 1). The type of system chemistry, the mobile phase composition, and the temperature are major factors that influence selectivity. In industrial applications, concentrations are usually high, so Henry's law no longer applies, and distribution coefficients as well as selectivities are nonlinear functions of the concentration of all the locally present separating species. Nonetheless, the first step in designing a chromatographic separation is to operate in Henry's law regime to find conditions (i.e. the right stationary and mobile phase composition) that maximize selectivity. To achieve this, one must understand how retention and selectivity can be manipulated in the context of the various chromatographic chemistries. A discussion on some of the more popular chemistries is given in the next section.
, so that α > 1). The type of system chemistry, the mobile phase composition, and the temperature are major factors that influence selectivity. In industrial applications, concentrations are usually high, so Henry's law no longer applies, and distribution coefficients as well as selectivities are nonlinear functions of the concentration of all the locally present separating species. Nonetheless, the first step in designing a chromatographic separation is to operate in Henry's law regime to find conditions (i.e. the right stationary and mobile phase composition) that maximize selectivity. To achieve this, one must understand how retention and selectivity can be manipulated in the context of the various chromatographic chemistries. A discussion on some of the more popular chemistries is given in the next section.
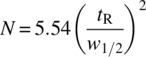
31.3.6 Efficiency
During chromatography, dispersive effects counteract the effectiveness of the separation; chromatographic efficiency thus increases when dispersion is decreased. Contributions to dispersion arise from flow anastomosis, molecular dispersion, transport in and out of the particle, and slow adsorption kinetics. Efficiency is characterized by the so‐called plate number, N, a concept that arises from a model that treats the chromatography column as a series of stirred cells containing equal amounts of stationary phase. Based on this model applied in Henry's law adsorption regime, the plate number is related to the width of a chromatographic peak4 by the relationship [3]
The plate number is related to the lumped dispersion coefficient in Eq. (31.4) as follows [4]:
The larger the number of plates, the more closely the system approximates plug flow, and the more efficient it is.
The height equivalent of a theoretical plate, H (=L/N), is a related measure of the efficiency. The plate height is a function of the particle size and flow velocity, as elucidated first by van Deemter and his colleagues [5]:
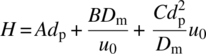
Here A, B, and C are constants, with typical numerical values of about 1.5, 0.8, and 0.3, respectively [6], and Dm is the molecular diffusivity of the separating species in the mobile phase. The first (or A) term of this equation is independent of flow rate and arises from flow nonuniformity within the packed bed. The second (or B) term is a result of molecular dispersion and rapidly becomes insignificant as flow velocity increases. The third (or C) term is a consequence of diffusion of the separating molecule in and out of the stagnant fluid within the particle pore space. It increases linearly with flow rate and is usually the most significant factor related to bandspreading. Contributing factors to the plate height, such as diffusion through the boundary layer around the particle and the effect of slow adsorption kinetics, are usually of less import and have thus been ignored in the simplified equation presented above.
The van Deemter equation can be written in dimensionless form by introducing into it the reduced plate height, h (= H/dp), and the reduced velocity, ν (= u0dp/Dm), so that
Figure 31.1 shows the van Deemter curve and indicates the approximate practical range for the reduced plate height for small molecules (of 15–80, assuming diffusivities in the 2–5 × 10⁻⁶ cm2/s range, flow velocities from 0.1 to 0.3 cm/s, and a 10 μm particle diameter). With similar flow velocities and particle size, peptides and oligonucleotides have a higher reduced velocity range because of their lower molecular diffusivities. In practice, therefore, the B term reduces to zero, and bandspreading is dominated by the effect of diffusion through the sorbent particle.5

FIGURE 31.1 Van Deemter plot of reduced plate height versus reduced velocity showing typical operating regimes for small molecules and peptides as described in the text.
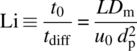
With diffusion through the particle as the major contributing factor to the plate height (and thus to N), another useful scaling factor related to efficiency, termed the Lightfoot number, Li, can be constructed by taking the ratio of the characteristic diffusion time across a particle (tdiff = ![]() /Dm) and the dwell time in the system (t0 = L/u0) so that
/Dm) and the dwell time in the system (t0 = L/u0) so that
31.3.7 Operation at High Concentration
As mentioned earlier, at high concentration Henry's law no longer applies, and the adsorption isotherm of each species is generally a nonlinear function of the concentration of all the species present. Migration of the components under these conditions is concentration dependent.
While there are many possible forms of the adsorption isotherm depending on the molecular properties of the adsorbing species, the mobile phase and the sorbent, in many cases the sorbent has a finite maximum capacity for the adsorbing species. In this situation, compounds vie for a limited number of sites on the sorbent and adsorption is competitive. At elevated concentrations then, relatively fewer sites are available, and the slope of the adsorption isotherm decreases, implying that higher concentrations migrate faster. In this circumstance, the low concentration at the leading edge of a concentration front moves more slowly than the high concentration of its trailing edge; this leads to a self‐sharpening effect, countering the dilutive effect of dispersion and leading to a sharp shock wave. The opposite is true for the rear, producing a long dilutive tail. Peaks that at low concentration appear symmetrical become triangle shaped at higher concentrations. This effect is illustrated in Figure 31.2. In multicomponent systems, which are of more interest in practice, strongly bound compounds displace and thus suppress the binding of weakly adsorbed species. Under the right conditions in a chromatographic system, this results in weakly bound components being pushed ahead of strongly bound ones; as a result some concentration of the early eluting species can occur. This “displacement effect” is beneficial if an early eluting component is the target of the purification. Unfortunately, competitive adsorption also leads to a perverse “tag‐along” effect: weakly bound components act to suppress the binding of strongly bound components, accelerating their motion and dragging them ahead, reducing the extent of separation. The effect is shown for two components eluting individually and together in Figure 31.3.

FIGURE 31.2 Schematic showing overlaid elution profiles resulting from injections of increasing concentration of a single species when adsorption is competitive. The elution profiles appear as a series of nested near‐triangular shapes, with sharp fronts and extended tails. The end of each tail coincides with the retention time of the species at infinite dilution.

FIGURE 31.3 Schematic showing elution profiles of separate injections of two species A and B and of a mixture of A and B. In the mixed injection, the peak shape of each species is altered by the presence of the other: A is compressed and concentrated by the displacement effect, and the front end of B elutes a little earlier than in the single component case because of the tag‐along effect.
It is worth noting that not all systems display competitive binding and the displacement and tag‐along effects are by no means universal. Some systems display cooperative binding, the chromatographic effects of which are the inverse of those discussed above. Some systems show a combination of these types of binding, and the resulting peak shapes in preparative chromatography can be quite complex.
One practical consequence of operating at high concentration is that the neat symmetric separated peaks seen in analytical separations disappear. Nonspecific detection at the end of the column (usually by UV light absorption) often shows an undifferentiated blob. Once properly characterized, such detection can still be used to govern collection of pure fractions, but in early stages of process development, there is no substitute for collecting multiple fractions of the emerging eluent stream and analyzing these to understand how well the separation has progressed.
31.3.8 Load
The load on a column is the quantity of feed, expressed conveniently either as total solids or as the amount of the desired product in the feed mixture, introduced into the system per injection. A dimensionless load parameter, Γ, can be defined as the column load divided by the mass of sorbent, and this can be used as a scaling factor in conjunction with the plate number, as discussed later.
31.4 CHROMATOGRAPHIC ADSORBENT CHEMISTRIES AND BASIS OF RETENTION
31.4.1 Normal‐Phase Chromatography
“Normal‐phase” chromatography implies use of a polar stationary phase, usually unmodified porous macroreticular silica, with an organic solvent blend as the mobile phase. Mobile‐phase solvents covering the spectrum from the very nonpolar (heptane) to the very polar (methanol) are used. The silica surface is populated with silanol groups with a distribution of activities that depend on their structure [7], and water can bind strongly at the most polar sites. As a consequence, minor fluctuations in the water content of nominally dry solvents can have a profound effect on retention. Deliberate addition of some water (usually about 0.5% by volume, although higher amounts up to 7% have also been used) [8, 9] to the mobile phase can provide uniformity and quell variations in retention.
Retention is manipulated by changing the mobile‐phase blend; addition of polar solvents generally decreases retentivity. Good guides to selection of solvents to maximize selectivity are available [10]. Solvents used have been grouped according to their electron donor, electron acceptor, and dipole properties, and blends of solvents with broadly different properties often lead to the best selectivity. Selection of the appropriate solvent blend can be assisted by the use of thin‐layer chromatography (TLC) on silica‐coated plates, which are in common use in organic chemistry labs. Translation from TLC to column chromatography may require some reduction in the proportion of the most polar component of the blend to increase retentivity.6
In normal‐phase chromatography with bare silica as the stationary phase, the layer of solvent closest to the silica surface has a different composition from the bulk. Equilibration of the surface layer upon changes in the bulk takes time, presumably because of the heterogeneity of active sites on the silica surface. As a result, most normal‐phase separations on silica are carried out isocratically (i.e. without changing the solvent composition during the chromatography).
Since many molecules of interest are very soluble in organic solvents and because silica is relatively inexpensive and has high adsorptive capacity, normal‐phase chromatographic processes can be run at high concentrations, resulting in productive and cost‐effective separations. On the other hand, the surface energy of bare silica can be influenced by many factors (trace metals, for instance), and a normal‐phase system can suffer from variability for a variety of reasons, including variations in silica manufacturing or fluctuations in the crude feedstock that may contain components that bind practically irreversibly to the silica and can slowly change the character of the surface. Bonded phases with more homogenous surfaces are available that reduce or eliminate these sensitivities, and these can also be used in a gradient mode (i.e. where the composition of the mobile phase is changed during the chromatographic run). Phases with diol and amino functions are available that have niche applications (for instance, for separation of molecules containing polyols) with selectivities that differ considerably from bare silica. Bonding chemistry adds to the cost of the adsorbent, but this may be offset by a longer column lifetime under the right conditions.
31.4.2 Reversed‐Phase Chromatography
“Reversed‐phase” chromatography is carried out with nonpolar stationary phases using a mixture of water with a miscible solvent as the mobile phase (the polarity of the system is reversed compared with the “normal” phase described above). Molecules separate from each other based on their hydrophobicity; more hydrophobic species are more highly retained. Porous macroreticular silica‐based stationary phases whose surfaces have been modified by bonding an alkyl group, such as octadecyl(C18), octyl(C8), or butyl(C4), are most commonly used, although a wide variety of others, including macroreticular polymer‐based adsorbents, are available. Commonly employed water‐miscible solvents used in the mobile phase are acetonitrile, methanol, ethanol, isopropanol, and, more rarely, tetrahydrofuran. Mobile phases are often buffered or acidified to influence retention of ionizable species. Organic or inorganic acids (e.g. acetic, trifluoroacetic, methanesulfonic, phosphoric acids) can interact with basic groups on the separating species, forming ion pairs and altering their hydrophobicity, and simultaneously suppress ionization of residual (unbonded) silanols on the stationary phase surface, reducing ionic interactions. For separation of ionizable species, manipulation of the nature of the ion‐pairing agent and the pH can have a profound effect on selectivity.
For a given pH and ion‐pairing agent, the retention factor in reversed‐phase chromatography decreases with the increasing volume percent of miscible organic solvent in the mobile phase, ψ. In such a system, the relationship between k′ and ψ can be adequately described over a broad range of ψ by the expression
where
-
 is the retention factor extrapolated to zero organic content.
The slope of the plot, S, correlates roughly with molecular weight, large molecular weight species having larger S values, although there is often considerable variation for species with similar molecular weight. The relationship breaks down at high organic content, where retention can sometimes increase with increasing ψ. Figure 31.4 shows the k′ vs. ψ relationship for several compounds in a hypothetical mixture.
FIGURE 31.4 Plots of retention factor of various components of a mixture versus the organic solvent volume percentage in the mobile phase in a reversed‐phase chromatography system, where there is typically a straight‐line relationship between log k′ and ψ.
Reversed phase is the most widely used form of chromatography on an analytical scale and is also used extensively in industrial applications. Practically every peptide manufacturing process, for instance, includes a reversed‐phase chromatography step. Reversed‐phase chromatography has also been used successfully for oligonucleotide separations [11]. Here polymer adsorbents find favor over silica‐based bonded phases, since the latter are unstable at high pH that can be encountered in feed streams or in the eluents employed.
31.4.3 Chiral Chromatography
Perhaps the most important development in the field of chromatography over the past 25 years has been the introduction of stationary phases with chiral selectivity. Such phases have seen increasing use on an industrial scale for the separation of enantiomers, providing an alternative to stereoselective synthesis or classical resolution techniques. The phases contain a chiral selector (for instance, substituted cellulose or amylose) bonded or coated onto a chromatographic particle (usually porous macroreticular silica). A broad variety of chiral stationary phases (CSPs) are available utilizing different selectors, and these can be operated in either the reversed‐phase or normal‐phase modes, depending on their design and solvent compatibility. Choice of the best phase for an application is typically a process of screening a broad range of CSPs under analytical conditions for the ones with the best selectivity. Since selective adsorption capacity can be limited on CSPs, it is worth choosing a few different CSPs to see which one works best under the higher concentration conditions intended for the application.
CSPs are expensive relative to normal‐ or reversed‐phase sorbents, and separation design efforts often focus on minimizing the amount of stationary phase. In chiral separation applications, the intent usually is to separate enantiomers; the presence of other impurities is incidental. For this reason, SMB chromatography and related multicolumn technologies, which are ideally suited to binary separations, have seen increasing use in the pharmaceutical industry.
31.4.4 Other Chemistries
While most applications of large‐scale chromatography for separation of small molecules employ the types of phases discussed above, other types of chemistries are also sometimes employed. Notable among these are phases containing weak or strong anionic or cationic ionized groups bonded on macroreticular silica or polymeric particles, commonly referred to as ion‐exchange or electrostatic interaction phases. These are usually operated with aqueous or hydro‐organic mobile phases containing salt and buffers for pH control. Salt screens electrostatic interactions, so retention on these phases decreases with increasing mobile‐phase salt content. pH affects ionization of the separating molecules as well as the ionizable groups on the stationary phase surface and is thus a useful means to manipulate retention. Ion‐exchange chromatography is used widely for separation of large molecules like proteins and antibodies but is also used for synthetic peptide and oligonucleotide purifications.
Hydrophilic interaction chromatography (HILIC) uses polar stationary phases and water‐miscible solvents; retention increases with increasing polarity, and increases in the water content of the mobile phase result in a decrease in retention. Other types of chemistries, such as those used for hydrophobic interaction chromatography (HIC), where weakly hydrophobic surfaces and high mobile phase salt concentrations are employed, or for size exclusion chromatography (SEC), where molecules are not retained but separate based on molecular size, are largely confined to large molecule separations. However, HIC has recently found use in separation of synthetic oligonucleotides [12].
31.5 OPERATIONAL ASPECTS
31.5.1 Chromatographic Applications
Chromatographic systems can be used in several ways in a chemical process. One simple application is for removal of impurities – a process stream is run through a chromatographic column, and one or more impurities are adsorbed on the bed. Once the bed is saturated, it is either discarded or regenerated, re‐equilibrated, and returned to use. This requires conditions where the impurities are tightly bound and the product is minimally affected by the sorbent. Conditions for this simple operation can often be found if the product and the impurities are not very closely related, separating neutral impurities from a charged product, for instance.
Another application is the inverse operation; a dilute process stream is run through a chromatographic column to capture the product. The product is then desorbed in a concentrated form with a suitable eluent. For example, a clarified aqueous fermentation broth may be run through a reversed‐phase system to capture the product, which is then eluted in concentrated form with methanol.
A chromatographic system is a convenient tool for carrying out certain solvent switches. For example, in order to change the product solvent from aqueous acetonitrile to methanol, the product could be captured on a reversed‐phase column. This may require dilution of the stream with water to create strong binding conditions for the product. The column could then be washed with dilute aqueous methanol (maintaining binding conditions) to remove acetonitrile, and the product can then be eluted in methanol. A similar product capture/wash/elute approach can also be used to desalt a process stream. Yet another variation is the use of a reversed‐phase system to affect a counterion switch, an approach often used after the purification of peptides. For example, a peptide purified by reversed‐phase chromatography using trifluoroacetic acid (TFA) as the ion‐pairing agent (often a good choice to obtain selectivity for reversed‐phase separation, but usually not desired in the final product) can be switched to another counterion form, say, acetate, by a) capturing it (after suitable aqueous dilution) on a reversed‐phase column, b) washing under binding conditions with streams containing first ammonium acetate to remove the TFA and then acetic acid to wash away excess ammonium ion, and finally c) eluting the peptide by increasing the organic solvent content of the acetic acid‐containing mobile phase.
By far the most useful application of chromatography, of course, is the purification of a product from closely related impurities; for instance, a desired peptide from a dozen or more synthesis impurities, some with differences as subtle as, say, a β‐aspartic acid substituted for aspartic acid in the original sequence, resulting in an isomer with an extra methylene group in the peptide backbone. The following operational modes are employed for such applications.
31.5.2 Elution Chromatography
Elution is the most familiar mode of operation for chromatography: species migrate through the column and separate in the presence of a mobile phase that directly mediates retention. When the mobile phase composition is held unchanged, this is known as “isocratic” elution. When the mobile phase composition is varied during the migration, this is known as “gradient” elution.
The motivation for changing the mobile phase composition in a gradient elution process lies in the potentially wide range of retentivities of all the components in the mixture to be separated. An increase in the strength of the mobile phase over time ensures that the most strongly retained component will elute off the column within a practicable time period. The difference between operating under isocratic and gradient conditions in a reversed‐phase system can be understood by examining the lnk′ vs. ψ plot in Figure 31.4. For a successful isocratic operation, a single solvent strength must be selected that affords selectivity between the desired compound and the other components of the mixture and also enables elution within a reasonable time frame. For instance, operating at 32 v% organic, the first and last components to elute would have k′ of about 3 and 23, respectively. A gradient in solvent strength would hasten the elution of the more strongly absorbed compounds.
Gradients are most commonly either linear or stepwise, and they are usually formed by blending two streams, changing the blend composition appropriately over time. Some equipment allows formation of ternary gradients or gradients with convex or concave shapes, but this is not recommended if transfer between different brands of equipment is anticipated.
When the mobile phase strength increases over time, the front and rear of a migrating peak are often in different solvent environments, so that retention is lower at the rear of the peak than the front. This results in a peak “compression” that acts counter to and somewhat mitigates the dilution that is always observed under isocratic conditions. Reducing dilution can have significant impact on solvent volumes and processing of the collected purified material.
31.5.3 Displacement Chromatography
Under conditions of competitive binding and at high column loads, the displacement effect mentioned earlier leads to concentration of early eluting, weakly bound species displaced by more strongly bound components. Displacement chromatography, introduced in 1940s by Tiselius [13] and developed further in more recent years by the academic groups of Horváth [14] and Cramer [15], among others, exploits this effect to the fullest extent possible. A mixture introduced into the column under strong binding conditions (e.g. low salt content in an ion‐exchange system, where k′ is high) is pushed through the column not by the customary means of changing the eluent strength, but by introducing a solution containing a species that is more strongly bound than any of the mixture components. This component is called the displacer. Velocity of the displacer front can be manipulated by adjusting its concentration. The displacer swamps the binding sites on the sorbent, acting almost like a piston to drive the other species ahead of it. The mixture species, concentrated and moved forward by the action of the displacer, then act to displace each other in order of binding strength, until – after development of the displacement train over a sufficient column length – they separate into contiguous concentrated bands of individual components. The displacer does not mix with the separating components except by dispersion at the end of the separation train. The displacer must be removed from the column before it can be reused. This can be accomplished by changing the eluent strength or other conditions such as the pH to facilitate washing the displacer from the column.
This mode of separation is ideally suited for economical preparative separations, since it perforce runs at high concentration and makes efficient use of the capacity of the stationary phase. However, relatively few displacement separations have been implemented. One reason may be that development of a displacement separation is often time consuming and can require expert attention. Some headway in widening the use of this technique is being made, particularly in ion‐exchange chromatography applications [16].
31.5.4 Multicolumn Chromatography
It has long been recognized by chemical engineers that the most effective mass transfer between two phases takes place when they are contacted in a continuous, countercurrent manner. In a chromatographic system with a particulate solid sorbent, actual movement of the solid would disrupt the packing structure, negating any potential efficiency gains. Nevertheless, many of the benefits of countercurrent solid motion can be achieved by simulating the solid motion by appropriately switching inlet and outlet positions in a multicolumn system. When the inlet and outlet ports are simultaneously switched in the direction of fluid flow, as shown in Figure 31.5, the sorbent appears to flow in the opposite direction. SMB units of this kind have been used in multiton industrial operations such as the purification of p‐xylene from C8 fractions since the early 1960s, with installed capacity exceeding 107 tons/year [17]. More recently, SMB and related MCC technologies have been increasingly employed in pharmaceutical applications.

FIGURE 31.5 The four‐zone simulated moving bed (SMB) chromatograph. The top drawing shows a schematic of the four‐zone moving bed – dark arrows show the desired direction of solid flow. The bottom drawing show how simulation of the solid movement is carried out in a 12‐column system with 3 columns in each zone. The position of each of the external flow switches by one column after each switching period Δt. Flow within the column ring is driven by a pump.
The configuration shown in Figure 31.5 shows two inlet streams (one for the feed mixture, the other for the eluent) and two outlet streams (one for the separated early eluting compound(s), known as the raffinate, and the other for the separated late eluting compound(s), known as the extract). The system has four zones, two separation zones on either side of the feed inlet, a solvent recycle zone that strips the early eluting compound from the solvent, sending it toward the raffinate, and a sorbent recycle zone that strips the late eluting compound from the sorbent, sending it toward the extract. The presence of two outlet streams makes the technique naturally suited to binary separations, and unsurprisingly in the pharmaceutical arena, SMB technology is used most widely for enantiomer purification. There are three major operating advantages over conventional chromatography: (i) the stationary phase is used to maximum capacity, minimizing sorbent requirements; (ii) operation can be adjusted to obtain close to quantitative yields at the targeted purity, minimizing loss of precious product; and (iii) internal recycle of the solvent minimizes the solvent consumption [18].
Various efficiency modifications have been introduced into the repertoire of multicolumn operations. A process employing asynchronous column switching, known as “Varicol,” enables the assignment of a fractional part of a physical column to a given separation zone, reducing the number of columns required and thus the column hardware needed. Appropriately timed flow rate changes within a switching period (termed “power feed”) have also led to significant improvement in MCC efficiency [19, 20]. A “multicolumn countercurrent solvent gradient purification (MCSGP)” process [21] has also been introduced that can carry out multicomponent separations employing mobile phase gradients. This process can employ as few as two columns in a semicontinuous countercurrent operation that in principle could be adapted to work for any existing gradient elution separation. The major advantage of the process is that the semicontinuous operation enables near quantitative yield of the desired compound at the target purity [22]. Unlike the more traditional four‐zone binary systems, the MCGSP does not afford significant solvent savings. Nevertheless, yield considerations can be a sufficient driver to implement such a scheme.
Many of the advantages of the SMB can also be realized using a single or dual column multi‐injection steady recycle process invented by Charles Grill in the mid‐1990s [23]. This process has now been commercialized [24].
31.6 EQUIPMENT
31.6.1 Columns
Until the introduction of large‐scale high performance chromatographic equipment in the 1980s, industrial chromatographic separations were carried out in large columns packed with metric ton quantities of relatively large sorbent particles (c. 100 μ diameter or larger). One consequence of large particle size was the need for significant column lengths (several meters) to achieve separations. Poor distribution in such columns created inlet and outlet flow development zones, creating serious inefficiencies and making column aspect ratio an important factor in scale‐up. Modern high performance columns, now available from several vendors, have excellent flow distributors, so that performance is virtually independent of column diameter. Sorbent particle diameters used today are usually between 10 and 20 μm. While these provide high efficiency so that column lengths of less than 1 m (and usually ≪50 cm) are sufficient for many separations, they demand proper packing techniques and relatively high operating pressure of up to about 100 bar. One technology that has solved these issues and so has dominated the large‐scale column market is the so‐called dynamic axial compression (DAC) column. A hydraulic piston inside the column is used initially to compress a slurry of sorbent particles into a firmly packed bed, and pressure is maintained on the bed during column operation, ensuring that any holes or pockets that may arise from bed subsidence over time are eliminated, ensuring efficient long‐term operation. It is not unusual with for a DAC column of 1 m diameter to show the same efficiency as an analytical column packed with the same sorbent. This makes scale‐up facile, as the only scaling parameter is then the cross‐sectional area of the column. Figure 31.6 shows an example of a large‐scale DAC column. The tall gray assembly is part of the hydraulic system that transmits pressure to the column piston. For unpacking, the bottom flange of the column is opened and the piston is driven downward to force the sorbent out. Column packing and unpacking of the few tens of kilos of sorbent is thus straightforward, taking only a few hours (including all preparation time) in an industrial setting.

FIGURE 31.6 A 1 m internal diameter dynamic axial compression column for large‐scale high performance liquid chromatography. The gray cylinder above the column is part of the hydraulic system to maintain pressure on the piston during packing an operation. Components of the piston assembly are seen in the foreground.
Photograph courtesy of Novasep Inc.
31.6.2 Pumps, Detectors, and Controllers
High performance chromatography requires pumping of the mobile phase at a fixed flow rate through the system at pressures up to 100 bar. Industrial chromatography pumping systems almost universally employ double (or sandwich) diaphragm positive displacement pumps. The two‐diaphragm design assures that failure of a single diaphragm will not contaminate the process side with oil or fluid from the pump. Continuous monitoring of the space between the diaphragms for rupture provides assurance that any failure will be detected immediately.
It is advisable to use separate pumps for feed and mobile‐phase streams, although some pumping designs use the same pump for both.
A common feature in pumping system designs is a gradient forming system that enables blending of two (or more) inlet streams to vary mobile phase composition for gradient elution operation. Valves and mass flow meters along with electronic controllers are often used to achieve the gradient. Gradient composition monitoring and control using PAT systems, such as near‐IR probes with feedback control, are available commercially.
The effluent stream is usually monitored by a detector; signals from the detector can be used to decide when to collect fractions. The most commonly employed detector is the variable wavelength UV detector, although a plethora of others (conductivity detectors, for instance) can be used depending on the application. Some systems take a small slipstream to pass through a detector; others use a full‐flow detector cell. Under the high concentration conditions typical in preparative chromatography, it is common for the UV absorption signal to saturate at the wavelengths and cell path lengths commonly used in analytical chromatography. Often sensitivity needs to be dampened to properly capture the emerging peak and make useful fraction collection decisions. One simple way to accomplish this in practice is to use a UV wavelength far from the absorption maxima of the compound.
Fraction collection is accomplished by directing flow to different collecting vessels. Decision making on fraction collection can be triggered by the detector signal. As mentioned earlier, UV signals from industrial chromatographs do not look quite as simple as those in analytical systems, so some logical rules based on time, flow volume, and thresholds of UV signal and/or UV slope can be employed to start and end fraction collection periods. Most commercial equipment manufacturers supply software with sophisticated fraction collection algorithms.
Pump valves and detectors are often mounted in one assembly, called a pumping skid. Control of the skid is accomplished with the aid of a programmable logic controller (PLC) with appropriate software running from a PC. Fully automatic operation is possible. Electronic controls are either located remotely from the skid or in an appropriately purged box to ensure the unit is explosion proof. In explosion proof equipment, valves are activated pneumatically.
Equipment for multicolumn units likewise involves a combination of columns, pumps, valves, and process analytics specific to the design of the units. Figure 31.7 shows a series of columns intended for use in a Varicol MCC at industrial scale.

FIGURE 31.7 A six‐column simulated moving bed unit. Each column has 1m internal diameter. The unit was designed to operate in a Varicol process.
Photograph courtesy of Novasep Inc.
31.7 SCALE‐UP
With good radial flow distribution, inlet and outlet flow development zones are practically eliminated, and chromatography can be genuinely described by a one‐dimensional (axial) mass balance such as that in Eq. (31.4). The simplest possible scale‐up paradigm under these circumstances is to maintain the same sorbent particle size, column length, and chromatographic velocity across scales, setting all other parameters proportional to the column cross‐sectional area. This will ensure practically identical pressure drop, column efficiency (plate number), separation quality, and specific production rate (production rate normalized to sorbent mass) across scales. An example showing such a scale‐up from a standard 0.46 cm internal diameter (ID) column to a 45 cm ID column is shown in Table 31.1.
TABLE 31.1 Example of Scale‐Up Keeping Particle Size and Column Length Fixed
| Parameters | Small Scale | Scale Factor | Large Scale | Comments |
| Key scale‐up parameters | ||||
| Column diameter | 0.46 cm | 45.00 cm | ||
| Column cross section | 0.17 cm2 | 9570 | 1590.43 cm2 | Basis for scale‐up 9569.94 |
| Parameters that must be fixed to enable scale‐up based on cross‐sectional area | ||||
| Particle size | 10.00 μm | 10.00 μm | ||
| Column length | 25.00 cm | 25.00 cm | ||
| Parameters that scale with cross‐sectional area | ||||
| Mass sorbent in column | 2.53 g | 9570 | 24.25 kg | Packed density of 0.61 g/cc |
| Flow rate | 1.50 ml/min | 9570 | 14.35 L/min | |
| Feed injected per run | 25.00 mg | 9570 | 239.25 g | Load factor Γ held constant |
| Important parameters that remain unchanged in this scale‐up paradigm | ||||
| Chromatographic velocity | 0.215 cm/s | 0.215 cm/s | ||
| Pressure drop across columna | 40 bar | 40 bar | Equation (31.2): φ = 710; η = 1.05 cP | |
| Feed composition | — | — | ||
| Mobile phase composition | — | — | ||
| Run time | 25 min | 25 min | ||
| Gradient program | — | — | ||
| Detector settings | — | — | ||
| Temperature | 30 °C | 30 °C | ||
| Performance attributes | ||||
| Yield | 85% | 85% | ||
| Production rate | 1.22 g/day | 11.71 kg/day | Feed injected/day × yield | |
| Specific production rate | 0.48 | 0.48 | kkd = kg produced/kg sorbent/day | |
| Mobile phase used per day | 2.16 L | 20 671 L | ||
| Specific solvent consumption 1 | 1.76 L/g | 1.76 L/g | No recycle | |
| Specific solvent consumption 2 | N/A | 176 L/kg | 90% recycle | |
aThere will be additional pressure drop caused by flow in piping, not accounted for here.
If identical particle sizes are not employed, similar quality of separation can be obtained by keeping the dimensionless number Li and the normalized feed load constant across scales. Rearranging Eq. (31.2) to solve for the chromatographic velocity u0 and substituting the result into the expression of Li from Eq. (31.12), one obtains

The viscosity η and diffusivity Dm are constants across scales as long as temperature is maintained constant. The bed permeability φ should remain constant across scales if similar sorbent particle geometry (e.g. spherical particles) is maintained. Thus, the pertinent invariant scale factor when sorbent particle size is not held constant is (L/![]() )2/ΔP.
)2/ΔP.
Table 31.2 shows an example of two systems with different particle sizes, 10 and 60 μm, where the factor (L/![]() )2/ΔP is held constant. Separation quality (not quantified in the table) and important performance characteristics such as solvent consumption are expected to be identical in both cases, but specific production rates are dramatically different. The smaller particle size sorbent has an increased specific productivity proportional to the square of the ratio of particle sizes (a factor of 36 in the example). If the same production rate was required in the two cases, the quantity of 60 μm sorbent required would be 36‐fold that in the 10 μm system. Dimensions of identically performing columns packed with the two different particles are also given in Table 31.2. This example illustrates the incentive for using smaller particles and higher pressures for chromatographic operations.
)2/ΔP is held constant. Separation quality (not quantified in the table) and important performance characteristics such as solvent consumption are expected to be identical in both cases, but specific production rates are dramatically different. The smaller particle size sorbent has an increased specific productivity proportional to the square of the ratio of particle sizes (a factor of 36 in the example). If the same production rate was required in the two cases, the quantity of 60 μm sorbent required would be 36‐fold that in the 10 μm system. Dimensions of identically performing columns packed with the two different particles are also given in Table 31.2. This example illustrates the incentive for using smaller particles and higher pressures for chromatographic operations.
TABLE 31.2 Productivity Comparison for Columns Packed with 10 and 60 μ Particles
| Case 1 | Case 2 | Comments/Calculations | |
| Scaling calculations | |||
| Particle size (μ) | 10 | 60 | |
| Pressure drop (bar) | 40 | 3 | 3 bar typical of low pressure equipment |
| Column length (cm) | 25 | 246 | Calculated based on scaling parameter |
| (L/ |
15 625 000 | 15 625 000 | Scaling parameter |
| Productivity calculations: columns packed with 1 kg of sorbent in both cases | |||
| Linear flow velocity, u0 (cm/s) | 0.215 | 0.059 | Equation (31.2): φ = 710; η = 105 cP |
| Dwell time, t0 (min) | 1.94 | 69.89 | t0 = L/u0 |
| Run time, tR (min) | 25 | 900 | Case 2 based on ratio of dwell times |
| Column ID that contains 1 kg sorbent (cm) | 9.14 | 2.91 | Packed density of 0.61 g/cc |
| Feed injected per run (g) | 9.9 | 9.9 | From Table 31.1, keeping feed to sorbent mass constant |
| Yield (%) | 85 | 85 | Based on Table 31.1 |
| Production rate (g/day) | 484.70 | 13.46 | A 36‐fold difference |
| Column dimensions and sorbent quantities required to obtain the same productivity | |||
| Column diameter (cm) | 45 | 86 | |
| Column volume (L) | 40 | 1431 | Must have 36X volume to maintain equal productivity |
| Sorbent mass to pack column (kg) | 24.25 | 873.15 | |
| Feed injected per run (g) | 239.25 | 8613 | |
| Number of injections/ day | 57.6 | 1.6 | # = 24 × 60/tR |
| Production rate (kg/day) | 11.71 | 11.71 | = # × feed injected per inj × yield |
| Specific productivity | 0.48 | 0.013 | kg produced/kg sorbent/day |
31.7.1 Scaling of Gradients
Solvent gradients should be expressed in scalable terms. For example, in reversed‐phase chromatography, varying solvent composition from X to Y% in a straight‐line manner over several CV of flow (rather than expressing it as A% of solvent A to B% of solvent B over 20 minutes) enables seamless scale‐up.
31.8 DESIGN SPACE
The design space is the window within the operating parameter space in which acceptable process performance is achieved. The goal of this section is to provide the reader with some appreciation for the various operating parameters and the sensitivity of conventional chromatographic operations to these parameters. Multicolumn systems are not discussed. The manner of defining the design space for regulatory agencies – carrying out design of experiments – is not within the scope of this discussion.
Figure 31.8 shows a view of a chromatographic process illustrating the various process parameters as well as salient product quality and process performance attributes. Design issues associated with some of the parameters, for instance, sorbent selection, column dimensions, and efficiency, have been discussed earlier in this chapter. Some of the other parameters are discussed below.

FIGURE 31.8 Overview of chromatographic operating parameters, product quality attributes, and process performance measures.
31.8.1 Process Quality Attributes
Critical quality attributes of the product stream from a chromatographic process are product purity, which must be above a minimum target (e.g. >98.5%), with key individual impurities maintained below pre‐specified maximum limits. The concentration in the product stream can be a quality attribute, but a wide range is usually acceptable, and thus it is not usually critical.
31.8.2 Process Performance Attributes
Key process performance (and indeed process economic) measures are (i) yield, calculated as the moles of desired product recovered at or above the target quality as a percentage of the moles introduced in the crude feed; (ii) process productivity, which is simply a mass rate of production, expressed in g or kg/h (a specific production rate, normalized to the mass of sorbent, is sometimes a useful measure); and (iii) solvent consumption, most usefully expressed in terms of each solvent species consumed per unit mass of product. These parameters are discussed further in the Section 31.9.
31.8.3 Feed Parameters
As shown in Figure 31.8, feed concentration, impurity levels, and the feed solution characteristics including solvent composition, buffer or counterion concentration, and pH are important factors. The rule of thumb is that for the same feed load, the higher the feed concentration, the better the results. Nonetheless, feed concentration is usually more critical in isocratic elution than in gradient elution chromatography. This is because in gradient elution, feed introduction is usually under relatively strong binding conditions, enabling concentration of the feed at the column inlet regardless of its concentration. There is usually no such opportunity under isocratic conditions, unless the feed solvent composition is manipulated to afford somewhat stronger binding conditions than the eluent itself. (In reversed‐phase chromatography, this would imply using lower organic modifier in the feed than in the eluent.) Feed solubility is of course a strong limiting factor influencing concentration; some practitioners using isocratic elution chromatography manipulate feed solvent composition to provide more solubility at the expense of strong binding (e.g. raising the methanol content in normal‐phase chromatography).8 The pH can also play a powerful role; there is at least one example where a pH mismatch between feed and eluent has been exploited to enhance separation [25]. Criticality and sensitivity of the process to these parameters needs to be experimentally explored during process design.
31.8.4 Mobile Phase Parameters
Solvent composition (i.e. the blend of different solvents employed), buffer concentration, and pH are key mobile phase parameters. In systems where two or more mobile‐phase streams are blended by the gradient forming system in the pumping skid, a wide composition range may be permissible depending on whether or not appropriate process analytical technology is employed to monitor or control the gradient. Heats of mixing and gas evolution upon solvent blending (gas solubility may change upon blending and solvents that are not degassed may outgas as a consequence) need to be accounted for. Typically outgassing occurs only at low pressures at the column outlet. Prior degassing of solvent streams may not be required if the system has sufficient pressure at the detector cell to prevent outgassing, thus minimizing any detection disturbances.
31.8.5 Fraction Collection
Issues with UV or other detection of product in the column effluent has been discussed above. Proper collection and combining of fractions containing purified material is critical to the success of the chromatographic process. Ideally, a process should be designed to collect one purified fraction and perhaps one or two lower purity fractions that could be recycled. The remainder of the process stream can be sent to solvent recovery units. Collection of a single pure fraction is possible once the chromatographic operation has been fully understood and a fail‐safe rich cut collection algorithm is devised that can handle anticipated variation in feedstock purity and minor drifts in retention caused by operating within parameter ranges. Until sufficient process history is available, it is prudent to collect multiple fractions; combination of contiguous fractions at different purity levels in their entirety to achieve a rich cut at the desired purity is operationally the same as taking a single rich fraction, and thus does not carry the regulatory stigma associated with blending of poor and high quality materials.
31.8.6 Column Lifetime
An important design and economic parameter is column lifetime. Some minimum lifetime should be specified before commercial implementation of a process, and this can be obtained from process history or from multiple injections on a small scale. Minimum plate count and selectivity criteria, measured with a test tracer solution (either a small injection of product or other marker compounds), help to define acceptable column performance, and these can be tied to process performance. For small molecule applications, it should be feasible to extend the use of a column beyond the existing historic lifetime based on a tracer test. Since column performance may diminish for mechanical reasons (poor maintenance of bed integrity owing to lack of sufficient axial pressure, for instance), the sorbent may be unpacked and repacked on multiple occasions. For regulatory purposes, some limits for such operations must be defined. It is also useful to establish whether the feed components can eventually poison the sorbent (by irreversible binding, for instance). In addition, depending on nature of further downstream operations, it may be important to develop tests for column extractables and demonstrate absence or establish acceptable limits of these compounds in the process stream.
31.8.7 Temperature
Column and solvent temperatures are important parameters. Ideally isothermal conditions should be maintained, as retentivity is temperature dependent as shown in Eq. (31.7). However, during operation of larger columns, a small increase (1–3 °C) between the column skin temperature and the solvent inlet temperature is useful to overcome frictional heating effects and within the column and related wall effects [26]. During gradient operations, heat of mixing of the solvent streams can affect the temperature and so should be suitably accounted for.
31.9 ECONOMICS
Given the many parameters associated with design of a chromatographic process, rigorous economic assessment and optimization of chromatography is a complex task. Key economic parameters, such as return on capital, Lang factors (the ratio of total installation cost to cost of equipment), etc., vary from company to company, so that outcomes of net present value (NPV) assessments of the same separation problem may lead to different conclusions at different locations. Nevertheless, cost drivers for chromatographic operations are common to most other processes; in an industrial manufacturing operation, the overall cost, expressed per kg or ton of product purified, is the sum of costs of amortized capital, labor, consumables, waste, and product loss. In addition, there are intangibles, such as development opportunity costs, that are not usually taken into account because they are hard to quantify. For instance, a chiral separation is typically easier and quicker to implement and scale‐up than an asymmetric synthesis. If the unwanted enantiomer can be racemized, the major objection to a separation approach (50% yield loss associated with the unwanted enantiomer) may be mitigated. With commensurate investments in optimization and engineering, cost differences between the chiral chromatography and a more elegant asymmetric synthesis may not ultimately be significant, but the time that talented chemists would have spent on the synthesis development could have been used more fruitfully elsewhere.
Capital and labor costs are usually specific to the site of operation. In this author's opinion, cost for large‐scale high performance chromatographic equipment and installation is not prohibitive compared with new installation of other process equipment. There is sufficient competition among vendors and important equipment designs are now off patent. The key economic concerns for the chromatography development engineer should be the minimization of cost of consumables and product loss. Several good literature references for quantitative optimization are available [27, 28, Vol. 1].
31.9.1 Stationary Phase
During development, cost of the stationary phase can be high. Sorbent usually is dedicated to a particular product, and, since product failure rates are high, there is limited opportunity to spread the cost of the phase over multiple batches. On the other hand, during commercial operation, sorbent costs, while significant, are not usually a limiting factor since column lifetime can be quite long. For instance, CSP lifetimes of several years have been reported. Unpublished reports suggest that stationary phase costs in such applications can be held below $10/kg purified (Olivier Dapremont, personal communication).
31.9.2 Solvent Consumption
Solvent volumes employed in chromatography are indeed high. Operating a 45 cm ID column at 10 L a minute involves handling 4000 gal a day. However, measures can be taken to drastically limit total solvent consumption and costs by implementing solvent recycle procedures. At full production, it is reasonable to expect upward of 90% solvent recycle on the organic component. (Water is rarely recycled; in some instances this may give organic solvent‐rich mobile phases the economic edge, since disposal costs for aqueous waste must be considered.)
For separations where multicolumn techniques, such as SMB technology or multi‐injection steady‐state recycle technology, can be employed (mostly for chiral separations), solvent consumption can be significantly reduced compared to column chromatography. Coupled with solvent recycle, the use of SMB technology may consume less solvent than a conventional three‐step classical chiral resolution by crystallization with a tartrate salt, and the total cost for an SMB operation can be competitive with or lower than such a process [29]. New CSPs with high adsorption capacity are becoming available in the market; the use of these phases is expected to improve the economics of chromatographic separation of enantiomers even further.
31.9.3 Product Loss
For high value products, yield loss can have a significant economic impact. In conventional chromatography (e.g. a gradient elution separation of peptides), yield losses can be minimized by recycling impure fractions. Regulatory agencies expect defined criteria for choosing fractions for recycling, and limits on the number of times that recycle is allowed. Multicolumn techniques have a distinct advantage since high yield is an inherent attribute of continuous processes. An example showing yield increase from 85% in a conventional gradient peptide purification to greater than 95% in an MCSGP process, with a concomitant 25‐fold productivity increase, has been published [29].
31.10 CONCLUSIONS
With modern high performance equipment and improvements in operating strategies, including the increasing use of multicolumn technologies, robust and economic large‐scale chromatographic processes can be designed for purification of a wide variety of pharmaceutical compounds.
ACKNOWLEDGMENTS
I am grateful to Dr. Olivier Dapremont, of Ampac Fine Chemicals, for insightful discussion on sorbent costs and economics of simulated moving bed chromatography operations. I also thank Dr. Henri Colin, Drew Katti, and the late Professor Georges Guiochon for useful discussions. Also, I am grateful to Novasep Inc. for providing the photographs of their equipment used in Figures 31.6 and 31.7.
REFERENCES
- 1. Twett, M.S. (1906). Ber Dtsch Botan Ges 24: 316–323. and 384–393.
- 2. Antia, F.D. and Horváth, C. (1989). Ber Bunsenges. Phys. Chem. 93: 961–968.
- 3. Horváth, C. and Melander, W.R. (1983). Chromatography: Fundamentals and Applications of Chromatographic and Electrophoretic Methods, Part A (ed. E. Heftmann), 27–135. Amsterdam: Elsevier.
- 4. Antia, F.D. and Horváth, C. (1989). J. Chromatogr. 484: 1–27.
- 5. van Deemter, J.J., Zuiderweg, F.J., and Klinkenberg, A. (1956). Chem. Eng. Sci. 5: 271–289.
- 6. Antia, F.D. and Horváth, C. (1988). J. Chromatogr. 435: 1–15.
- 7. Unger, K.K. (1978). Porous Silica. Amsterdam: Elsevier.
- 8. Roush, D.J., Antia, F.D., and Göklen, K.E. (1998). J. Chromatogr. A 827: 373–389.
- 9. Nti‐Gyabaah, J., Antia, F.D., Dahlgren, M.E., and Göklen, K.E. (2006). Biotechnol. Prog. 22: 538–546.
- 10. Meyer, V. (2010). Practical High‐Performance Liquid Chromatography, 5e. New York: Wiley.
- 11. Capaldi, D.C. and Scozzari, A.N. (2008). Antisense Drug Technology: Principles, Strategies and Applications, 2e (ed. S.T. Crooke), 401–434. Boca Raton: CRC Press.
- 12. Gronke, R. (2017). New purification process for antisense oligonucleotides. Webinar presented at KNect365 TIDES Digital Week, (18–21 September 2017). https://event.on24.com/wcc/r/1481597/CAEFB5DFCDA434F834AFA5191E99592A/150584 (accessed 22 October 2018).
- 13. Tiselius, A. (1943). Kolloid Z. 105: 101.
- 14. Frenz, J. and Horváth, C. (1985). AIChE J. 31: 400–409.
- 15. Tugcu, N., Bae, S., Moore, J.A., and Cramer, S.M. (2002). J. Chromatogr. A 954: 127–135.
- 16. Liu, J., Hilton, Z., and Cramer, S.M. (2008). Anal. Chem. 80 (9): 3357–3364.
- 17. Gattuso, M.J. (1995). Chim. Oggi. (Chem. Today) 13: 18–22.
- 18. Antia, F.D. (2002). Scale‐Up and Optimization in Preparative Chromatography: Principles and Biopharmaceutical Applications (ed. A.S. Rathore and A. Velayudhan), 173–201. New York: Marcel Dekker.
- 19. Ludemann‐Hombourger, O. and Nicoud, R.M. (2000). Sep. Sci. Technol. 35: 1829–1862.
- 20. Zhanga, Z., Mazzotti, M., and Morbidelli, M. (2003). J. Chromatogr. A 1006: 87–99.
- 21. Aumann, L. and Morbidelli, M. (2007). Biotechnol. Bioeng. 98: 1043–1055.
- 22. Müller‐Späth, T. and Morbidelli, M. (2017). In: Integrated Continuous Biomanufacturing III (ed. S. Farid, C. Goudar, P. Alves, and V. Warikoo), ECI Symposium Series. Hotel Cascais Miragem, Cascais. http://dc.engconfintl.org/biomanufact_iii/23 (accessed 22 October 2018).
- 23. Grill, C.M. (1997). US Patent 5,630,943, 30 November 1995, Granted date 20 May 1997.
- 24. Valery, E., Ludemann‐Hombourger, O., Boni, J., and Hauck, W. Novasep publication. https://www.novasep.com/media/articles‐and‐publications/50c%201%20‐%20cyclojet%20a%20powerful%20tool%20for%20binary%20separations.pdf (accessed 22 October 2018).
- 25. Vailaya, A., Sajonz, P., Sudah, O. et al. (2005). J. Chromatogr. A 1079: 85–91.
- 26. Dapremont, O., Cox, G.B., Martin, M. et al. (1988). J. Chromatogr. A 796: 81–99.
- 27. Guiochon, G., Shirazi, D.G., Felinger, A., and Katti, A.M. (2002). Fundamentals of Preparative Chromatography, 2e. Amsterdam: Elsevier Chapter 18.
- 28. Katti, A. (2000). Handbook of Analytical Separations, vol. 1 (ed. K. Valkó), 213–291. Amsterdam, Oxford: Elsevier.
- 29. Auman, L., Stroehlein, G., Schenkel, B., and Morbidelli, M. (2009). Biopharm. Int. 22 (1): 46–53.