
35
DESIGN OF FILTRATION AND DRYING OPERATIONS
Praveen K. Sharma
Chemical Development, Tetraphase Pharmaceuticals, Inc., Watertown, MA, USA
Saravanababu Murugesan* and Jose E. Tabora
Product Development, Bristol‐Myers Squibb, New Brunswick, NJ, USA
35.1 INTRODUCTION
In this chapter we consider two important unit operations in the pharmaceutical industry, filtration and drying. As part of the manufacturing process of active pharmaceutical ingredients (APIs), these two operations follow naturally from the main mechanism of isolation and purification used in this industry, i.e. crystallization. It is in fact the dominance of crystallization as an isolation and purification technology that dictates the corresponding use of filtration and drying. As unit operations, both filtration and drying have wide applicability in the broad chemical and pharmaceutical industry; however, for brevity and clarity we will limit our discussion here to situations in the pharmaceutical industry in which these unit operations are a continuation of an isolation train that is preceded by a crystallization. In this context the slurry resulting from the crystallization is a mixture of the suspended solids (valuable product) and the supernatant (waste solvent or mother liquor).
The goal of the filtration process is to separate the solids from the supernatant. In many cases, filtration operations are carried out to remove undesirable solid matter when the valuable material is present in the liquid phase. Waste filtration will not be discussed in this chapter, and we will concentrate on filtration as a unit operation to isolate the solid API from the solvent in which it was crystallized.
The process of filtration results in the separation of the solids as a wet cake that requires subsequent washing followed by drying to yield a product of high purity. This is subsequently packaged or processed further (e.g. milling) as a dry powder to complete the manufacturing of the drug substance. As discussed in previous chapters, the chemical manufacturing of an API proceeds via a number of sequential chemical conversions during which some of the intermediates are isolated in the solid form. Although the isolation of all the intermediates may require the implementation of a filtration and drying sequence, these two unit operations acquire extreme importance in the final step when the API is isolated. Both filtration and drying operations play a significant role in the quality and the physical properties of the API.
35.2 FILTRATION
35.2.1 Background and Principles
In the pharmaceutical industry, filtration is the process of separating solids from a supernatant by exposing the slurry to a filter medium (filter cloth, screen, etc.) and applying a pressure gradient across the medium. The medium retains all or a large portion of the solids, and the supernatant flows through the medium producing the separation. For the purpose of this discussion, it is assumed that we are interested in filtering a slurry stream generated from a crystallization, to recover the solids (product) in high purity from the supernatant (waste, often called mother liquor). Typical methods to provide a pressure gradient are applied static pressure, applied vacuum downstream from the separating medium, and centrifugal force. The nature of the filtered slurry and the operating parameters of the isolation equipment dictate the filtration rate, and thereby the cycle time of this unit operation during the process and the properties of the resulting wet cake.
35.2.1.1 Solid–Liquid Separation
The typical solid–liquid separation performed in the pharmaceutical industry can be depicted as a cake filtration or filtration through porous medium.
Cake filtration is performed by forcing slurry against a filter medium whose pore sizes are smaller than the average particle size of the solid particles present in the slurry so that the liquid phase passes through the medium, while the solid phase is retained by the medium. During this process, cake is built up over time on the filter medium (Figure 35.1).
FIGURE 35.1 Cake filtration through porous medium.
35.2.1.1.1 Filtration Principles
In cake filtration, the resistance to flow increases with time as the cake builds on the filter medium. Initially the only resistance to flow is provided by the filter medium; however, as the cake builds, the cake itself becomes a resistance that must be overcome by the fluid being removed. If the filtration is performed at a constant pressure, the flow rate will decrease monotonically during the filtration. This is called a constant pressure filtration. In a less common constant rate filtration, the pressure drop is increased gradually to afford a constant flow rate.
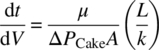
In general, the rate of filtrate flow in a pressure‐driven filtration can be depicted as shown in Figure 35.2. The rate of filtrate flow (q) is directly proportional to the driving force, pressure differential (ΔP = P1 − P2) and inversely proportional to the length (L) of the cake (which in turn is a function of the amount of cake filtered).

FIGURE 35.2 Schematic of solid–liquid separation.
For the same amount of filtered slurry, an increase in the filtration area (A) would provide more surface area for the filtrate flow and a reduction in the cake height L. An increase in the filtrate viscosity would adversely affect the filtration rate. Hence, the filtrate flow can be given as follows:
where
- q = dV/dt = filtration flow rate (m3/s)
- ΔPCake = pressure drop across the cake (Pa)
- A = filtration area (m2)
- μ = filtrate viscosity (Pa·s)
- L = filtration length or cake height (m)
Equation (35.1) is called Darcy's law [1] with a proportionality constant k defined as the cake permeability:
where
- k = permeability of the cake (m2)
The term (L/k) is equivalent to the cake resistance (Rc) faced by the fluid flow during filtration:
where
- Rc = cake resistance (m−1)
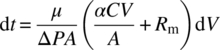
However, in addition to the cake resistance, the flow also faces the medium resistance (Rm = Lm/km). These resistances can be presented as resistances in series in determining the rate of filtration (rate at which volume of filtrate is collected) [2]
where
- ΔP is the combined pressure drop (Pa) across the cake and the filter medium.
Specific cake resistance (α) is then given by
where
- C = concentration of slurry (kg/m3)
- V = volume of filtrate collected (m3)
Specific cake resistance (m/kg) is an intrinsic property of the material being filtered and is a function of the particle size, cake porosity, particle density, and shape [3].
At time zero, the term (αCV/A) is zero as the filtration has not been initiated (V = 0), and there is no cake built up, and hence there is no resistance due to the cake (Rc = 0). The total resistance at this time is due to only the medium resistance (Rm). As the filtration proceeds (V > 0), the cake starts to build up, and the value of Rc in Eq. (35.4) increases, thereby resulting in a corresponding increase in the overall resistance and further decreasing the rate of filtration. After a certain point of filtration, Rc dominates and Rm becomes negligible. In general terms, Rc originates from the packing of the particles as the cake forms, restricting the space available for the fluid to flow through. The fluid must then flow through the spaces between the particles with increasing friction, which in turn, for the same pressure drop, results in a decrease in the filtrate flow rate.
Combining Eqs. (35.4) and (35.5) and rearranging,
Integrating Eq. (35.6) from the start of filtration (t = 0, V = 0) to an arbitrary time t at which a volume V of filtrate has been collected, we obtain
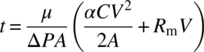
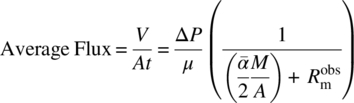
Equation (35.7) can be further rearranged as
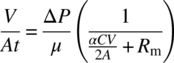
The term V/At in Eq. (35.8) corresponds to the volume of the filtrate filtered through unit area in unit time and is denoted as the average filtration flux or simply the filtrate flux. Note that the average filtration flux is an inverse function of the amount of the cake collected (CV = M).
In some cases, the flow itself influences the packing of the solid particles that may result in an increased resistance. In a filtration process this will be experienced as a change in the specific cake resistance with increased pressure (flow), and the cake is then said to be compressible. Specific cake resistance in the case of compressible cakes may be represented by an average‐specific cake resistance ![]() in the following equation:
in the following equation:
where
- α0 and n are empirical constants.
- n is called the compressibility index of the cake.
For incompressible cakes, α is independent of ΔP, and the compressibility index n is 0. If the cake is compressible (dependent on pressure), then n is greater than 0. Typical pharmaceutical cakes have a compressibility index in the range of 0.2–1.
The average filtrate flux profiles of compressible and incompressible cakes are illustrated in Figure 35.3 as a function of the pressure drop across the cake. As seen in the figure, in the case of incompressible cakes (n = 0), an increase in the pressure drop results in a corresponding increased filtrate flow, while in moderately compressible cakes (0 < n < 1), the filtrate flow monotonically increases but with decreasing slope, and in highly compressible cakes (n > 1), the flow reaches a maximum and starts to decline as the pressure is increased further. This is mainly because of the fact that in the case of highly compressible cakes, after a certain point an increase in pressure compresses the cake, filling the interstitial spaces between the particles, thereby reducing the space available for the filtrate to flow through the cake.

FIGURE 35.3 Filtrate flux vs. pressure drop as a function of the compressibility index.
Source: Reprinted with permission from Ref. [4]. Copyright 1997, Elsevier.
Derivation of Eqs. (35.4) through (35.8) assumed that solid particles are deposited on the filter cake and there is no migration of particles across the surface of the cake.
Figure 35.4 shows the profile of a typical pressure drop seen across the cake and medium from the initiation (t = t0) to the completion of filtration (t = tf).

FIGURE 35.4 Pressure drop across the cake during filtration.
At t = t0, there is no cake, and hence the overall pressure drop is only due to the medium resistance, and at t = t1/2, the overall pressure drop is due to the combination of cake and medium resistances with cake resistance contributing to the majority of the pressure drop. At the end of the filtration, the overall pressure drop is mainly due to the cake resistance with minimal contribution from the medium. The linearity and the precise slopes of the profiles of the pressure drops depend on the compressibility of the cake.
From Figure 35.4, at
As a result of the increasing resistance over time, the filtration flux decreases over time. The profile of the average filtration flux as a function of total cake formation (mass of cake over unit area of filtration, M/A) and specific cake resistance can be estimated for a given applied pressure differential and viscosity by using Eq. (35.8) as shown in Figure 35.5. A significant reduction in the flux occurs during the initial period of filtration as the cake resistance begins to dominate over the medium resistance. The profiles in Figure 35.5 are estimated for filtration at pressure 20 psi, viscosity of 1.2 cP, and Rm 1 × 10⁶ m−1 as an example case.
FIGURE 35.5 Filtrate flux profile vs. M/A as a function of α (note the logarithmic scale on the y‐axis).
It is also evident from the figure that reporting the average filtration flux to compare the filtration performances of two different slurries could be misleading, as those two streams could result in the same filtration flux but for different levels of cake formation. A comparison of just the filtration fluxes (e.g. from Buchner funnel filtration) can be performed as long as the filtration pressure and the M/As are similar. Typical ranges for the ratio M/A seen in the laboratory (left‐most gray region) and pilot plant (right‐most gray region) are also given in Figure 35.5 for better understanding. Table 35.1 gives a general guidance of the filtration performance in terms of specific cake resistance.
TABLE 35.1 Alpha vs. Practical Filtration Performance in Conventional Equipment
| Alpha (m/kg) | Filtration Performance |
| 1 × 10⁷ to 1 × 10⁸ | Fast filtering |
| 1 × 10⁸ to 1 × 10⁹ | Moderately fast filtering |
| 1 × 10⁹ to 1 × 10¹⁰ | Slow filtering |
| >1 × 10¹⁰ | Very slow filtering |

FIGURE 35.6 Filtrate flux profile vs. M/A at α = 1 × 10¹⁰ m/kg.
35.2.1.2 Centrifugation
Centrifugation is another type of filtration used to separate solids from liquids (or slurry) where the pressure drop across the filter medium is generated by using centrifugal force. Centrifugation is more common for larger batch sizes compared with pressure filtration, as it can be performed in a relatively continuous fashion. In centrifugation, the filter medium supports the solid particles as they settle due to the centrifugal force (FG) that can be orders of magnitude higher than standard gravitational force (Fg), and the liquid passes through the cake and then through the medium.
35.2.1.2.1 Centrifugation Principles
In a small‐scale centrifuge with a lower rotational speed, the liquid surface usually takes the shape of a paraboloid [5]. However, in large‐scale industrial centrifuges, due to high rotational speed, the centrifugal force dominates the force of gravity and the liquid surface takes a cylindrical shape, and it is coaxial with the axis of rotation (horizontal or vertical depending on the centrifuge). Figure 35.7 depicts a typical scenario inside a vertical axis centrifuge. As seen in the figure, the outer layer of cake (of radius ri) and the outer layer of the liquid (of radius r1) are cylindrical in shape and are coaxial with the axis of rotation of the basket (of radius r2).
FIGURE 35.7 Cake filtration in a centrifugal filter.
The pressure drop across the cake and liquid layer is [3]
where
- ω = angular velocity of the basket (rad/s)
- ρ = slurry density (kg/m3)
Combining Eqs. (35.6) and (35.11) and substituting for ΔP,

Equation (35.12) has been derived with the following assumptions:
- The filtration area does not change with the cake formation.
- The liquid layer is on top of the cake layer at all times.
- Gravitational force is negligible when compared with the generated centrifugal force.
- Medium resistance is constant throughout the filtration.
Similar to pressure filtration, for compressible cakes, α increases with an increase in the centrifugal force.
The centrifugal force FG created by rotating the centrifuge is given by the following equation:

where
- Fg = gravitational force of the Earth
- G = centrifugal gravity = ω2 × r2
- g = Earth's gravity
G values can be determined using the radius of the bowl and the rotational speed as shown in Figure 35.8.
FIGURE 35.8 Centrifugal gravity versus bowl speed as a function of basket radius.
35.2.1.2.2 Filtration as a Multistage Process
Filtration of a slurry to form a cake, either by pressure filtration or centrifugation, can also be modeled as a multistage process including stages such as the formation, the consolidation, and the immobilization of the cake bed. Discussion of this more sophisticated approach is beyond the scope of this chapter. More information about this approach is available in the literature [6, 7].
35.2.1.3 Effect of Slurry Properties
As mentioned earlier in this chapter, the nature of the slurry as defined by particle size, concentration and morphology heavily influences filtration design and filtration performance. Filtration design includes the choice of the equipment, wash solvents, and filtration conditions, while filtration performance includes the purity/impurity profile of the resulting cake, its wetness, and cycle time for filtration. Hence, in several occasions, filtration performance may be improved by adjusting the crystallization conditions to yield a slurry with good filtering properties. Related crystallization concepts are described in detail in Chapter 24.
Here, we provide example cases in which minor adjustments in crystallization procedure resulted in significant improvements in filtration performance.
35.2.1.3.1 Spontaneous Nucleation vs. Seeded Crystallization
Figure 35.9 shows the comparison of two crystals produced from the same pharmaceutical intermediate but through different crystallization conditions. The spontaneously nucleated batch (Figure 35.9a) has a significant portion of fines with a needlelike morphology and a high aspect ratio, while the seeded batch (Figure 35.9b) has a thicker rodlike morphology and comparatively low aspect ratio. In this case, the modification in crystallization reduced the filtration time significantly. The specific cake resistance measured for the needles (Figure 35.9a) was 6.9 × 10¹⁰ m/kg, while the specific cake resistance for the rods (Figure 35.9b) manufactured with an improved crystallization was 9.0 × 10⁹ m/kg.
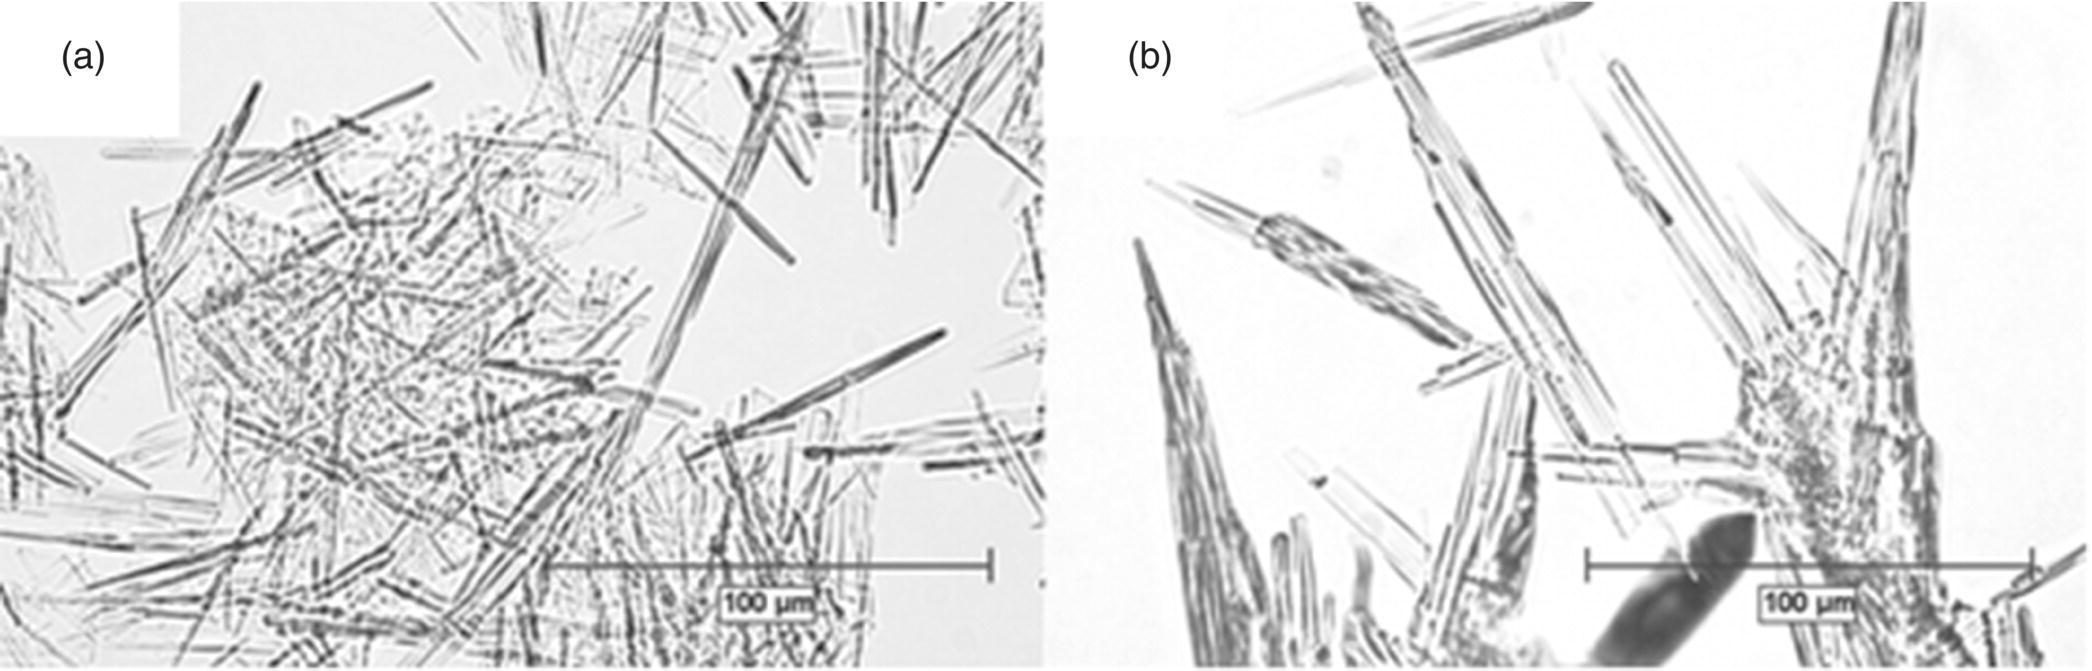
FIGURE 35.9 Optical microscopy images of the crystals obtained through (a) spontaneous nucleation and (b) seeded crystallization.
35.2.1.3.2 Distillative Crystallization vs. Antisolvent Crystallization
In this example, the crystallization was changed from a distillative crystallization (DC) to an antisolvent crystallization (AS) with a different solvent system. This change in crystallization did not affect the crystal behavior significantly (see Figure 35.10), and the estimated specific cake resistances were 1.37 × 10¹¹ m/kg and 0.4 × 10¹¹ m/kg. However, a significant decrease in the viscosity of the mother liquor (from 2.4 to 0.45 cP) and in the solid concentration (from 126 to 27 mg/ml) between these two crystallizations played a major role in influencing the filtration performance in this example. The impact of these variables on the filtration time could be explained by Eq. (35.7) as below.
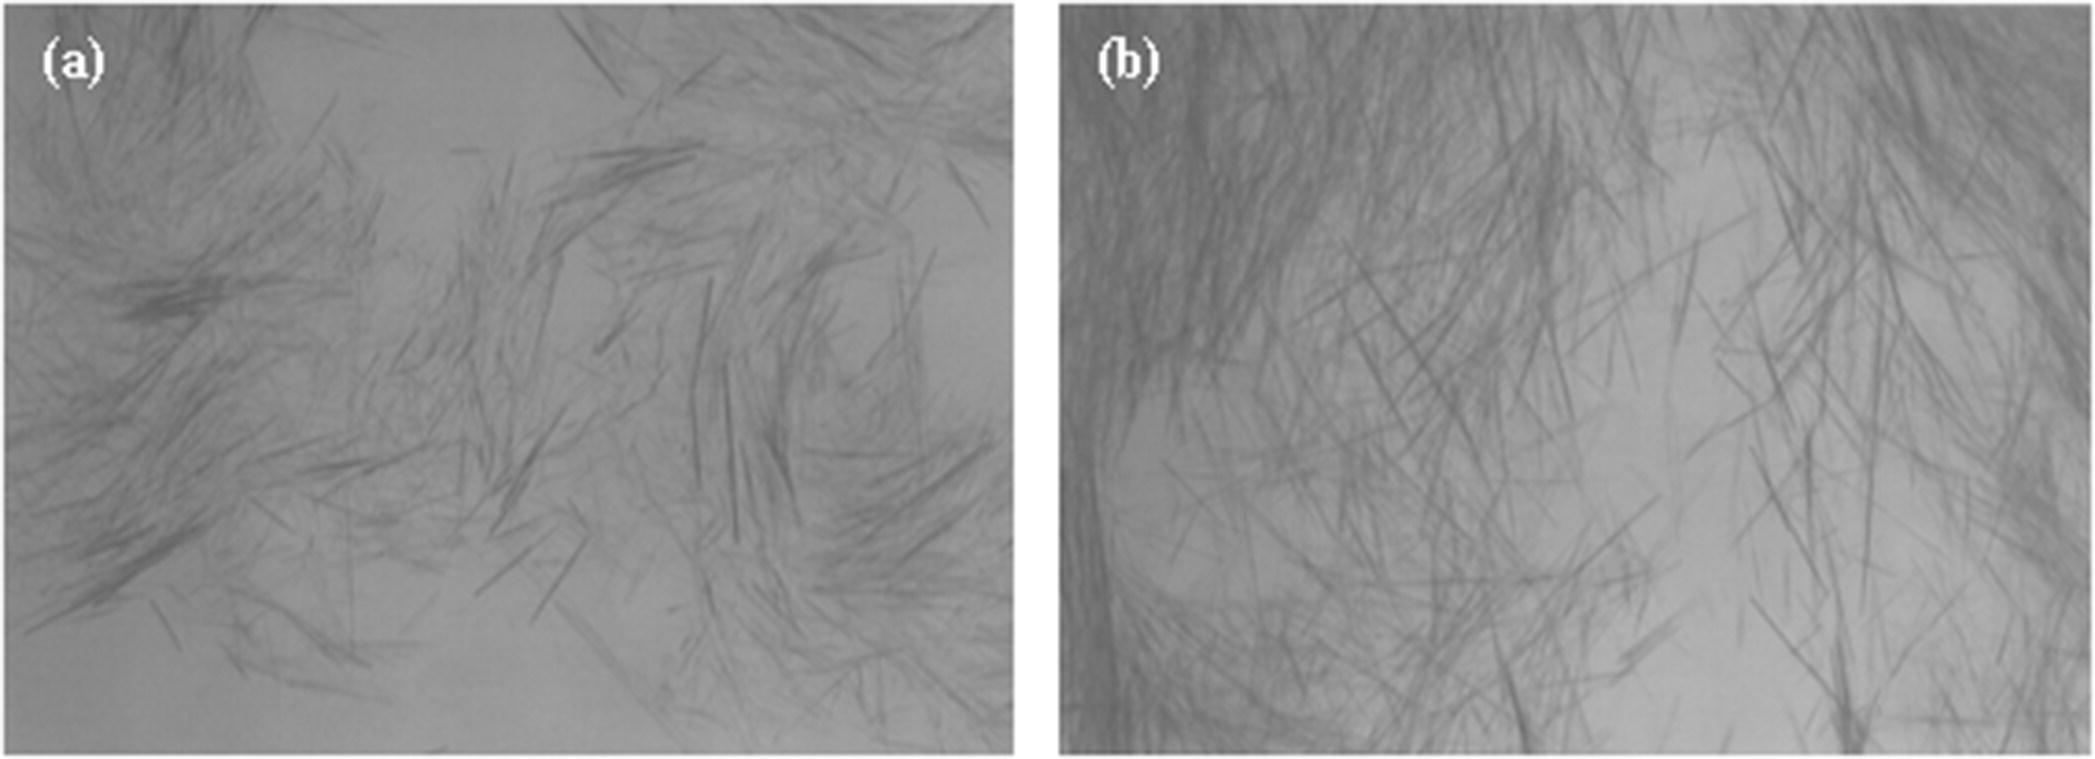
FIGURE 35.10 Optical microscopy images of the crystals through (a) distillative crystallization and (b) antisolvent crystallization.
Since there is very minimal effect of Rm on filtration time, the medium resistance term in Eq. (35.7) could be ignored, and the filtration times (t1 and t2) for these two cases are given as follows:
Since the values of ΔP and A were the same for both the cases, the ratio of t1 and t2 is

By substituting M for CV, the ratio of the filtration times (t1/t2) of both filtrations to filter the same amount of cake (M1 = M2) is then given by
Note that when M1 = M2, V1/V2 can be replaced by C2/C1, as has been done here. Substitution of the values for viscosity, cake resistance, and concentration in the above expression provides an estimate of the time ratio between the two filtrations:

The profiles of the cake formation and the filtrate received over time for both filtrations are given in Figure 35.11. As seen in the figure, the slurry crystallized from the DC took approximately 117 seconds to filter, while the one from the AS took only approximately 35 seconds to filter a similar amount of cake.

FIGURE 35.11 Profiles of cake formation and filtrate collection as a function of time for the two crystallizations.
35.2.2 Equipment
This section provides examples of common isolation equipment used in the laboratory and at large scales.
35.2.2.1 Laboratory Equipment
35.2.2.1.1 Pressure Filtration
35.2.2.1.1.1 Buchner Funnels
Buchner funnel filtration is one of the simplest and most widely used forms of laboratory filtration. It is named after the chemist Ernst Buchner who invented the Buchner funnel and Buchner flask. It is vacuum driven and can be used in a scale ranging from a few tens of milligrams to a few kilograms. Figure 35.12a shows a picture of a Buchner funnel filtration setup. The funnel is made of porcelain, glass, or plastic (Figure 35.12b). The filter media, typically a filter paper or a filter cloth, is kept on the perforated plate to retain the solid. In the case of a sintered glass funnel, the fritted surface acts as the filter medium. The usage of the Buchner funnel is mainly driven to implement a separation and they are rarely used to collect scale‐up parameters; however, with some care, they can provide a first approximation to the filtration properties of the cake. After completing the isolation, cake washes can be performed by adding the solvent on the wet cake and starting the filtration.
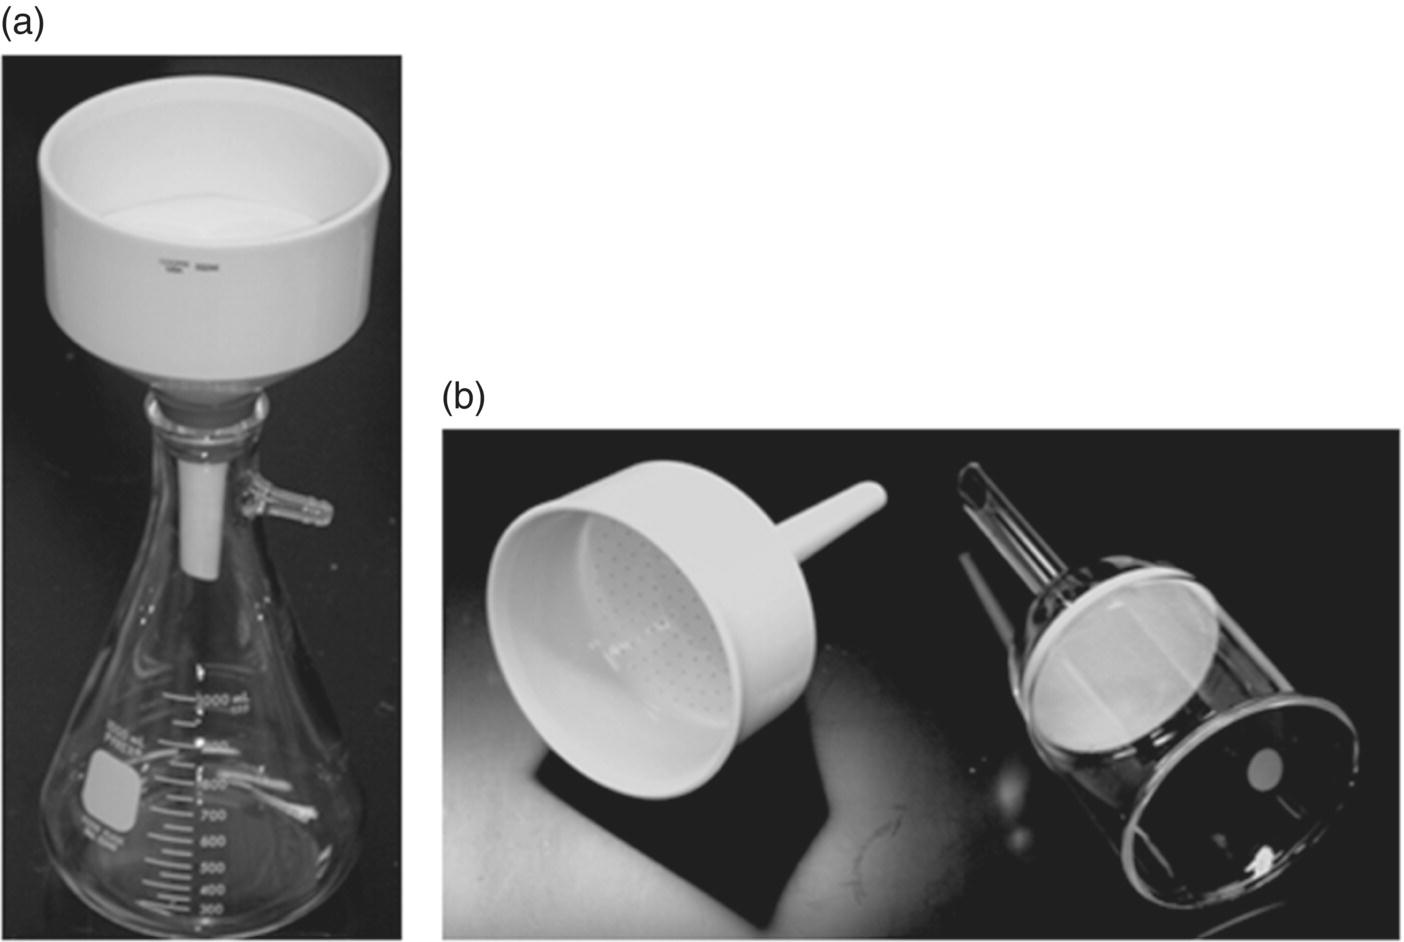
FIGURE 35.12 Pictures of Buchner funnel in (a) a filtration setup and (b) ceramics with perforated plate and glass with fritted filtration surface.
Source: ChemGlass, Inc.
35.2.2.1.1.2 Leaf Filters
Leaf filters are relatively larger‐scale filters compared with Buchner funnel filters. Their use is driven by the need to characterize slurry filtration properties and requires detailed measurement of the filtration profile, i.e. rate of filtrate collection. Figure 35.13 shows a few examples of leaf filters of different materials of construction. Leaf filters consist of three parts: a bottom portion with flow valve, a middle stem portion, and a top lid portion. The bottom portion has the provision to place the filter medium, the middle stem portion holds the slurry, and the top portion closes the stem portion. After connecting the bottom portion (with filter medium of desired pore size) to the stem portion, the slurry is poured into the stem. The top lid portion is then connected to the stem. The chosen pressure set point is attained usually through compressed nitrogen/air. Cake washes can also be performed in a similar fashion. Filtration is performed at multiple pressures to fully characterize the cake properties such as the specific cake resistance and the compressibility index. Refer to Example Problem 35.2 for clarity.

FIGURE 35.13 Examples of leaf filters of various materials of construction.
Source: BHS‐Filtration Inc., Rosenmund, Inc.
35.2.2.1.2 Centrifugation
The pharmaceutical industry uses various types of centrifuges. This section provides an example of a vertical axis, batch mode centrifuge (Figure 35.14a). It uses a perforated basket (Figure 35.14b) rotating on a vertical axis to produce a centrifugal force on the slurry that is fed to the basket through the feed pipe. The perforated basket is lined with a filter bag of desired pore size. This filter bag retains the solid particles as wet cake, while the filtrate passes through the filter medium. The filtrate flows out of the basket through the perforations and gets collected outside through the outlet valve. Cake washes can then be performed through similar steps by feeding the wash solvent to the basket.
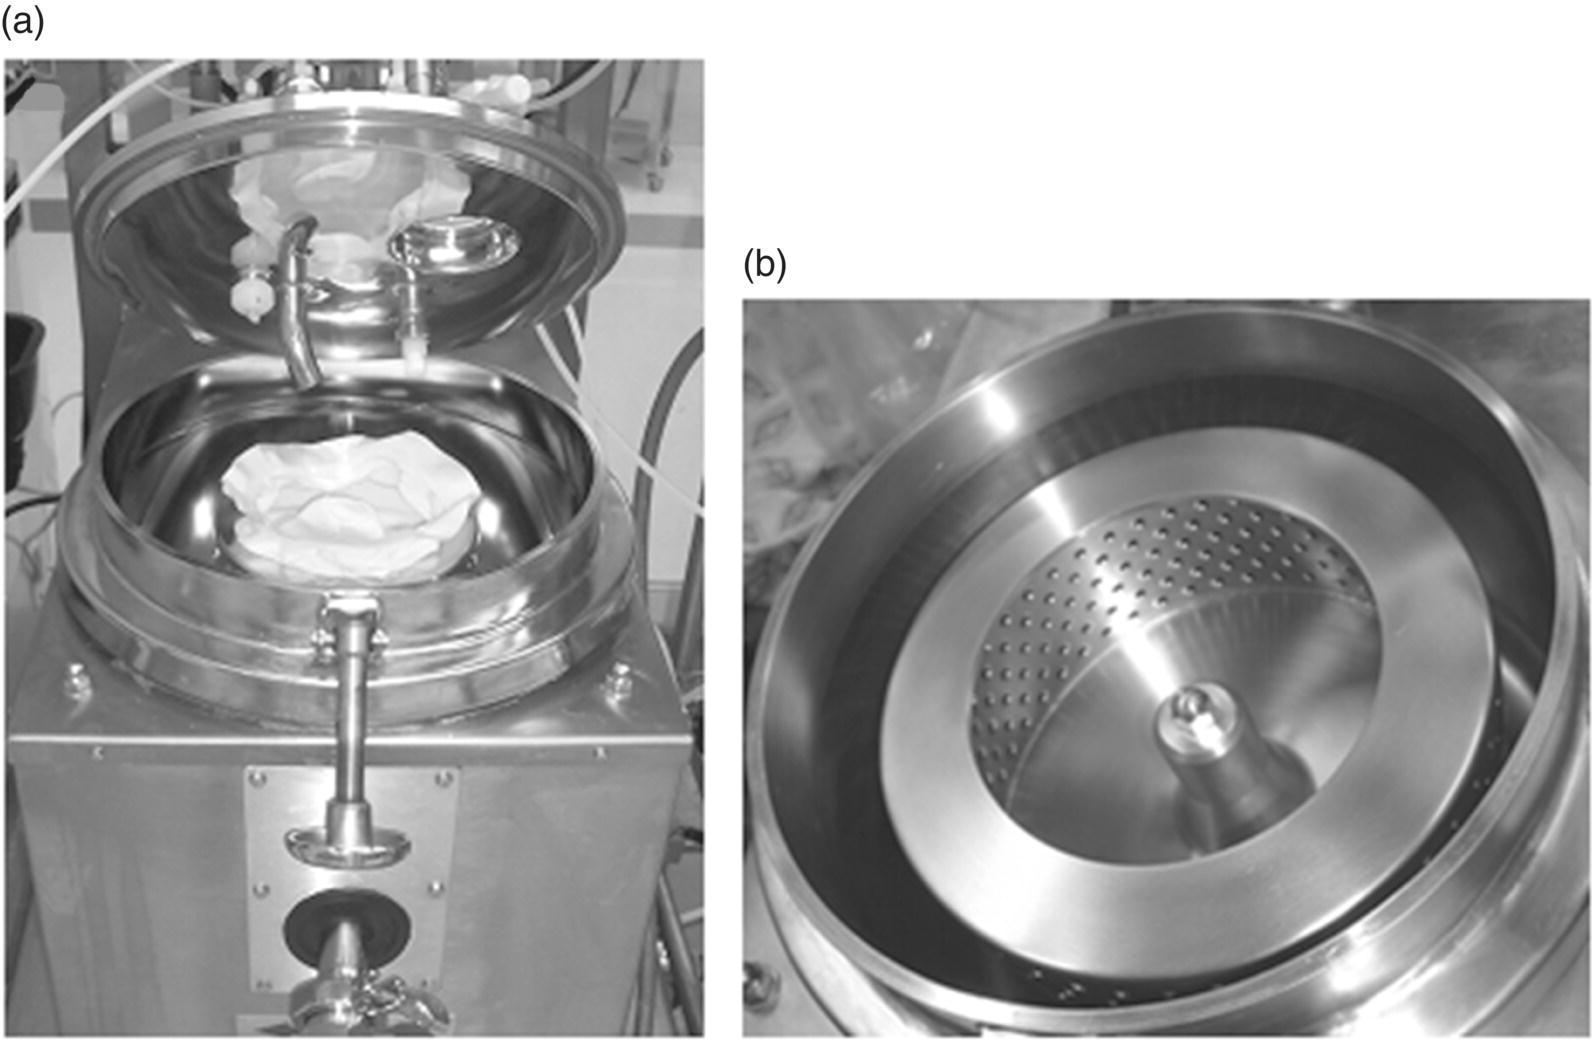
FIGURE 35.14 Pictures of (a) a vertical axis laboratory centrifuge with filter bag installed and (b) centrifuge basket.
Source: Rousselet Robatel.
35.2.2.2 Large‐Scale Filtration Equipment
The large‐scale isolation equipment used in pilot and manufacturing plants have the same working principle as the laboratory filtration equipment. The operating conditions of the large‐scale equipment, however, differ significantly from those of the laboratory equipment. Selection of appropriate isolation equipment for a specific process depends on various factors, and this issue is discussed in detail in the next section.
35.2.2.2.1 Filter Dryer
Filter dryers are one of the most robust isolation equipment used in the pharmaceutical industry. As the name implies, it encompasses the filtration and the drying unit operations into a single piece of equipment. Figure 35.15 shows the cross‐sectional representation of a filter dryer. The mode of operation for filtration is similar to that of the leaf filter. The required differential pressure is generated by introducing either pressure upstream of the filter medium or vacuum downstream. Typical operation would include equipment setup (fitting a filter cloth of appropriate pore size and material of construction and performing leak checks), loading the slurry, deliquoring the mother liquor, loading the wash, deliquoring the wash, drying, and discharging. Filter dryers are usually fitted with an agitator that can be lowered or raised as needed. The presence of an agitator makes filtering and cake washing more efficient as the agitator aids in mixing the cake uniformly. Agitation also helps in smoothing the cake in case of crack formation that otherwise could cause channeling of the wash solvents resulting in inefficient cake washing. Filter dryers are also fitted with a jacket to facilitate heating in the drying step. Provision of a jacket also allows for performing filtrations at different temperatures. After completing the filtration and washing steps, the cake can be dried in the same equipment, and the dry cake can be discharged through the discharge port with the help of the agitator. There is typically an offset between the lowest position of the agitator and the filter cloth in order to avoid lifting or rupturing the cloth. This offset often results in residual cake (denoted as “heel”) left on the cloth after the discharge. The heel could potentially slow down the filtration of the next batch. Heel removal is discussed in a later Section 35.2.3.2.1.
FIGURE 35.15 Cross‐sectional representation of a filter dryer.
35.2.2.2.2 Centrifugal Filter
Centrifuges can be used either continuously or in batch mode. The pharmaceutical industry prefers batch centrifuges from a regulatory standpoint as it gives an option of stopping the unit operation in case the product specification fails at some point. This section provides examples of batch centrifuge filters.
35.2.2.2.2.1 Peeler Centrifuge
Peeler centrifuges are available with a horizontal or vertical axis of rotation. The mode of discharge is through a mechanical peeling action. Figure 35.16 shows the cross‐sectional representation of a peeler centrifuge. Typical operation involves equipment setup (fitting a filter bag of appropriate pore size and material of construction, performing leak checks), initiating the spinning, loading the slurry, deliquoring the mother liquor, loading the wash, deliquoring the wash, peeling, discharging, and removing the heel before initiating the next load. Isolation starts as soon as the slurry is loaded, as the basket is already spinning, yielding the necessary centrifugal force for the separation. After the liquid layer goes below the cake surface, cake washing can be initiated. After completely deliquoring the wash solvents, the cake is peeled off using a hydraulically activated peeler. The peeled solids are then discharged through a chute for the next unit operation. Often, there is an offset between the peeler's closest position and the cloth, resulting in a residual heel. Depending on the available equipment train, either the discharge chute could be connected to a dryer, and the material discharged directly to the dryer, or the cake could be discharged into drums and transported to the dryer for further processing. The operating parameters of the peeler centrifuge such as the load size and the spin speed are adjusted according to the process requirements. For example, a lower spin speed may be chosen to isolate a compressible cake and to prevent the formation of a highly compressed cake, the heel of which might be difficult to remove.

FIGURE 35.16 Cross‐sectional representation of a horizontally driven peeler centrifuge.
35.2.2.2.2.2 Inverting Bag Centrifuge
Inverting bag centrifuges are horizontally or vertically rotating centrifuges incorporating an automatic discharge. Figure 35.17 shows the schematic representation of a horizontally rotating, inverting bag centrifuge. The order of operation in this centrifuge is very similar to the peeler centrifuge except for the mode of discharge. In this case, after completing the filtration and washing, the filter bag is stroked forward by a hydraulically controlled piston, turning the bag inside out, allowing the solids to be discharged. The filter bag is secured to the basket wall at the front end, preventing it from completely detaching from the basket. These centrifuges offer an efficient and faster cake removal as the bag is turned inside out.
FIGURE 35.17 Schematic representation of an inverting bag centrifuge during (a) deliquoring phase and (b) discharge phase.
Source: Derived from a model of Henkel, Inc.
35.2.2.2.3 Non‐Agitated Filter Dryers
These are similar to filter dryers except that they are not fitted with agitators. Figure 35.18 shows a schematic representation of a non‐agitated filter dryer in closed and cross‐sectional views. The absence of an agitator may necessitate manual mixing of the cake during washing and drying, for content uniformity. In case of crack formation in the cake, the lid needs to be opened to manually smooth the cake. For this reason, operating a non‐agitated filter dryer requires more personal protection (such as full suit, face shield, supplied breathing air, etc.) for the operator to avoid material exposure. Non‐agitated filter dryers are usually fitted with a jacket.
FIGURE 35.18 Non‐agitated filter dryer in (a) closed position and (b) cross‐sectional representation.
35.2.2.3 Equipment Selection
The specific equipment is selected for isolating a material based mainly on the nature of the slurry. The following are the factors that could affect the decision on the equipment selection:
- Compressibility of the cake.
- Susceptibility of the cake to agglomerate upon agitation.
- Susceptibility of the cake to attrite upon agitation.
- Nature of the wet cake to crack during isolation/washing.
- Nature and availability of the equipment train.
- Environmental health and safety impact of the exposure of solids.
Table 35.2 compares the merits and demerits of the equipment discussed above.
TABLE 35.2 Merits and Demerits of the Conventional Isolation Equipment
| Filter | Agitated Filter Dryer | Non‐Agitated Filter Dryer | Centrifuge |
| Driving force | Pressure/vacuum | Pressure/vacuum | Centrifugal force |
| Filter medium | Filter cloth, sintered metal screens | Filter cloth, sintered metal screens | Filter bag |
| Operating parameters | Load size, applied pressure | Load size, applied pressure | Load size, spin speed, feed rate |
| Robustness | High | Medium | Medium |
| Washes possiblea | Reslurry, displacement | Displacement | Displacement |
| Advantages |
|
|
|
| Disadvantages | Heel removal is difficult |
|
|
aReslurry and displacement washes are defined and discussed in the Section 35.2.3.3.
35.2.3 Design
35.2.3.1 Data Collection and Modeling of Filtration
Several data could be collected from laboratory filtration experiments to assess the potential performance of filtration on scale. These include data from Buchner funnel filtration, leaf filtration experiments at single and multiple pressures, laboratory‐scale centrifugation experiments, and pilot plant‐scale pressure and centrifugation filtrations.
Filtration modeling is performed (i) to use the laboratory data to estimate cake properties and (ii) to predict the filtration performance in the plant by using the estimated cake properties.
35.2.3.1.1 Buchner Funnel Filtration: First‐Order Approximation
As mentioned earlier, Buchner funnel filtration is performed when there is no requirement for extensive data collection. It is possible only to record the total amount of filtrate collected (V) and the total time (t) to complete the filtration at a single differential pressure (vacuum driven either through a vacuum pump or house vacuum). An average filtrate flux could be calculated from V, t, and the filtration area. The average filtration flux (L/m2h) obtained from a Buchner funnel filtration is sufficient to estimate the average‐specific cake resistance (![]() ) by using Eq. (35.8) as a first‐order approximation. An approximate Rm could be used for this calculation. Eq. (35.8) can be rearranged as follows:
) by using Eq. (35.8) as a first‐order approximation. An approximate Rm could be used for this calculation. Eq. (35.8) can be rearranged as follows:

where
- M = CV = mass of dry solids (kg)
The pilot plant filtration performance (filtration flux and cycle time) can then be calculated by using the estimated ![]() and the pilot plant operating parameters such as differential pressure (ΔP), filtration area (A), and batch size (M). Since, in typical pharmaceutical separations, the medium resistance is negligible when compared with the cake resistance, estimation of specific cake resistance through this approach by using an approximate low Rm is fairly reasonable. It should be noted that
and the pilot plant operating parameters such as differential pressure (ΔP), filtration area (A), and batch size (M). Since, in typical pharmaceutical separations, the medium resistance is negligible when compared with the cake resistance, estimation of specific cake resistance through this approach by using an approximate low Rm is fairly reasonable. It should be noted that ![]() has been estimated from a single data point obtained by conducting filtration at a single pressure. Hence, it is not possible to calculate the compressibility index of the cake through this approach.
has been estimated from a single data point obtained by conducting filtration at a single pressure. Hence, it is not possible to calculate the compressibility index of the cake through this approach.
35.2.3.1.2 Leaf Filtration: Usage of t/V at a Single Pressure
With the help of balances equipped with automated data collection, the instantaneous filtrate volume at a particular time interval could be collected during leaf filtration experiments at multiple pressures. However, in cases of limited material availability, data from filtration at a single pressure may be used to calculate the cake properties more accurately when compared with Buchner funnel filtration. Equation (35.7) can be rearranged as follows:
From the t vs. V data, t/V can be plotted against V to obtain a straight line, the slope of which is μαC/2A2ΔP and the intercept is μRm/AΔP. With all the other parameters such as μ, C, A, and ΔP known, α and Rm can be calculated. Pilot plant filtration performance can then be estimated using the similar approach described earlier. Compressibility index cannot be calculated through this set of data.
35.2.3.1.3 Leaf Filtration: Usage of t/V at Multiple Pressures
Inverse filtration rate (t/V) data at multiple pressures is the most complete data set required to calculate the cake properties including the compressibility index. Equation (35.9) can be modified as
After calculating α and Rm for the individual differential pressures as explained above, ln(α) can be plotted against ln(ΔP) to obtain a straight line. The slope of this straight line is the compressibility index (n) and the intercept is ln(αo).
Even though this approach is more complete and reliable, the previous two approaches can also be beneficial in cases of limited data.
35.2.3.1.4 Leaf Filtration: Filtration over Heel/Cake Washes
Cake washes are typically performed when the cake is already deposited and the clean solvent is filtered through the deposited cake to displace the mother liquor. In often cases, crystal slurry is also filtered over the heel from the previous batch. Pilot plant performances of these cases can also be predicted by using similar equations. Equation (35.8) can be given as
where
-
 , in the case of slurry filtration over a clean filter cloth.
 -
 , in the case of slurry filtration over a heel.
 -
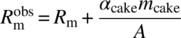 , in the case of a cake wash.
In the case of a cake wash, the term M (= CV) in Eq. (35.17) is zero as the concentration of API in wash solvent is zero.
35.2.3.1.5 Laboratory and Pilot Plant Centrifuge Filtration
A similar set of data is collected from laboratory and pilot plant centrifuges as the pressure filtration. Spin speed (rpm) and feed rate (kg/h) are the only two parameters required in addition to the data set of t vs. V collected from a leaf filter at multiple pressures. Spin speed can be collected through the motor of the centrifuge, and the feed rate can be collected through a mass flow meter, radar, or load cell.
t vs. V data from leaf filtration is sufficient for estimating the specific cake resistance as discussed previously. In addition to α, for modeling a centrifuge operation in the pilot plant, the slurry feed rate and the centrifuge spin speed need to be optimized for the following constraints: (i) to minimize centrifuge vibration, (ii) to maintain uninterrupted filtration for completing a load, (iii) to evenly distribute the cake, (iv) to minimize compression of the cake (in the case of compressible cakes), and (v) to prevent the formation of the standard wave. In simplified terms, Eq. (35.12) can be used for this purpose in a similar fashion as described for pressure filtration.

FIGURE 35.19 t/V versus V profiles of all the three crystallization streams.
35.2.3.2 Troubleshooting
35.2.3.2.1 Heel Removal
The formation of a heel may be an unavoidable problem in cake filtration in most of the equipment, except in cases such as inverting bag centrifuges. As discussed earlier in this chapter, the offset between the agitator or peeler and the filter medium results in the formation of a heel. The next load/batch could be filtered over the heel from the previous load/batch as long as it does not adversely affect the filtration performance, but the heel would become the primary filtration medium for the next load. For compounds with low toxicology profiles, a manual removal of the heel is a viable option. However, for compounds with high potency/toxicology profiles, removal of a heel in filter dryers/centrifuges needs an additional unit operation involving the dissolution of the cake in a solvent and passing the solution through the filter cloth. In modern‐day centrifuges, there are provisions such as blowing compressed nitrogen from behind the cloth to remove the heel. Another possible solution in a centrifuge is to loosen the heel by rewetting it with wash solvent and discharging it.
35.2.3.2.2 Filter Medium Blinding
The filter medium may play an important role in determining the filtration performance. At the beginning of the filtration process, the filter medium retains the solid particles while allowing the filtrate to pass through. The cake that is formed on the medium as a result then does most of the filtration. However, in some cases it has been observed that the filtration performance on a used filter medium is significantly different from that on a new one. This behavior could be observed even in the absence of heel over the medium. This is called “filter medium blinding” [4]. It results from clogging of the pores by the solid particles, thereby preventing the free movement of the filtrate through the pores as originally observed in a new medium. Due to this blinding, the initial medium resistance for the next batch/load might rise. Figure 35.20 shows the effect of filter cloth blinding on the medium resistance. From this figure, it is clear that the filter medium resistance increased gradually over the number of filtration cycles.

FIGURE 35.20 The effect of filter cloth blinding on the filter medium resistance.
Source: Reprinted with permission from Weighert and Ripperger [4]. Copyright 1997, with permission from Elsevier.
It is generally not possible to remove blinding through mechanical agitation or by passing compressed gas (nitrogen or air) through the medium, as it could result in permanently damaging the medium, rendering it unfit for use for the next batch/load. A typical solution for this problem is to use a solvent to dissolve off the entrained solid particles.
35.2.3.2.3 Cake Cracking
In many cases, mostly after the deliquoring step, cake cracking is observed. In cases where a complete removal of the mother liquor (along with the unreacted starting material, reagents and by‐products) is relied upon by washing the wet cake, cake cracking may pose a detrimental effect on the quality of the batch. Cracking of the cake results in the formation of various channels. When washed with solvents without reslurrying the cake, the wash solvents tend to pass through these channels (paths of least resistance), leaving many parts of the cake unwashed. Cake cracking becomes more frequent when the average porosity of the cake is high [8], resulting in the formation of channels. The presence of cracks could be identified by (i) visual inspection through the sight glass, (ii) monitoring the filtrate flow (an abnormally fast deliquoring could be a sign of cracking), and (iii) measuring the purity of the cake, and the presence of a washable impurity in the cake could be another sign of an inefficient washing possibly due to channeling. This problem is commonly solved in the pharmaceutical industry by smoothing the cake before initiating the wash sequence. This smoothing action eliminates the channels allowing the wash solvent to filter/wash through the cake more uniformly.
35.2.3.2.4 Compressible Cake
Compressible cakes may adversely affect the filtration performance if high pressures (pressure filtration) or high spin speeds (centrifugal filtration) are used. In addition to slow filtration, difficulty in discharging the wet cake and formation of hard agglomerates are other possible detrimental effects of a highly compressed cake.
35.2.3.3 Cake Wash Design
Proper design of cake washing is imperative to obtain the API with acceptable purity/impurity specifications. Typically, the main objective of a cake wash is to displace/remove the mother liquor from the cake. Removal of the mother liquor facilitates the following:
- Removal of unreacted/excess reagents, by‐products, and impurities rejected by crystallization.
- Removal of the crystallization solvent in case of significant product solubility at the anticipated drying temperature. This consideration is critical to prevent the redissolution of the product crystals in the crystallization solvent resulting in the potential formation of agglomerates upon the evaporation of the residual crystallization solvent during drying.
- Removal of color from the cake if needed.
There are mainly two types of cake washes: reslurry and displacement. In a reslurry wash, after introducing the solvent, the wet cake and the solvent are agitated into a slurry again and then filtered. In a displacement wash, the solvent is introduced on top of the wet cake, and the filtration is started to initiate a pluglike flow of the wash solvent through the cake to displace the mother liquor. When agitation is available, the overall cake wash is performed in the following sequence: displacement wash, reslurry wash, displacement wash (DRD).
There are various factors that need to be considered to design and develop an efficient cake wash in order to attain the abovementioned objectives. In typical cases, the crystallization solvent is the preferred solvent for cake washing and is generally used to displace the mother liquors even when a different solvent is implemented for other reasons. The following are considerations for choosing a solvent for the cake wash:
- Identification of a suitable solvent that will have maximum solubility of the unwanted impurities. A low solubility might crystallize those impurities along with the already crystallized product.
- The solvent should have minimum solubility of the product to prevent product loss to the washes. However, a solubility drastically different from the mother liquors may result in the nucleation of material with high impurity levels.
- The viscosity of the wash solvent should be minimal to afford a fast enough filtration such that the overall cycle time of the process is not extended.
- The thermal stability of the product in the presence of the residual wash solvent should be assessed under drying conditions.
- The thermal behavior (boiling point) of the wash solvent.
35.2.3.3.1 Volume Considerations for Cake Washes
In principle, the volume of displacement wash required to displace the mother liquor should be estimated by the cake height and the coaxial mixing that occurs at the front end of the wash as it traverses the cake in a plug flow. Generally, however, the risk of channeling is too high, and as a rule of thumb, the solvent volume should be equal to at least thrice the volume of wet cake. In general terms, a reslurry wash requires more solvent than a displacement wash. If the isolation is performed in multiple loads, the cake wash volumes should be adjusted accordingly. This is true for both pressure filtration and centrifugation.
35.2.3.3.2 Uniform Washing
To facilitate an efficient cake wash, care should be taken to ensure a uniform wash of the entire cake bed. Even though there are various approaches (such as spray balls, mists, or weirs) available to spray the solvent evenly across the surface of the cake, care should be taken to ensure that the cake surface is adequately smoothed to prevent (i) more solvent stagnating on troughs and (ii) channeling of the wash solvent through cracks formed across the bed. These two factors might cause uneven washing of the cake, increasing the likelihood of inefficient washing of some parts of the cake.
In‐process controls could be put in place to ensure the complete removal of the impurities and mother liquor. Possible controls include parameters such as purity, color, and pH. However, the accuracy of these methods is directly related to the uniformity of the wash.
35.2.4 Summary
A thorough understanding and proper design of the filtration unit operation is imperative in the pharmaceutical industry to yield a high quality product. Optimizing crystallization and filtration parameters to achieve an efficient filtration might also help in reducing the cycle time for the overall manufacturing process. Use of laboratory filtration data in the filtration equations derived from Darcy's law provides a prediction of the filtration performance upon scale‐up in pilot and manufacturing plants. There is an array of isolation equipment available with various sizes and operating parameters intended for laboratory, pilot plant, and manufacturing scales. An efficient cake wash design also aids in enhancing the product quality and the process yield.
35.3 DRYING
35.3.1 Background and Principles
Drying is an integral part of the isolation process and is important for the production of consistent and stable product. It is especially important in the case of the API where product properties can have a direct impact on product performance and the levels of residual solvent are considered a regulatory specification. Drying is basically a complex distillation carried out in a heterogeneous system involving solid, liquid, and vapor. Distillation involves vaporization of solvents from the liquid phase, the same phase transformation that in drying removes the solvents from “wetted” solids that were retained following the filtration process. One of the primary objectives of a drying operation is the removal of solvent to meet specifications in the product. In the case of API, the acceptable levels of residual solvent may be set according to safety (solvent toxicity), regulatory, or stability requirements (see Chapter 44). For earlier pharmaceutical intermediates, these specifications may be set according to the tolerance of solvents in chemistry steps that are immediately downstream of the drying operation. For APIs, another key objective of drying is to either achieve or maintain a specified crystallographic form. In most cases, the required form may have been produced during crystallization of the product, and it is important not to effect a change in form during the drying operation. In some cases, the required form may not be readily accessible through direct crystallization and is more practically obtained during the drying operation.
In pharmaceutical processing, the drying operation is almost always preceded by filtration. The output from filtration is referred to as wet cake since it contains solvent (typically 5–50%), and the output from a successful drying operation is referred to as dry cake since it usually contains only trace levels of residual solvent. A typical drying operation consists of the following general steps. The wet cake is charged/loaded into the dryer, which is then heated in order to vaporize the solvent. The dryer is often equipped with a vacuum pump connected to the vessel's vent line, and the vaporized solvent is removed through this line for downstream recovery, which is typically done by means of a condenser. Alternatively, and sometimes in combination with the vacuum operation, a continuous stream of inert carrier gas is passed through the dryer to sweep the vaporized solvent through the vent line. When the material is dry, it is discharged/unloaded from the dryer and packaged.
35.3.1.1 Phase Equilibria
Since drying involves the vaporization of solvents, the vapor pressure, enthalpy of vaporization, and in some instances molecular diffusivity of the solvent are fundamental properties defining the drying operation. For some solvents, the boiling point will be beyond the operational range that can be achieved in a plant dryer, so the pressure in the dryer is reduced to effect a decrease in the boiling point. Often, pharmaceutical compounds are unstable at elevated temperatures and must be dried at lower temperatures, which may also require reduced pressures. Hence, it is useful to understand the relationship between vapor pressure and temperature. The Antoine equation (shown below) provides a reasonable estimation of the vapor pressure of pure solvents:
where
- Psat is the vapor pressure.
- T is the temperature.
The constants A, B, and C are empirically determined constants that are readily available for many solvents.
This relationship is used to estimate the pressure required to bring the drying operation within the limits of the dryer's capabilities (or the product's stability) for the particular solvent that is being removed. For more accurate representation of vapor pressure data over a wide temperature range, an equation of greater complexity such as the Riedel equation could be used [9]. However for most applications in the pharmaceutical industry, the Antoine equation provides a satisfactory approximation.
Figure 35.21 shows some examples of the vapor pressure versus temperature relationship for common solvents used in the pharmaceutical industry. Solvents with an equilibrium curve to the right of n‐heptane are generally harder to remove in a drying operation. When the temperature at which drying is performed is above the boiling point of the solvent, the drying rate is typically increased significantly until mass transfer of the solvent becomes the rate‐limiting step.
FIGURE 35.21 Example vapor pressure chart generated using Antoine's equation.
When a solid material is held in an environment with constant temperature and humidity, it will reach steady‐state equilibrium with respect to its moisture content. The equilibrium moisture content is the limit of the water content that the material can retain under specific conditions of temperature and humidity. Materials encountered in drying operations can either be hygroscopic (e.g. porous materials) or nonhygroscopic (e.g. nonporous materials); however, typical pharmaceutical compounds are nonporous and do not exhibit significant moisture (or other solvent) movement unless they exist as hydrates (or solvates).
35.3.1.2 Drying Mechanisms/Periods
Several mechanisms are involved during a drying operation, and the drying process can be divided into different stages that reflect the mechanism that dominates the rate of solvent removal. Initially, drying is generally slow during the warm‐up period as the system reaches steady state. Following this stage, drying may be faster during the heat transfer limited period, after which the rate of solvent removal may become considerably slower as the system becomes mass transfer limited near the end of the drying process. These mechanisms are described in more detail below.
The drying process can be monitored by following the solvent content versus time. The data can then be presented in several ways to determine when different drying mechanisms are dominant. These plots are called drying curves, and an example schematic is shown in Figure 35.22. The first curve (Figure 35.22a) shows a typical drying curve for solvent content, W versus t. In the second curve (Figure 35.22b), the derivative of W with respect to t (i.e. the change in solvent content versus time or the drying rate) is plotted against time. In the third curve (Figure 35.22c), the drying rate is plotted against the solvent content. From each of these curves, distinct stages or periods can be identified and are denoted by points A through E in Figure 35.22 [9].
FIGURE 35.22 Typical drying curves.
Source: Adapted from R. H. Perry [9].
35.3.1.2.1 Jacket Warm‐Up Period
The period between A and B is called the warm‐up period and accounts for the time taken for the system to heat up toward the target set point of the jacket temperature controller. At this point, drying will proceed as solvent saturating the surface of the solids is vaporized. Under reduced pressure, this vapor‐phase solvent would be continuously removed through the dryer vent. In the case where reduced pressure is not used, a continuous gas flow (i.e. sweep) through the dryer is utilized to ensure that vaporized solvent is removed through the dryer vent with the inert carrier gas (e.g. nitrogen). Under vacuum conditions, the cake will often cool down to below its original temperature due to the energy transfer associated with the solvent enthalpy of vaporization. In this case, the cake temperature will increase back to the jacket set point temperature when drying is essentially complete and all the solvent has been vaporized.
35.3.1.2.2 Constant Rate Period
The period between B and C is typically characterized by a constant drying rate (as can be seen from the second and third drying curves in Figure 35.22). The drying mechanism during this period is dominated by heat transfer, and the drying rate is usually limited by the rate of heat transfer to the system. During this period, solvent that has saturated the surface of the solids is rapidly vaporized. The driving force during this constant rate period is the temperature difference between the dryer jacket set point and the temperature of the solvent being removed (at the system pressure). The drying rate can hence be increased by either increasing the jacket temperature set point or decreasing the pressure (i.e. to decrease the boiling point). It is important to note that the rate of solvent removal is also dependent on the size of the vacuum pump. If the pressure setting is too low, the rate of solvent vaporization may exceed the capacity of the vacuum pump to remove solvent from the system. In this case, the system settles at a higher pressure than the desired set point, and the drying rate is determined by the vacuum pump flow rate rather than the heat transfer rate. For the drying rate to be controlled by the heat transfer rate, the vacuum pump must be appropriately sized for the system so that it imposes no limitations on solvent removal from the dryer. As would be expected, the drying rate is also affected significantly by the surface area available for heat transfer. As the cake dries, this area is reduced; however, agitation of the cake exposes “fresh” solvent to the heated surface and increases the area for heat transfer. Hence, agitation of the cake allows for an increase in the area available for heat transfer.
35.3.1.2.3 Falling Rate Period
At the point C, solvent is no longer abundant on the solid surface: i.e. the surface becomes unsaturated, and the drying rate begins to fall. This point is typically called the critical moisture content. Note that the term “moisture” derives from historical convention when early drying studies were carried out with water, but the concept of a critical transition point applies to any solvent system. The critical moisture content is a property of the material being dried that also depends on the thickness of the material and the relative magnitudes of the internal and external resistances to heat and mass transfer. In some cases, it could also be a function of the total surface area of the solid phase and hence the particle size [3]. It is important to take into account possible variations in the value of the critical moisture content during scale‐up of a drying process.
During the period from C to E, heat transfer no longer becomes the limiting mechanism for drying. Instead, mass transfer becomes the dominant mechanism limiting the rate of solvent removal from the heated surface. As a result, the drying rate is typically observed to fall as depicted in the second and third drying curves of Figure 35.22. In some cases, the decrease in the rate of drying can become significant and lead to extremely long drying times. At some point during the falling rate period, the solvent present on the surface is depleted, and solvent present inside the internal structure of the solids remains (either as a solvate or an occluded solvent that may not be removable). The drying rate is then determined by the movement of this internal solvent to the heated surface for vaporization. This transition is given at point D and can sometimes be seen by plotting the drying rate versus the solvent content as shown in the third drying curve of Figure 35.22. It is important to note that this solvent migration is extremely difficult to model and may not be a feature clearly visible on many drying curves.
35.3.1.3 Effect of Wet Cake Properties
For any process operation, it is important to understand the properties of the input to the operation, and drying is not an exception. Careful analysis of the wet cake used in the drying process can provide insight into common problems faced during drying. There are properties of the wet cake that can have significant impact on the drying operation, such as the particle size distribution, the particle morphology/shape, and the solvent content. For example, the particle size distribution and the particle morphology can have a direct impact on the surface area available for heat transfer, while the initial solvent content will clearly affect the overall drying cycle time. Furthermore, the solvent(s) that the cake is wet with can impact both the drying cycle time and the final particle properties. A higher initial solvent content can result from inadequate deliquoring (removal of solvent), practical equipment limitations during filtration, or a propensity of the material to retain solvent even in extreme deliquoring conditions. The interactions between solvent and solid phases can have an impact on the degree of particle attrition and/or agglomeration and hence the final particle size distribution. In addition, the composition of the solvents and the resulting vapor–liquid–solid equilibria can have an impact on the final particle properties (see Section 35.3.3.4).
The final particle properties of an API product are important characteristics that must be carefully controlled. The mechanical impact of the drying operation is exceedingly difficult to model and predict, but recent work using torque measurements to calculate the total work imparted on the product can generate correlations to predict the final particle size of a given API [10]. Crystallization is a much better understood unit operation, and control of particle size distribution and morphology is typically achieved through careful design and execution of this unit procedure. The typical goal and general expectation for a drying process is therefore to have little to no impact on these particle properties and to attempt to maintain the same properties as the wet cake input.
35.3.2 Equipment
Typical dryers can be classified as either convective or conductive. Convective dryers operate by passing heated air or gas over or through the material to be dried. Some common advantages of these types of dryers are that they tend to keep the product temperature relatively low and they can be scaled up to large sizes fairly easily. Some disadvantages are that they tend to have poor energy efficiency and require elaborate dust collection/capture units on the gas effluent side [11]. In pharmaceutical plants, conductive (or contact) dryers are by far the most commonly used type. In this type of dryer, the product is in direct contact with a heated surface. Contact dryers are mostly used in batch mode and are often more energy efficient than convective dryers [11]. Some common types include vacuum tray dryers, filter dryers, rotary cone dryers, and tumble dryers. The discussion here on large‐scale equipment will focus on these types of dryers.
35.3.2.1 Laboratory Drying Equipment
It is often difficult to accurately simulate the drying process in the laboratory; however, there are some common types of lab‐scale equipment that can be helpful in providing guidance toward the selection of plant equipment, providing estimates of drying cycle time on scale, and determining equipment settings necessary to achieve design objectives.
Figure 35.23 shows an oven balance that can be used to determine a drying curve for a particular material. The setup consists of a temperature‐resistant balance, placed inside a vacuum oven. The balance is connected to a computer outside of the oven that captures the mass of the product as it is dried. The solvent content at any time can be calculated from the product mass. The oven balance is therefore useful for generating drying curves such as those shown in Figure 35.22 and hence determining the critical moisture content. One advantage of using an oven balance is that it is not an invasive technique: that is to say that significant and discrete samples of the product are not required; hence data can be collected on a very small scale. One disadvantage is that drying in an oven is a purely static process and provides no information on the effect of agitation on the material.

FIGURE 35.23 An oven balance used to generate drying curves.
The effect of agitation can sometimes be estimated using a pan dryer in the lab. A pan dryer is basically a closed jacketed vessel with an overhead motorized agitator with impeller blades. The jacket provides a heated surface to contact the product, and the impeller blades allow the cake to be agitated (or turned over). The product and jacket temperatures can be recorded using thermocouples that provide the temperature differential (the driving mechanism for solvent evaporation in the constant rate period), and the agitator power can be recorded using a torque meter. The shape, type, and size of the impellers in a pan dryer can be adjusted so that it is geometrically similar to the large‐scale plant dryers; however, the shear force exerted on the cake in a lab setup is typically an order of magnitude lower than that in large‐scale units used in plants. In order to simulate the shear forces in large‐scale plant dryers, weights can be placed on top of the cake in the lab scale to generate the same hydraulic pressure or normal stresses experienced in the large‐scale unit [10]. The drying process is typically faster in a pan dryer than an oven due to the larger relative surface area in contact with the material from the effect of agitation. The use of a pan dryer is often helpful in determining the effect of agitation on powder properties of the product (e.g. particle size). The impact of different modes of agitation (i.e. turning over the cake at intermittent intervals or continuously agitating the cake throughout the process) can also be examined in a qualitative manner.
A typical setup for using a pan dryer in the lab is shown in Figure 35.24. Here, the solvent vapor removed from the product is condensed outside the dryer and collected in a vessel located on a balance. This allows an estimate of the solvent content to be determined (from a mass balance) at any time during the process without the need to take discrete samples, especially if the balance is connected directly to a computer or data recorder. Figure 35.25 shows a modified setup incorporating the use of weights to simulate the level of shear the cake would experience in a large‐scale dryer [10, 12].
FIGURE 35.24 Typical laboratory setup.
FIGURE 35.25 Lab pan dryer with weight to simulate normal stresses typical of large‐scale dryer.
Source: Reprinted with permission from Remy et al. [10]. Copyright 2015, American Institute of Chemical Engineers.
35.3.2.2 Large‐Scale Drying Equipment
The four most common types of dryers used for pharmaceutical products are vacuum tray dryers, filter dryers, rotary cone dryers (or conical dryers), and tumble dryers. These units are shown in Figures 35.26–35.29, respectively.
FIGURE 35.26 Tray dryer.
FIGURE 35.27 Filter dryer.

FIGURE 35.28 Rotary cone dryer or conical dryer.
FIGURE 35.29 Tumble dryer.
A tray dryer (see Figure 35.26) is basically a large oven connected to a vacuum pump and/or an inert gas supply. Product is loaded onto metal trays that are placed onto shelves in the dryer. Samples can be taken only by opening the oven. When the product is dry, the final dry cake is unloaded manually from the trays into product containers/drums.
Filter dryers (see Figure 35.27) are similar to pan dryers with the main difference being that they are used to both isolate and dry the product. After filtration and washing of the product, the jacket of the dryer provides a heated surface, and the impeller is lowered into the cake to provide agitation. Filter dryers are usually also connected to a vacuum pump and typically have a sampling port on the side. The sampling port is comprised of a ball valve with a cup that is turned so that the orifice of the cup is facing the cake. The agitator is turned on to push a small sample of the cake into the cup. The ball valve is subsequently turned so that the cup faces the outside of the dryer and the contents of the cup are removed. Obtaining a significantly sized and representative sample of the cake can sometimes be challenging; however, this method provides a lower risk of exposure to the operator than attempting to access the cake directly.
A rotary cone dryer (also known as a conical dryer) is a jacketed dryer with an internal agitator (see Figure 35.28). The shape of the rotary cone dryer provides a larger surface area to volume ratio for contact drying than a filter dryer. A shaft that is permanently embedded within the cake provides the agitation and in some instances acts as a heat source as well. As the shaft turns, a screw built onto the shaft lifts the cake from the bottom of the cone to the top. In addition, the shaft itself orbits the vessel so that all parts of the cake can be turned over. Samples are typically obtained from the conical dryer via a sampling port similar to the one described for the filter dryer, and the temperature of the cake is measured by a temperature probe lance that extends down into the cake. Wet cake is charged into the top of the dryer, and dry product is discharged from a special port built into the bottom of the cone.
A tumble dryer (see Figure 35.29) consists of a rotating or tumbling vessel and is most commonly found in a double‐cone shape supported by two stationary trunnions. The vessel is surrounded by a heated jacket, and a small vacuum line is installed within one of the trunnions and extends into the vessel (angled in the upward direction). The dryer can also be equipped with a delumping bar that extends into the vessel from one of the trunnions. The double‐cone drying chamber rotates about the axis of the trunnions, causing the material to cascade inside. Through gentle tumbling and folding, the material is contacted with the heated wall to facilitate drying without a significant amount of shear being imparted to the material. Discharge from and cleaning of the tumble dryer is easier than other dryers since there are no internal shafts or agitators.
Other types of dryers that are available for use include fluid bed dryers and spray dryers. Fluid bed dryers are suitable for drying granular crystalline materials but not for very wet materials that have a pasty or liquid‐like consistency.
In a fluid bed dryer, a hot gas stream is introduced into the bottom of a chamber filled with the material to be dried. The gas stream expands the bed of material to create turbulence, and the solid particles attain a fluidlike state – a phenomenon known as fluidization. Heat transfer is extremely efficient and uniform since the solid particles are surrounded by hot gas, leading to fast drying times. The exhaust to the chamber is equipped with particulate filters to prevent the product from escaping the chamber.
Spray dryers are used to dry product that is either dissolved in a solvent or suspended as slurry. The liquid stream is dispersed into a stream of hot gas and sprayed via a nozzle into a cylindrical chamber (often with a conical bottom) as a mist of fine droplets. Solvent is vaporized rapidly to leave a residue of dry solid product particles in the chamber. It is important to ensure that particles of product are not wet with solvent when they touch the walls of the chamber and hence spray drying chambers tend to have large diameters. The heating period is very short; hence functional damage to the product is usually not an issue.
35.3.2.3 Equipment Selection
Selection of the appropriate type of dryer to be used is usually based on the objectives of the drying operation. Some typical objectives include minimization of drying time, achieving or maintaining powder properties (i.e. prevention of particle agglomeration), and maintaining crystallographic form. Table 35.3 shows some advantages and disadvantages for each of the dryer types discussed that may be used for equipment selection.
TABLE 35.3 Advantages and Disadvantages of Typical Dryers
| Dryer Type | Advantages | Disadvantages |
| Tray dryer | Simple operation Easier to scale‐up Easier to sample Easier to clean |
Labor intensive Long drying times Poor uniformity Operator exposure |
| Filter dryer | No product loss after isolation Various agitation modes Lower risk of exposure |
Difficult to sample Agglomerate formation Particle attrition Difficult to scale up |
| Conical dryer | Active agitation Good homogeneity Lower risk of exposure |
Difficult to sample High particle attrition Difficult to scale up |
| Tumble dryer | Simple operation Easier to clean Lower capital cost Suitable for shear‐sensitive materials |
Lower efficiency Material must be free flowing Long drying times |
| Fluid bed dryer | Good homogeneity Lower risk for agglomeration Short drying times |
Unsuitable for pasty or liquid materials Product recovery may be required from exhaust High volumetric consumption of inert gas |
| Spray dryer | Suitable for heat‐sensitive materials Good product uniformity Combines crystallization and drying |
Liquid or slurry feed required Difficult to control bulk density High volumetric consumption of inert gas |
35.3.3 Design
The two primary concerns during scale‐up are powder properties and drying cycle time. Powder property control is important for APIs since particle size, particle morphology and solvate form can all be impacted by the drying operation. For intermediates, scale‐up is generally only a concern if there is a tendency to form hard macroscopic lumps during drying.
Scale‐up of drying operations is not well understood and similar performance between lab and plant equipment is often difficult to achieve, making the selection of the correct scale‐up parameters challenging. Data collection and modeling are important aspects to designing a drying operation and are discussed below.
35.3.3.1 Data Collection
The drying process is typically monitored using temperature and pressure since most dryers already have existing product temperature probes and pressure sensors installed. In the case of temperature, correct placement of the temperature probe in the drying cake is critical to obtaining reliable information from the data. It should be noted that during static drying, a temperature probe may not provide a good representation of the average temperature of the cake. Agitation of the cake may be required to get a representative measure of the bulk temperature. Alternatively, it can be helpful to have multiple temperature probes situated at different locations within the cake. This can be useful for both static and agitated drying.
Pressure and an estimate of the solvent flow from the dryer can help to monitor the stage of the drying operation and determine the endpoint. One possible way to identify when solvent is being vaporized is to monitor the position of the valve controlling the pressure of the dryer. As solvent is vaporized, it causes an increase in pressure in the dryer, and in order to maintain vacuum, the vacuum control valve in the dryer vent opens. So while solvent is being removed, the vacuum control valve remains open. When there is no longer a significant amount of solvent to create enough pressure in the dryer, the vacuum control valve begins to close until it reaches a position corresponding to the leak rate of the dryer setup. This movement of the vacuum control valve can be used as an indication of the end of the heat transfer limited period of the drying process. Figure 35.30 shows an example of how the vacuum control valve position starts to decrease from fully open (a value of 100%) as the pressure in the dryer approaches the vacuum set point. In this case, the position corresponding to the leak is approximately 35%.
FIGURE 35.30 Using pressure and vacuum control valve position to determine the endpoint of drying.
Drying is also typically monitored by estimating the residual solvent content of the drying solids and is accomplished by either a direct measurement or by inference from surrogate process parameters. Direct measurement methods include loss on drying (LOD), gas chromatography (GC), and Karl Fischer (KF) coulometric or volumetric titration.
An LOD instrument rapidly heats up a sample of the solids to a temperature high enough to vaporize most solvents at atmospheric pressure (typically 120 °C is used). The sample is then held at this temperature for approximately 30 seconds to ensure that any solvent is removed before cooling back to ambient temperature. The mass of the sample before and after heating is recorded and the change in mass is expressed as a fraction of the starting mass to obtain the final LOD result.
GC also directly measures the content of volatile materials in a sample. A priori calibration of the GC measurements with solvent standards is typically required.
KF titration is a technique that is used specifically to determine the water content of a sample. Residual water down to the parts per million (ppm) range can often be detected using a KF instrument.
Estimating the solvent content using offline methods such as LOD, GC, and KF can have potential drawbacks. Firstly, these methods are “obtrusive” as they may require significantly sized samples to be taken to obtain a representative and reproducible result; this may be a problem when carrying out drying studies in the lab in a small‐scale dryer. Furthermore, samples taken from a plant dryer may not be representative of the bulk material, depending on the location and size of the sampler. Another important disadvantage of taking samples is the risk of exposure to operators and analysts. This is especially the case when the product being dried is toxic, as can be the case for many pharmaceutical intermediates. It is therefore desirable to utilize online monitoring techniques to minimize or even eliminate the need to take samples from a dryer. Online techniques can also reduce the analysis time associated with many offline methods used to determine drying endpoint. Brief introductions to some of these online methods are given below.
Mass spectrometry (MS) has gained popularity recently and is particularly useful when different solvents are being removed from the cake. The vent of the dryer is sampled for the vapor content, and molecular masses of ionized species in the vapor are determined. The intensity of identified peaks obtained from a mass spectrum enables the determination of solvent ratios, and through the use of standards and appropriate calibration, solvent amounts can also be determined.
Spectroscopic methods including infrared spectroscopy (IR), near‐infrared spectroscopy (NIR), and Raman spectroscopy depend on quantification of the solvent content relative to the solid phase (for contact measurements, i.e. direct contact of the probe with the cake) or quantification of the vapor stream leaving the dryer vent. These methods have been successfully implemented in many pharmaceutical processes to monitor drying operations [13].
Raman spectroscopy can also be used to determine if the solids have undergone a form transformation during the drying operation. This technique uses vibrational information to provide a fingerprint for the chemical environment of a molecule that is sensitive to its crystallographic arrangement.
The removal of water during drying can be monitored using a dew‐point hygrometer that is typically installed in the vent line between the dryer and the vacuum pump. The partial pressure of water in the vapor from the dryer is calculated through the use of dew‐point/frost‐point tables. In cases where it is important to control the hydrate form of the product, the partial pressure of water can then be used to calculate the relative humidity of the vapor stream [14].
An off‐line technique frequently used to characterize the crystal structure and detect changes in morphology or hydrate/solvate forms is X‐ray powder diffraction (XRPD). Peaks associated with different crystallographic faces can be identified in the pattern from an XRPD measurement. The existence of different polymorphic forms will result in the appearance of new or shifted peaks in the pattern and a fingerprint pattern can be established for each particular form. As with other off‐line techniques, the disadvantage of XRPD is that it is an analytical technique that must be carried out on samples that have been taken of the drying cake that may not be representative of the bulk material in the dryer.
35.3.3.2 Modeling of Drying
Modeling the rate at which solvent is removed from the drying cake can be useful to determine optimal parameter settings for the dryer or to choose the appropriate equipment. To model the drying process, mass and energy balances must be carried out on the system. By coupling these two balances, it is possible to calculate the solvent content of the cake at any time and hence the drying rate. A simple static drying model [3] is presented here that should enable simulations of the constant rate period and falling rate period to be run, given some basic information about the system. For more complex drying models, the reader is referred to more detailed treatments proposed in the literature [15, 16].
Consider a bed of product wet cake in a static dryer where the cake is in contact with a wall heated by a jacket service. The heat transfer rate from the jacket to the cake (![]() ) is given by the heat transfer coefficient (U), the area available for heat transfer (Aht), and the difference between the dryer jacket temperature (Tj) and the vaporized solvent temperature (T), which is related to the operating pressure by Antoine's equation:
) is given by the heat transfer coefficient (U), the area available for heat transfer (Aht), and the difference between the dryer jacket temperature (Tj) and the vaporized solvent temperature (T), which is related to the operating pressure by Antoine's equation:
At steady state, the heat transfer rate from the wall into the cake is completely consumed by solvent vaporization, giving the following equation for the mass transfer rate of solvent during the constant rate period (![]() ):
):
where
- ΔHvap is the heat of vaporization of the solvent.
The mass transfer rate of the vapor allows calculation of the rate of change of solvent content in the cake versus time.
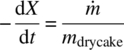
In Eq. (35.21), X is the solvent content in the cake per unit mass of dry cake, and mdrycake is the final mass of dry product cake obtained. Substituting Eqs. (35.19) and (35.20) into Eq. (35.21) and integrating allows calculation of the drying time during the constant rate period (tC):

where
- X1 is the initial solvent content.
- XC is the critical moisture content.
Below the critical moisture content, the model must be modified to take into account the fact that the drying rate is no longer controlled by the heat transfer rate. As an approximation, the mass transfer rate of the solvent can be assumed to be proportional to the solvent content in the falling rate period [3]:
where
- a is a proportionality constant that may be related to the molecular diffusivity of the solvent.
By substituting Eq. (35.23) into Eq. (35.21) and integrating, the drying time during the falling rate period (tF) can be estimated:
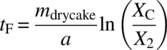
where
- X2 is the final solvent content at the end of drying.
Equations (35.22) and (35.24) can be combined to calculate the total drying time (tT) for the process:
Given the pressure set point, jacket temperature, dryer heat transfer coefficient, enthalpy of vaporization, and critical moisture content, the equations can be used to generate solvent content profiles as a drying operation proceeds. Alternatively, experimental data on the solvent content profile versus time can be used to determine the critical moisture content and/or the value of the constant a through a data fitting approach. Example simulations based on these equations are shown in Figure 35.31, where the DynoChem® software application was used to solve the equations in conjunction with complete material and energy balances. The simulations were carried out under identical operating conditions (Tj = 60 °C, Tinitial = 20 °C, P = 150 mbar, UA = 10 W/K, X1 = 1 kg/kg, XC = 0.15 kg/kg, X2 = 0.0101 kg/kg, mdrycake = 5 kg, and a = 0.1 min−1) for five typical solvents. The results illustrate the impact of solvent properties on drying performance and hence wash solvent choice during upstream isolation.
FIGURE 35.31 DynoChem® simulations of the model equations for drying. (a) Solvent content vs. time. (b) Drying rate vs. time. (c) Drying rate vs. Solvent content. (d) Cake temperature vs. time.
The charts in Figure 35.31a–c are typical drying curves that can be obtained from the model equations, and the transition from the constant rate period to the falling rate period is clearly visible. The deviation from expected behavior seen for some of the simulations at the start and near the critical moisture content is related to the choice of numerical integration parameters in DynoChem. Comparison of the profiles for each of the solvents shows that more volatile solvents such as acetone and ethyl acetate are removed very rapidly relative to less volatile solvents such as water that can take a prohibitively longer time to dry (in fact the water simulation does not reach the critical moisture content until ~84 hours). The chart in Figure 35.31d shows that the cake temperature reaches a steady‐state value corresponding to the boiling point during the constant rate period. At the transition point, the temperature starts to increase toward the jacket set point (in this case 60 °C). When the boiling point of a volatile solvent is below the initial system temperature, the cake will be cooler than the initial temperature for the duration of the constant rate period. According to Antoine's equation, this behavior should be expected when the system pressure is set low enough that the boiling point of the solvent is below the initial conditions. In this case, the saturation temperature of acetone is just below 10 °C at a pressure of 150 mbar, so the cake is seen to cool down from an initial temperature of 20 °C, until the end of the constant rate period.
An important point to note is that the model does not take into account the effect of agitation that would lead to the redistribution of “wet” and “dry” portions of the cake effectively changing the area available for heat transfer (above the critical moisture content). An approach to describe the effect of agitation on heat transfer during drying has been proposed in the literature [17]. Random particle motion during agitation is represented by an empirical mixing parameter known as the mixing number. This parameter essentially represents how many revolutions of the agitator are necessary to achieve full turnover or redistribution of the wet and dry zones in the cake so that they can no longer be distinguished as separate zones on either side of a drying front moving through the cake. The larger the value of the mixing number, the less efficient the mixing provided by the agitator. The drying rate was shown to be sensitive to the mixing number in the case of finely grained particles, and the reader is referred to the original reference for a more detailed description of how to use this approach for agitated systems [17].
35.3.3.3 Form Control
Hydrates, solvates, or other forms may require careful control of humidity or other drying parameters. In the case where the product is a hydrate and the hydration level needs to be maintained during drying (i.e. to avoid the loss or gain of water from the crystals), the relative humidity in the dryer must be controlled carefully. The composition of wash solvents prior to drying can be critical to ensure that there is sufficient water in the cake during drying to avoid dehydration. The use of a dew‐point hygrometer in the vent line of a dryer can provide information on the relative humidity around the cake and can be used to monitor the removal of water during drying and ensure that the cake is not over dried [14]. In some cases, it may be helpful to charge additional water prior to or during drying to ensure that there is sufficient water present. The development of phase diagrams based on water activity can be used to design the appropriate conditions for maintaining a specific hydrate [18].
The same principles can be applied to maintain a certain solvate where a solvent other than water is bound within the crystal lattice of the product. In these cases, MS or NIR can be used to monitor the removal of critical solvents during drying.
Sometimes, the product crystals can undergo polymorph transformation during drying. In this case, offline techniques such as XRPD can be helpful to determine this after drying is complete. Online methods such as Raman spectroscopy can be used to monitor the cake while the cake is still drying to ensure that the product form is not changing. Polymorph transformation can be a result of shear and agitation, so this must be carefully controlled.

FIGURE 35.32 Solubility plot (on the left) showing the relative solubility of the IPA solvate and the monohydrate at different water contents (although the data was collected at 40 °C, the results are applicable at all temperatures – see monotropism) and an x–y‐diagram (on the right) for IPA/water showing the existence of a minimum boiling azeotrope at 12 wt % water.
Source: Reprinted with permission from Cypes et al. [14]. Copyright 2004, American Chemical Society.
35.3.3.4 Troubleshooting
There are some common challenges faced during drying that we discuss below.
35.3.3.4.1 Long Drying Times
Long drying times can cause significant bottlenecks in the overall process and is most often a result of a prolonged period under the mass transfer limited mechanism. Drying times can be improved by ensuring that most of the drying operation is carried out under heat transfer‐limited conditions and that both the driving force and the heat transfer area available are maximized as much as possible (within the constraints of product stability and equipment limitations). From Eq. (35.19), it can be seen that the difference between the jacket temperature and the product temperature provides the driving force for heat transfer and the heat transfer coefficient is equally as important. Static dryers such as a vacuum oven often do not provide enough surface area for heat transfer, whereas drying in agitated dryers can provide the benefits of increased surface area for heat transfer. Note that certain solvents such as water can be difficult to remove regardless of the equipment used, leading to longer drying times. Estimation of the critical moisture content in the lab and simulation of the drying process with a model can be helpful to ensure that appropriate operating conditions are used in the plant to achieve optimal drying cycle times.
An approach that is often used in manufacturing to reduce drying times is to flow an inert gas such as nitrogen through the drying cake. This strategy utilizes convection to remove residual solvent from the wet solids as the inert carrier gas passes through the cake. A strategy for scaling up this approach was proposed by Birch and Marziano [19], using a simplification of the Carman–Kozeny equation for flow through particulate beds [19]. In their work, they showed that the pressure drop across the cake is proportional to the specific gas flow rate (i.e. per unit cross‐sectional area) multiplied by the depth of the cake. The proportionality constant is a function of the void fraction of the solid bed, the particle diameter of the solids, and the viscosity of the solvent being removed. It can be determined by lab experimentation and assumed to have the same value on a larger scale if the physical properties of the solid being isolated and the wash solvent remain the same. The pressure drop needed to maintain a specific gas flow rate on scale can then be calculated for the larger‐scale bed depth to achieve the same rate of solvent removal [19]. Some important considerations when using a nitrogen blow‐through operation are that (i) a strong vacuum from the bottom/outlet side of the cake may be needed to ensure that the system is under enough reduced pressure to ensure vaporization of the solvent, (ii) there may be a constraint on the maximum operating pressure in the headspace of the dryer if the cake is susceptible to compression, and (iii) intermittent cake smoothing may be required to prevent channels from forming that could result in the inert gas bypassing the majority of the drying cake [20].
35.3.3.4.2 Agglomeration/Balling
Solid particles can sometimes aggregate to form hard agglomerates with solvent trapped inside (also known as balling). This problem is most often seen in agitated dryers and is generally worse in filter dryers. Agglomeration is often caused by agitating the cake too aggressively while it still contains a significant amount of solvent. Since agglomeration is a phenomenon that is not well understood and there are no specific guidelines on how to avoid the issue during drying, a general approach is to avoid agitation in the initial stages of the drying. One factor that may be important for avoiding the formation of agglomerates is the solubility of the product in the individual solvents that are being removed. Sometimes the cake has been washed with a mixture of solvents prior to drying and if there is enough solubility in one of these solvents by itself, the product could become partially dissolved that could lead to fusion of the crystals by the formation of solid bridges between them as the solvent is removed. One approach to avoiding agglomeration is therefore to adjust the solvent composition of the final cake wash to avoid the potential enrichment of highly soluble solvents during the drying operation. Agglomeration has been found to occur when the drying rate is high and the shear rate is relatively low [21, 22], indicating that there is a higher risk for agglomeration if agitation is applied during the initial stages of drying when the process is heat transfer controlled as opposed to mass transfer controlled. Indeed, there is often a critical amount of solvent, known as the “sticky point,” at which the tendency to form agglomerates may be maximal [12]. This is due to the presence of solvent capillary forces strong enough to cause particles to agglomerate together if agitation is applied, in a similar fashion to how particles stick together in a wet granulation process. Birch and Marziano ([19]) showed that the “sticky point” can be determined experimentally using mixer torque rheometry, since the torque required to maintain a constant rotational speed during agitation will increase as binder solvent is added to the solids until it is at a maximum value when the agglomerates are strongest (i.e. at the “sticky point”) [19]. The magnitude of the torque at this point is also an indication of the hardness of the agglomerates that are formed. However, a potentially more reliable estimate of agglomerate hardness (along with the extent of agglomeration) can be obtained by sieving samples of the solids [19]. Birch and Marziano [19] also showed that the “sticky point” depends upon the size of the particles present in the cake, with smaller particles requiring more solvent to bind them together due to higher specific surface area [19]. Once the “sticky point” has been determined, a drying protocol needs to be designed to avoid the application of agitation while the solvent content of the cake is above the “sticky point.” Since this could result in undesirably long drying times, the application of a nitrogen blow‐through operation (as described earlier) is typically used instead of agitation until the solvent content is below the “sticky point” [19, 20].
35.3.3.4.3 Particle Attrition
If the product crystals are sensitive to shear, agitation of the cake can lead to particle breakage and attrition. In these cases, maintaining a specified particle size during drying can then become a challenging aspect of the drying operation. Equipment selection and careful consideration of how the agitation will be operated are critical for ensuring particle size integrity. Based on the geometry of the equipment and how the agitator interacts with the cake, the force exerted on the particles should be considered. Particles are likely to experience less force in a tumble dryer as opposed to a filter dryer or conical dryer. When the use of a tumble dryer is not an option, lab studies to determine the maximum shear that the particles can endure before breakage becomes a problem can be carried out. The plant agitation protocol could then be scaled up based on maintaining a lower tip speed than the critical value. However, it is important to note that the ranges of tip speeds achievable in the lab often do not overlap with those achievable in the plant. Particle attrition has been shown to occur when the drying rate is low and the shear rate is high [21, 22], indicating that there is a higher risk for particle attrition if continuous agitation is applied during the later stages of drying when the drying rate is limited by mass transfer.
Remy et al. [10] correlated the impact of agitated drying on powder properties with the amount of work done by blades on the cake, which is determined by the normal stresses (hydrostatic pressure) and the bulk friction coefficient of the cake (affected by the degree of wetness). The publication demonstrated an experimental setup that allowed for the determination of the cake's bulk friction coefficient that in turn could be used to estimate the work exerted on the cake in different large‐scale equipment. From a laboratory setup, the impact on the powder properties at scale‐relevant conditions could then be evaluated.
35.3.4 Summary
Proper control of the drying process is important especially for API compounds whose solvent content, particle size, and final form need to meet specifications. Depending on the solvent system and the equipment being used, a drying operation can often have a long cycle time and become a bottleneck in the overall process. Agitation is helpful to avoid this issue but can lead to other problems such as agglomeration or attrition. It is therefore important to select the appropriate equipment and carefully design the operating conditions. The scale‐up of drying processes can be challenging due to the lack of understanding associated with some of the issues encountered; however, there are many tools and methods available for simulation, monitoring, and data collection that can be applied for design purposes.
REFERENCES
- 1. Darcy, H. (1856). Les Fontaines Publiques de la Ville de Dijon (“the Public Fountains of the Town of Dijon”). Paris: Dalmont.
- 2. Ruth, B.F., Montillo, G.H., and Montonna, R.E. (1933). Studies in filtration: I. Critical analysis of filtration theory; II Fundamentals of constant pressure filtration. Industrial and Engineering Chemistry 25: 76–82. 153–161.
- 3. McCabe, W.L., Smith, J.C., and Harriott, P. (2005). Unit Operations of Chemical Engineering, 7e. New York: McGraw‐Hill.
- 4. Weigert, T. and Ripperger, S. (1997). Effect of filter fabric blinding on cake filtration. Filtration and Separation 34 (5): 507–510.
- 5. Bird, R.B., Stewart, W.E., and Lightfoot, E.N. (2001). Transport Phenomena, 2e. Hoboken, NJ: Wiley.
- 6. Barr, J.D. and White, L.R. (2006). Centrifugal drum filtration: I. A compression rheology model of cake formation. AIChE Journal 52: 545–556.
- 7. Landman, K.A., White, L.R., and Eberl, M. (1995). Pressure filtration of flocculated suspensions. AIChE Journal 41: 1687–1700.
- 8. Rideal, G. (2006). Roundup. Filtration and Separation 43 (1): 36–37.
- 9. Perry, R.H. (1984). Perry's Chemical Engineer's Handbook, 6e. New York: McGraw‐Hill.
- 10. Remy, B., Kightlinger, W., Saurer, E.M. et al. (2015). Scale‐up of agitated drying: effect of shear stress and hydrostatic pressure on active pharmaceutical ingredient powder properties. AIChE Journal 61: 407–418.
- 11. McConville, F.X. (2004). The Pilot Plant Real Book: A Unique Handbook for the Chemical Process Industry. Worcester, MA: FXM Engineering and Design.
- 12. Papadakis, S.E. and Bahu, R.E. (1992). The sticky issues of drying. Drying Technology 10 (4): 817–837.
- 13. Burgbacher, J. and Wiss, J. (2008). Industrial applications of online monitoring of drying processes of drug substances using NIR. Organic Process Research and Development 12: 235–242.
- 14. Cypes, S.H., Wenslow, R.M., Thomas, S.M. et al. (2004). Drying an organic monohydrate: crystal form instabilities and a factory‐scale drying scheme to ensure monohydrate preservation. Organic Process Research and Development 8: 576–582.
- 15. Kohout, M., Collier, A.P., and Štĕpánek, F. (2006). Mathematical modeling of solvent drying from a static particle bed. Chemical Engineering Science 61: 3674–3685.
- 16. Michaud, A., Peczalski, R., and Andrieu, J. (2008). Modeling of vacuum contact drying of crystalline powder packed beds. Chemical Engineering and Processing: Process Intensification 47 (4): 722–730.
- 17. Schlünder, E.‐U. and Mollekopf, N. (1984). Vacuum contact drying of free flowing mechanically agitated particulate material. Chemical Engineering and Processing 18: 93–111.
- 18. Variankaval, N., Lee, C., Xu, J. et al. (2007). Water activity‐mediated control of crystalline phases of an active pharmaceutical ingredient. Organic Process Research and Development 11: 229–236.
- 19. Birch, M. and Marziano, I. (2013). Understanding and avoidance of agglomeration during drying processes: a case study. Organic Process Research and Development 17: 1359–1366.
- 20. Nere, N.K., Allen, K.C., Marek, J.C., and Bordawekar, S.V. (2012). Drying process optimization for an API solvate using heat transfer model of an agitated filter dryer. Pharmaceutical Technology 101 (10): 3886–3895.
- 21. Lekhal, A., Girard, K.P., Brown, M.A. et al. (2003). Impact of agitated drying on crystal morphology: KCl‐water system. Powder Technology 132: 119–130.
- 22. Lekhal, A., Girard, K.P., Brown, M.A. et al. (2004). The effect of agitated drying on the morphology of L‐threonine (needle‐like) crystals. International Journal of Pharmaceutics 270: 263–277.