
23
TOWARD A RATIONAL SOLVENT SELECTION FOR CONFORMATIONAL POLYMORPH SCREENING
Yuriy A. Abramov, Mark Zell+, and Joseph F. Krzyzaniak
Global R&D, Pharmaceutical Sciences, Pfizer, Inc., Groton, CT, USA
23.1 INTRODUCTION
Crystalline solids with the same chemical composition but different molecular arrangements in the crystal lattice are known as polymorphs [1]. Changes in polymorphic form during pharmaceutical development can have a negative impact on a drug’s performance, i.e. solubility and bioavailability (Chapter 22), chemical and physical stability, and mechanical properties. Therefore, it is necessary to identify the stable crystal form under normal manufacturing and storage conditions to ensure that this form does not change during the life cycle of the drug product.
Polymorph screens are conducted early in drug development to identify unique crystal forms of the active pharmaceutical ingredient (API). Each crystal form discovered is characterized to identify whether the crystalline phase is an anhydrous form or a solvate. The polymorphic lattice can also consist of either the same or different molecular conformations. Conformational polymorphism describes the latter case when different conformations of the same molecule occur in different crystal forms [2]. Solid‐state characterization studies are then conducted to develop an understanding of the stability relationship between all crystalline phases since the thermodynamically stable form is directly related to conditions (crystallization, environmental, and manufacturing) in which the API is exposed to during the drug development process [1].
During the preparation of the desired polymorphic form, the science of crystallization has shown to be a very complex phenomenon, which is dictated by interplay between different thermodynamic and kinetic factors. The presence of different molecular conformations in saturated solution introduces an additional degree of complexity allowing crystallization of polymorphs different not only in the packing arrangement but also in molecular geometry as seen in conformational polymorphs [1–3]. Crystallization is believed to be a multiple stage process in which molecules associate into pre‐nucleation molecular clusters followed by their assembling into crystal nuclei leading to crystal growth (Figure 23.1) [3, 4]. It was assumed [5] and later demonstrated [6, 7] that a saturated phase contains clusters of molecules displaying packing of all possible polymorphs. Final growth of a specific polymorph can be achieved by altering crystallization conditions, such as degree of supersaturation, type of solvent, and additives [8–11].

FIGURE 23.1 An illustration of the crystallization of conformationally flexible molecules.
Source: Reproduced from Yu et al. [3] with permission. Copyright (2010) American Chemical Society.
From a thermodynamic viewpoint, a primary factor for conformational polymorph formation is stabilization of the conformer free energy in the crystalline environment relative to that in saturated solution. That consideration defines the type of solvent as one of the major factors in polymorphic selectivity. Solvent selection for polymorph crystallization is usually based on achieving a reasonably high API solubility [12] to facilitate crystal growth during drowning‐out, evaporative, cooling, or slurry crystallization techniques. With this, it is reasonable to assume that a higher population of a specific molecular conformation is needed to feed a crystallization of a corresponding conformational polymorph. A higher conformer population should contribute to increased nucleation of the corresponding conformational polymorph, structural organization of which is most readily derived from the preferred conformations in solution [13, 14]. The focus of this study is testing a computational approach for conformational population prediction in different solvent media in order to explore diversification of conformational populations in solution. A working hypothesis is that controlling the selective conformer’s population should facilitate a rational solvent selection for conformational polymorph screening. In addition, prediction of conformer population in a supercooled liquid (self‐media) will also be performed and should mimic stabilization of molecular conformations in an amorphous solid state. An assumption is made that while the conformer distribution in solution is important for nucleating a conformational polymorph, a high conformation population in the supercooled liquid should reflect stability of the conformation in a solid state neglecting long‐order contributions. The interplay between conformer distribution in solution and self‐media should reflect a driving force for crystallization of the different molecular conformations.
In addition, the proposed conformational population analysis technique will be discussed for preferable conformation selection for crystal structure prediction (CSP). CSP is an important computational tool, which is valuable in guiding polymorph screening [15–17] and for performing a polymorphic risk assessment for solid form nomination during pharmaceutical development [18]. However, the currently available CSP methods heavily rely on a correct selection of the starting molecular conformations, which are typically held rigid at least during initial crystal packing generation. That is why a rational selection of the preferred starting molecular conformations for CSP of complex flexible molecules is of great importance [19–21].
The following topics and considerations though important are out of scope of this work.
- Due to the effect of different crystalline environments, molecular conformations may be distributed around local minima of the potential energy surface as defined in the reference media (e.g. gas phase) [22]. Molecular conformations considered in this work are defined strictly by a local minimum in the aqueous or gas media neglecting crystal packing effects. Therefore, we will be considering types of conformations representing possible conformers with slightly different geometries. This is especially true for the freely rotatable bonds, rotation of which is defined by a flat potential energy surface in the gas phase or in implicit solution, while torsion angle of such bonds may be fixed in a crystalline environment by a specific hydrogen bonding (HB) interaction (e.g. hydroxyl and carboxyl groups).
- Relative stability of polymorphs is described by an equilibrium phase diagram and cannot be adequately determined by the methods developed in the current study. Moreover, the intention of the current work is to facilitate crystallization of a diverse set of conformational polymorphs including those that are metastable.
- Rotational barriers, which are important for kinetics of conformational interconversion, will be not considered. Therefore, only thermodynamic factors will be used in theoretical evaluation of the conformational distributions.
- In addition, no considerations of kinetic factors that may affect selectivity of the polymorph crystallization will be addressed. Among such factors are the degree of supersaturation, cooling and stirring rates, impurities and additives that affect the polymorphic form, morphology, and crystal growth [8–11].
23.2 METHODS
23.2.1 Theoretical
The conformational population study was performed in two steps. During the first step, a stochastic conformational search was performed using the MOE 2008.10 software package [23] with the following parameters: MMFF94x force field with distance‐dependent dielectric, chiral constraints, allowing amide bond rotation and energy cutoff of 7 kcal/mol. After the conformational search was complete, the conformations generated were further optimized using aqueous media at PBE/DNP/COSMO level of theory (defined by theoretical method and a basis set) as implemented in DMol3 [24–26]. This utilizes density functional theory (DFT) PBE approximation [27] with all‐electron double‐numeric‐polarized basis set. The effect of bulk water is estimated by conductor‐like screening model (COSMO) as implemented in DMol3 [28]. It was demonstrated recently [29] that PBE is one of the best DFT functionals in the prediction of energies of HB systems. The cosmo files generated by the PBE/DNP/COSMO calculations for each conformer are further used for solvation free energy calculations, ΔGsolv, and for prediction of conformational distribution in different solvents adopting COSMO‐RS theory [30] as implemented in COSMOtherm software [31].
An obvious advantage of the application of the PBE/DNP/COSMO calculations is that the COSMOtherm parameters are specifically optimized for this level of theory. However, the DFT is known to underestimate strong electron correlation effects (e.g. dispersion energy) [32]. Therefore, in order to assure the quality of the PBE/DNP calculations, we have also performed calculations at a combined level of theory according to the following procedure (Chapter 20). The conformer free energy in solution was presented as
where
- Egas(i) is the gas‐phase energy of the conformer.
- ZPE(i) is its zero‐point vibrational energy.
- ΔGsolv(i) was calculated at the PBE/DNP/COSMO level as described above, while the gas free energy of the conformer was calculated at the RI‐MP2/TZVPP level [33] adopting TURBOMOLE software [34].
- The ZPE(i) contribution was estimated at the DMol3 PBE/DND level of theory.
In the following discussions, the two theoretical approaches described above for simplicity will be referred to as PBE and RI‐MP2 levels, respectively.
The equilibrium conformer population, p(i), was calculated according to the following equation [30]:

where
- ϖ(i) is a multiplicity of the conformer i, which is based on geometrical degeneration factors.
- R is the universal gas constant.
- T is the temperature in Kelvin.
A challenge in an accurate prediction of p(i) is introduced by an exponential dependence on the calculated G(i) values, so that a relatively small error in conformer’s free energy transforms into significant errors in conformer populations. For example, in the case of a simple system with two conformations displaying similar energies and multiplicities, the true population of each conformer is 50%. However, an error in predicted relative G(i) values, G(2)–G(1), of 0.4 kcal/mol would result in p(i) error at room temperature of ±16.3%. The predicted conformer populations would be 66.3 and 33.7%.
23.2.2 Experimental
23.2.2.1 NMR Measurements
1H, gHMBC, and G‐BIRDR,X‐CPMG‐HSQMBC experiments were performed on a Bruker Avance DRX 600 spectrometer equipped with a 5 mm BBO probe with z‐axis gradient. All experiments were performed at a temperature of 298 K.
Samples were prepared at concentrations of 10, 100, and 300 mg/ml in acetone‐d6, acetonitrile‐d3, and methanol‐d4 with tetramethylsilane as an internal standard. All experiments were performed using Bruker standard pulse sequences, except for G‐BIRDR,X‐CPMG‐HSQMBC, which was written and implemented by a staff member in our laboratory.
For 1H NMR analysis, typically one transient was acquired with a 1 second relaxation delay using 32 K data points. The 90° pulse was 10.5 μs and a spectral width of 10 775 Hz was used.
The gHMBC spectrum was acquired with 4096 data points for F2 and 128 F1 increments. gHMBC data was acquired with 4 K data points in F2, 128 increments for F1 (16 scans per increment) and F2 × F1 spectral window of 5200 × 23 800 Hz. Data was processed with 4 K data points zero‐filled to 8 K in F2 and 128 data points zero‐filled to 1 K in F1.
The G‐BIRDR,X‐CPMG‐HSQMBC spectra were acquired in approximately 14 hours with 4 K data points in F2, 128 increments for F1 with 256 scans per increment and F2 × F1 spectral window of 5200 × 23 800 Hz. Data was processed with 4 K data points zero‐filled to 8 K in F2 and 128 data points zero‐filled to 1 K in F1. A sine squared window function was applied to the F1 dimension before Fourier transformation, and no apodization was applied in the F2 dimension. The gradient ratios for G‐BIRDR,X‐CPMG‐HSQMBC were G1 : G2 : G3 : G4 : G5 = 2.5 : 2.5 : 8 : 1 : ±2. The delay for long‐range polarization transfer was set to 63 ms. The delay used for delta was set to 200 μs. All measured coupling constants are believed to be within ±0.5 Hz. The values of 3JCH were determined from direct measurement and subsequent manual peak fitting analysis [35].
23.3 RESULTS AND DISCUSSION
23.3.1 Test of Accuracy of Conformational Population Predictions
The accuracy of conformational population prediction for flexible organic molecules was tested at different levels of theory. For this, three test cases were selected consisting of N‐substituted amide series [36], N‐(pyridin‐2‐yl)benzamide chemical series [37], and S‐ibuprofen. While accurate experimental conformational populations based on the solution NMR experiments were available for the first two cases, a separate experimental work was performed for S‐ibuprofen.
23.3.1.1 N‐Substituted Amide Series
Yamasaki et al. [36] reported a detailed study of the cis–trans ratio of conformer population of a series of N‐substituted amides (Figure 23.2) in DCM‐d2, methanol‐d4, and acetone‐d6 at 183 K. It was demonstrated that compounds 1 and 2 display cis and trans conformations in all three solvents, respectively. A very weak solvent dependence was found for compounds 6 and 7, the former being preferably in the trans conformations, while the latter displaying close to a uniform cis–trans distribution. The most remarkable result of the study was an observation of a pronounced solvent‐dependent conformational switching of the phenylhydroxamic acids (compounds 3–5, Figure 23.3, Table 23.1) from the predominantly cis‐conformations in DCM to preferably trans conformations in acetone.

FIGURE 23.2 Chemical structures of N‐substituted amide series [36].
Source: Reproduced with permission of American Chemical Society.
FIGURE 23.3 Cis conformer(s) populations of compounds 3–5 (a–c) of N‐substituted amide series (Table 23.1, Figure 23.2) [36]. Experimental, PBE, and RI‐MP2 results are represented, respectively, by black, dark gray, and gray bars.
Source: Reproduced with permission of American Chemical Society.
TABLE 23.1 Experimental [36] and Predicted Cis Conformer Populations (%) of N‐Substituted Amides (Figure 23.2) at −90 °C in Three Solvents
Source: Reproduced with permission of American Chemical Society.
| DCM | Methanol | Acetone | Self‐Media | ||||||||
| Molecule | Exp | PBE | RI‐MP2 | Exp | PBE | RI‐MP2 | Exp | PBE | RI‐MP2 | PBE | T (°C) |
| 1 | <1 | <1 | <1 | <1 | <1 | <1 | <1 | <1 | <1 | <1 | −90 |
| 2 | 98 | 98.8 | >99 | >99 | 95.4 | >99 | >99 | 98.8 | >99 | 97.0 | −90 |
| 3 | 98 | >99 | >99 | 49 | <1 | 2.2 | 23 | <1 | <1 | 98.1 | −90 |
| 4 | >99 | >99 | >99 | 59 | 3.0 | 26.4 | 33 | <1 | 6.4 | 98.6 | −90 |
| 5 | >99 | >99 | 99.6 | 3 | <1 | <1 | <1 | <1 | <1 | 79.6 | −90 |
| 6 | 98 | >99 | >99 | 95 | 86.5 | >99 | 85 | 60.2 | >99 | 97.2 | −90 |
| 7 | 50 | 88.1 | >99 | 63 | 88.7 | >99 | 55 | 52.2 | >99 | 45.5 | −90 |
Details of the theoretical approaches based on PBE and RI‐MP2 levels of theory are described in Section 23.2.1.
Theoretical predictions at the DFT (PBE) and RI‐MP2 levels are in agreement with the experimental observations (Table 23.1). In particular, the strong solvent dependence of conformations of compounds 3–5 was reproduced correctly, though the absolute values of cis populations in methanol and acetone are underestimated for compounds 3 and 4, especially by the DFT method (Figure 23.3). At the same time both levels of the predictions overestimated cis populations of compound 7. The overestimation is more pronounced in the case of the predictions using the RI‐MP2 level of theory.
23.3.1.2 N‐(Pyridin‐2‐yl)benzamide Series
Populations of cis conformations of a series of N‐(pyridin‐2‐yl)benzamides (Figure 23.4, compounds 1–4) and of N‐(2,6‐dimethylphenyl)acetamide (Figure 23.4, compound 5) were studied by means of solution NMR spectroscopy in three solvents: chloroform‐d1, methanol‐d4, and acetone‐d6 at 243 K (Table 23.2) [37]. It was demonstrated that compounds 1 and 3 display cis and trans conformations in all three solvents, respectively. These observations are analogues to the results reported Yamasaki et al. [36] for the compounds 1 and 2 (Figure 23.2, Table 23.1). Solvent‐dependent conformational behavior was observed for compounds 2 and 5. Theoretical predictions at the DFT PBE level are in a quite good agreement with the experimental observations (Table 23.2). In particular, the solvent dependence of compound 2 and 5 conformations was reproduced correctly, though the absolute values of cis populations in methanol and acetone are somewhat overestimated (Figure 23.5). The overestimation is more pronounced in case of the predictions at the RI‐MP2 level of theory.
FIGURE 23.4 A series of N‐(pyridin‐2‐yl)benzamides (1–4) and N‐(2,6‐dimethylphenyl)acetamide (5) [37].
Source: Reproduced with permission of American Chemical Society.
TABLE 23.2 Experimental [37] and Predicted Cis Conformer Populations (%) of N‐(Pyridin‐2‐yl)benzamides (Figure 23.4, 1–4) and N‐(2,6‐dimethylphenyl)acetamide (Figure 23.4, 5) at −30 °C in Three Solvents
Source: Reproduced with permission of American Chemical Society.
| CHCl3 | Methanol | Acetone | Self‐Media | ||||||||
| Molecule | Exp | PBE | RI‐MP2 | Exp | PBE | RI‐MP2 | Exp | PBE | RI‐MP2 | PBE | T (°C) |
| 1 | <1 | <1 | <1 | <1 | <1 | <1 | — | <1 | <1 | <1 | −30 |
| 2 | 60.6 | 51.7 | 66.5 | 7.4 | 26.1 | 56.3 | 50.3 | 78.2 | 96.4 | 80.0 | −30 |
| 3 | >99 | >99 | >99 | — | >99 | >99 | — | >99 | >99 | >99 | −30 |
| 4 | <1 | <1 | 8.4 | — | <1 | 1.3 | — | <1 | 32.4 | <1 | −30 |
| 5 | 20.6 | 25.4 | 35.9 | — | 7.0 | 7.8 | 2.9 | 3.3 | 4.2 | 8.3 | −30 |
Details of the theoretical approaches based on PBE and RI‐MP2 levels of theory are described in Section 23.2.1.
FIGURE 23.5 Cis conformer(s) populations of (a) 2,3,4,5,6‐pentafluoro‐N‐(pyrimidine‐2‐yl)benzamide (Table 23.2, Figure 23.4, compound 2) and (b) N‐(2,6‐dimethylphenyl)acetamide (Table 23.2, Figure 23.4, compound 5) [37]. Experimental, PBE, and RI‐MP2 results are represented, respectively, by black, dark gray, and gray bars.
Source: Reproduced with permission of American Chemical Society.
It is found for both N‐substituted amide and N‐(pyridin‐2‐yl)benzamide series that a combined approach with RI‐MP2/TZVPP gas‐phase calculations does not demonstrate an advantage over PBE/DNP/COSMO level of theory in predicting conformational distributions in different solvents. Therefore, a less demanding PBE/DNP/COSMO analysis was adopted for further calculations.
23.3.2 Conformational Distribution and Polymorph Crystallization
Polymorph crystallization may be performed by utilizing different crystallization techniques. Typically a slurry experiment is considered to be the best to induce solvent‐mediated transformation to the most stable form [38, 39]. The system is preferably under thermodynamic control, and the solution is saturated with respect to a metastable form and supersaturated with respect to a more stable form. It has been shown that a solvent that gives high solubility provides faster transformation to the most stable form and usually 8 mM solubility threshold has been adopted when designing the slurry experiment [39]. At the same time, cooling and evaporation crystallization in general produce a supersaturated solution with respect to all possible forms, and the system is preferably under kinetic control. In that case, polymorph crystallization typically follows Ostwald law of stages [40], and crystallization of the least stable form is expected first, followed by transformation to a more stable polymorph. The focus of the current study is to explore a correlation between conformational polymorph distributions and conformational polymorph crystallization. Unfortunately, there is very limited information available in the literature addressing the effect of solvent on both conformational distribution and crystallization. Below we will consider four examples – two slurry and two cooling crystallization experiments, for which conformational distribution in different solvents will be predicted by adopting theoretical approaches described above (PBE/DNP/COSMO level of theory).
23.3.2.1 N‐Phenylhydroxamic Acids
Experimental and conformational distributions of N‐phenylhydroxamic acids in three different solvents were reported by Yamasaki et al. [36] and discussed above (Table 23.1, compounds 3–5). Both NMR spectroscopy and theoretical calculations (Table 23.1, compounds 3–5) demonstrated that all N‐phenylhydroxamic acids display switching from the cis conformations in dichloromethane to the trans conformations in methanol and especially in acetone (183 K). Yamasaki et al. recrystallized compound 3 from DCM and acetone producing polymorphs with cis (crystal A) and trans (crystal B) molecular conformations, respectively (Figure 23.9). It appears from differential scanning calorimetry (DSC) profile [36] that an enantiotropic relationship exists between A and B forms, so that at room temperature the crystal B is presumably more stable. The stability assignment is opposite to the one that may be based on the predicted population distribution in the self‐media (or an amorphous solid, Table 23.1). This reflects the importance of the long‐range order contributions in the N‐phenylhydroxamic acid crystals. An important conclusion from the results of the Yamasaki et al. study [36] is that the polymorph crystallization in different solvents may follow the conformational population trend rather than the Ostwald rule of stages.
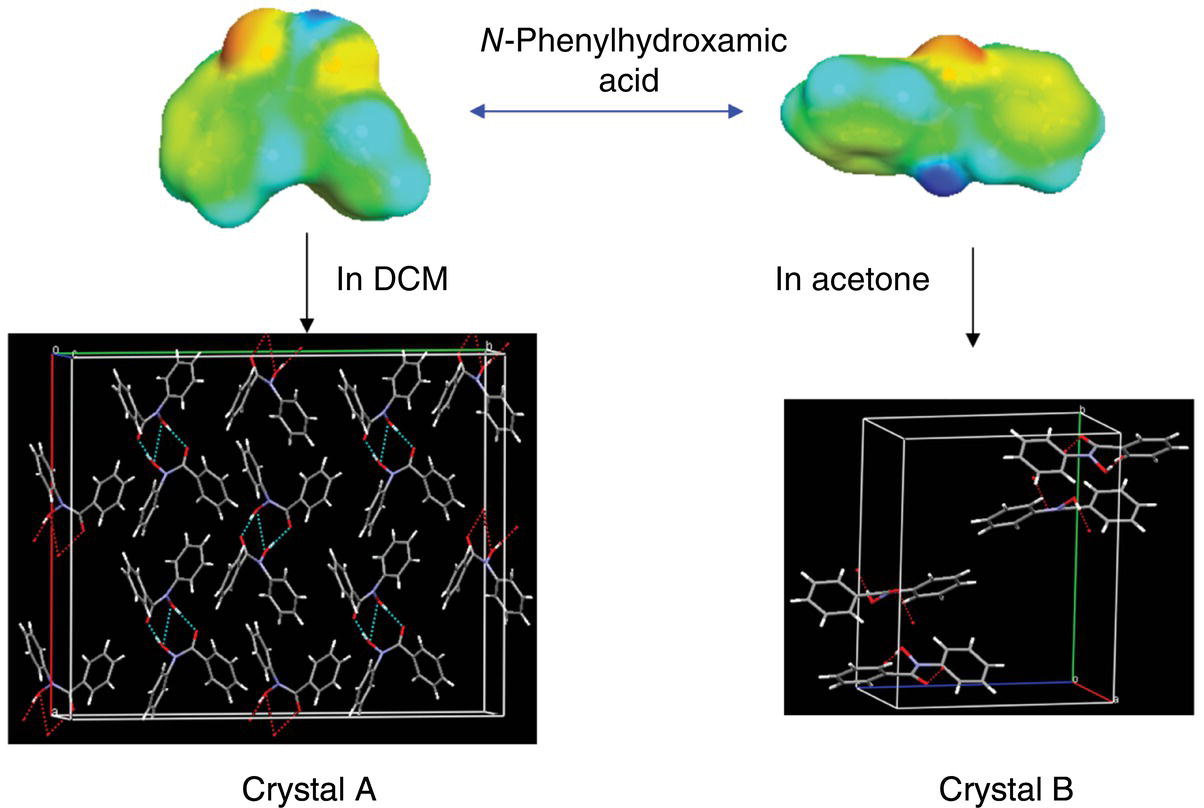
FIGURE 23.9 Conformational equilibrium of N‐phenylhydroxamic acid (compound 3, Table 23.1) and crystal structures from recrystallization in DCM (crystal A, CSD Refcode: XERSOD) and acetone (crystal B, CSD Refcode: XETNOA) [36].
Source: Reproduced with permission of American Chemical Society.
23.3.2.2 Taltirelin
Taltirelin ((4S)‐N‐[(2S)‐1‐[(2S)‐2‐carbamoylpyrrolidin‐1‐yl]‐3‐(3H‐imidazol‐4‐yl)‐1‐oxopropan‐2‐yl]‐1‐methyl‐2,6‐dioxo‐1,3‐diazinane‐4‐carboxamide), a central nervous system activating agent, was reported to have two crystalline tetrahydrate forms, a metastable α‐form and stable β‐form (Figure 23.10) [41, 42]. It was found that the solvent‐mediated transformation to the β‐form occurring in the water slurry can be significantly promoted by adding a small amount (10 wt. %) of MeOH. It was demonstrated that although the polymorph solubility had little affect with the added MeOH (it is actually slightly decreasing), an increase in methanol concentration causes an induction period of transformation to become shorter. In addition, Shoji Maruyama and Hiroshi Ooshima [41] demonstrated by means of nOe NMR analysis that MeOH causes the conformation change of taltirelin from the α‐form to β‐form conformers through the solute–MeOH interaction. That observation supports the importance that the conformer population has on driving the corresponding conformational polymorph crystallization.

FIGURE 23.10 Conformations of taltirelin α‐ (a) and β‐ (b) forms. Only polar hydrogens are shown.
Taltirelin is a very flexible molecule with eight rotatable bonds, which make a reliable conformation search a very challenging task. In order to test whether the MeOH effect on conformational populations can be predicted, the following calculations were performed. The α‐form conformation was taken from the crystal structure available in the Cambridge Structural Database [43] (CSD, reference code REPLIH1). The β‐form conformation was reconstructed from that of α‐form by rotation of two single bonds as described in the literature (Figure 23.10) [41, 42]. The α‐ and β‐form conformations were further adopted for the conformational population analysis at the PBE/DNP/COSMO level of theory. Though no significant effect was reproduced at 10 wt. % MeOH concentration, the calculations demonstrated a general qualitative increase of the β‐conformer population when switching from aqueous to methanol solution (Figure 23.11).

FIGURE 23.11 Predicted populations of the α‐ (gray) and β‐form (black) taltirelin conformers in water and methanol.
23.3.2.3 Famotidine
Famotidine, a histamine H2‐receptor antagonist, is a very flexible molecule that has two known conformational polymorphs: A and B. These two polymorphs are monotropically related with form A being more stable [44]. Since form B is the metastable form, it is kinetically favored and according to the Ostwald law should crystallize first when cooling a saturated solution. Selective cooling crystallization of famotidine polymorphs was reported by Lu et al. [44]. It was found that the form prepared was not only influenced by the cooling rate but also affected by the solvent of crystallization. For example, form B was crystallized from a water solution with high initial drug concentration independent of the rate of cooling. Additionally, the stable form A was crystallized from methanol and acetonitrile solutions at low initial drug concentrations. No conformational population study in solutions was reported by the authors.
Conformational populations of forms A and B were predicted at a crystallization temperature of 50 °C in three solvents at the PBE/DNP/COSMO level of theory. Due to the very high flexibility of the drug, crystallographic conformations (Figure 23.12) were adopted for the calculations with no conformational search. The resulting conformer population in three solvents is presented in Figure 23.13. It is demonstrated that in addition to any solubility and kinetic factors, the preference of crystallization of B or A conformers in different solvents can be accounted for by a trend in a conformational distribution. The conformer A displays the highest population in methanol and acetonitrile from which it was preferably crystallized. The population of the conformer B increases and becomes the highest in the water solution, from which it was crystallized.
FIGURE 23.12 Molecular conformations of famotidine polymorphs A (a) and B (b). The crystal structures were taken from CSD, Refcodes: FOGVIG04 (form A) and FOGVIG05 (form B). Only polar hydrogens are shown.
FIGURE 23.13 Histogram of predicted conformational distributions of famotidine in three solvents at 50 °C. σ‐Surfaces of the two conformers are shown on the top.
23.3.2.4 Ritonavir
Ritonavir, a HIV protease inhibitor, is a well‐known example of the impact polymorphism has on drug development [45]. Currently, two polymorphic forms are known, I and II, with form II being the most stable at room temperature. A solvent‐mediated polymorphic conversion study was reported by Miller et al. [39]. It was demonstrated that, although the slurry crystallization is preferentially thermodynamically controlled, relatively high drug solubility (>8 mM but <200 mM) is needed to ensure solvent‐mediated conversion to the most stable form. These conclusions were supported by polymorph screening in 13 solvents. Conformational populations of forms I and II in 13 solvents were predicted at room temperature at the PBE/DNP/COSMO level of theory. Due to the extremely high flexibility of the ritonavir drug, the crystallographic conformations were adopted (Figure 23.14) for the calculations. The conformations were taken from CSD database (reference codes are YIGPIO and YIGPIO01). The resulting conformer populations together with the polymorph screening results are presented in Table 23.5. It is demonstrated that except for MTBE the results of two‐week slurry crystallization follow the trend of the preferred conformer population in the corresponding solvent.

FIGURE 23.14 Crystallographic conformations of ritonavir forms I and II. The crystal structures were taken from CSD (reference codes: YIGPIO and YIGPIO01).
TABLE 23.5 Results of Polymorph Screen of Ritonavir [39] and Predicted Conformer Populations at Room Temperature
Source: Reproduced with permission of Taylor & Francis.
| Solvent | Solid Form two Daysa | Solid Form two Weeksa | Conformer I Populationb (%) | Conformer II Populationb (%) |
| Water | I | II | 21 | 79 |
| Hexane | I | I, II mixture | 85 | 15 |
| Methyl t‐butyl ether | I | I | 39 | 61 |
| 1,2‐Xylene | I | I | 70 | 30 |
| Toluene | I | I | 68 | 32 |
| Nitromethane | II | II | 31 | 69 |
| Ethyl acetate | II | II | 35 | 65 |
| Acetonitrile | II | II | 26 | 74 |
| 2‐Propanol | II | II | 32 | 68 |
| 2‐Butanone | II | II | 34 | 66 |
| Acetone | II | II | 27 | 73 |
| 1,2‐Dimethoxyethane | II | II | 28 | 72 |
| Ethanol | II | II | 30 | 70 |
aResults of stable polymorph screen reported by Miller et al. [39].
bPredictions at PBE/DNP/COSMO level of theory.
23.3.3 Implication to Crystal Structure Prediction
CSP is becoming a useful tool conducted in parallel to polymorph screening as well as being able to assess the risk of discovering a more stable form [15–18]. A starting point for CSP is the selection of molecular conformations, which are as a rule held rigid during the generation of potential packing diagrams. Typically, the conformations are generated in the gas phase [19–21]. Since crystallization in the pharmaceutical industry is not performed from the gas phase but rather from different solvents, we recommend adopting the method of conformer distribution analysis, considered in the current study, be applied to the conformation selection for virtual polymorph screening. For this, a diverse set of solvents should be considered in order to determine whether the solvent induces conformational switching of the active pharmaceutical. An indication that a molecule may switch conformations is the presence of intramolecular HB or a noticeable variation of molecular hydrophobic and hydrophilic surfaces. We propose a small diverse set of solvents to be considered for selecting molecular conformations used in CSP: polar protic, water (both HB donor and acceptor capabilities) and diethylamine (HB donor capabilities); polar aprotic, acetone (HB acceptor capabilities); nonpolar, hexane; and self‐media to mimic solid amorphous. A combined set of conformations that displayed the highest populations in any of the above solvents can be recommended for the virtual conformational polymorph screening.
In order to illustrate this point, a conformer selection in support of CSP analysis was performed using a theoretical conformational population study of the flexible S‐ibuprofen molecule. This study allowed for the selection of only four preferred conformations (Figure 23.8) with the highest populations using the following three solvents: methanol, acetone, and acetonitrile. Theoretical conformational distribution analysis in water, diethylamine, hexane, and self‐media at the PBE/DNP/COSMO level of theory discovers the same four favorable conformations. Thus, the selected four conformations can be used as a starting point for CSP. In addition, we should take into account that the acid group may rotate in the crystalline environment to participate in HB interactions. This adds at least another four conformations that are different from the initial set only by rotation of the acidic group by approximately 180°. In order to validate this selection process, the generated favorable conformers for S‐ibuprofen (Figure 23.8) were compared with the observed molecular conformations from the CSD (reference codes IBPRAC, JEKNOC10, JEKNOC11, HUPPAJ, and RONWOG). Aligned crystallographic conformations are shown in Figure 23.15. An accuracy of the best alignment of the four selected favorable conformations (hydrogens are removed for the alignment) with those crystallographically observed is presented in Table 23.6. Quite low RMSD values demonstrate a good quality of theoretical selection of the conformations. It is interesting that while all crystallographic conformations were represented in the selected set of the favorable conformations of S‐ibuprofen, one of the preferred conformations (Conformer 3 in Table 23.3; Figure 23.8) has not been yet crystallographically observed (Figure 23.15).
FIGURE 23.15 Alignment of the crystallographically observed S‐ibuprofen conformations (CSD reference codes are IBPRAC, JEKNOC10, JEKNOC11, HUPPAJ, and RONWOG). All hydrogens are omitted.
TABLE 23.6 Best Alignments of the Calculated Favorable Conformations of S‐Ibuprofen with the Similar Crystallographic Conformations from CSD
| Conformer | RMSD (Å) | Reference Code |
| 1 | 0.27 | RONWOG |
| 2 | 0.23 | IBPRAC, JEKNOC10, JEKNOC11 |
| 4 | 0.12 | HUPPAJ |
The successful pharmaceutical applications of the conformational distribution analysis in the diverse set of solvents to support CSP study were reported for the oncology drug crizotinib (Xalcory®) [46] and the antibacterial drug candidate sulopenem [47].
23.4 CONCLUSIONS
Molecular crystallization is a very complex phenomenon that is dependent on a combination of multiple thermodynamic and kinetic factors. Added complexity occurs when attempting to crystallize a conformational polymorph that is selected for drug development. Computational modeling enables better understanding of solid state chemistry and allows enriched selection of desired solid form [48]. In this study, we have shown the use of one parameter, such as relative conformer population, in exploring the possibility of controlling crystallization of conformational polymorphs. We have demonstrated that relative conformational population behavior in different solvents can be reasonably accurately predicted by theoretical methods. A correlation between trends of predicted (and in some cases also observed) conformational distribution changes in different solvents and crystallization results for conformational polymorphs was found in four examples considered in the current study. Though a more extended testing is probably required, the following applications may be proposed.
- The solvent selection strategy may focus on an attempt to diversify predicted conformer distribution in general, adopting crystallographic and/or theoretically generated conformations. This may facilitate crystallization of new form(s) that are both stable and metastable.
- Another application of solvent selection is based on predicted change (increase or decrease) of the population(s) of the known conformer(s). This may allow tuning (promotion or inhibition) of the corresponding polymorph(s) crystallization. This approach was applied to a targeted polymorph screening of (Inlyta®) [49].
In all cases, the final selection of solvents should also satisfy the criteria of relatively high (predicted or measured) solubility of the compound under consideration. In addition, the theoretical prediction of conformer distribution in different solvents, including self‐media, was proposed for the selection of preferable starting conformation(s) for virtual polymorph screening via CSP.
ACKNOWLEDGMENTS
The authors would like to thank Mr. Brian Samas and Dr. Brian Marquez for the valuable comments and discussions. YAA is thankful to Dr. Alex Goldberg for the valuable suggestions in running DMol3 applications. YAA is grateful to Dr. Frank Eckert for the valuable consultations on COSMOtherm implementation of conformational population analysis.
REFERENCES
- 1. Bernstein, J. (2002). Polymorphism in Molecular Crystals. Oxford: Clarendon.
- 2. Nangia, A. (2008). Conformational polymorphism in organic crystals. Acc. Chem. Res. 41: 595–604.
- 3. Yu, L., Reutzel‐Edens, S.M., and Mitchell, C.A. (2000). Crystallization and polymorphism of conformationally flexible molecules: problems, patterns, and strategies. Org. Process Res. Dev. 4: 396–402.
- 4. Weissbuch, I., Kuzmenko, I., Vaida, M. et al. (1994). Twinned crystals of enantiomorphous morphology of racemic alanine induced by optically resolved α‐amino acids; a stereochemical probe for the early stages of crystal nucleation. Chem. Mater. 6: 1258–1268.
- 5. Weissbuch, I., Popoviz‐Biro, R., Leiswerowitz, L., and Lahav, M. (1994). Lock‐and‐key processes at crystalline interfaces: relevance to the spontaneous generation of chirality. In: The Lock‐and‐Key Principle (ed. J.‐P. Behr), 173–246. New York: Wiley.
- 6. Lee, A.Y., Lee, I., Dette, S.S. et al. (2005). Crystallization on confined engineered surfaces: a method to control crystal size and generate different polymorphs. J. Am. Chem. Soc. 127: 14982–14983.
- 7. Lee, A.Y., Lee, I.S., and Myerson, A.S. (2006). Factors affecting the polymorphic outcome of glycine crystals constrained on patterned substrates. Chem. Eng. Technol. 29: 281–285.
- 8. Weissbuch, I., Addadi, L., and Leiswerowitz, L. (1991). Molecular recognition at crystal interfaces. Science 253: 637–645.
- 9. Datta, S. and Grant, D.J.W. (2005). Effect of supersaturation on the crystallization of phenylbutazone polymorphs. Cryst. Res. Technol. 40: 233–242.
- 10. Davey, R.J., Blagden, N., Righini, S. et al. (2002). Nucleation control in solution mediated polymorphic phase transformations: the case of 2,6‐dihydroxybenzoic acid. J. Phys. Chem. B 106: 1954–1959.
- 11. Davey, R.J., Blagden, N., Potts, G.D., and Docherty, R. (1997). Polymorphism in molecular crystals: stabilization of a metastable form by conformational mimicry. J. Am. Chem. Soc. 119: 1767–1772.
- 12. Mullin, J.W. (1992). Crystallization. Oxford: Butterworth‐Heinemann.
- 13. Threlfall, T. (2003). Structural and thermodynamic explanations of Ostwald's rule. Org. Process Res. Dev. 7: 1017–1027.
- 14. Hursthouse, M.B., Huth, S., and Threlfall, T.L. (2009). Why do organic compounds crystallise well or badly or ever so slowly? Why is crystallization nevertheless such a good purification technique? Org. Process Res. Dev. 13: 1231–1240.
- 15. Blagden, N. and Davey, R.J. (2003). Polymorph selection: challenges for the future? Cryst. Growth Des. 3: 873–885.
- 16. Cross, W.I., Blagden, N., Davey, R.J. et al. (2003). A whole output strategy for polymorph screening: combining crystal structure prediction, graph set analysis, and targeted crystallization experiments in the case of diflunisal. Cryst. Growth Des. 3: 151–158.
- 17. Price, S.L. (2008). From crystal structure prediction to polymorph prediction: interpreting the crystal energy landscape. Phys. Chem. Chem. Phys. 10: 1996–2009.
- 18. Price, S.L. (2004). The computational prediction of pharmaceutical crystal structures and polymorphism. Adv. Drug Deliv. Rev. 56: 301–319.
- 19. Ouvrard, C. and Price, S.L. (2004). Toward crystal structure prediction for conformationally flexible molecules: the headaches illustrated by aspirin. Cryst. Growth Des. 4: 119–1127.
- 20. Day, G.M., Motherwell, W.D.S., and Jones, W. (2008). A strategy for predicting the crystal structures of flexible molecules: the polymorphism of phenobarbital. Phys. Chem. Chem. Phys. 9: 1693–1704.
- 21. Lupyan, D., Abramov, Y.A., Sherman, W., (2012). Close intramolecular sulfur–oxygen contacts: modified force field parameters for improved conformation generation. J. Comput. Aided Mol. Des. 26: 1195–1205.
- 22. Weng, Z.F., Sam, W.D., Motherwell, W.D.S. et al. (2008). Conformational variability of molecules in different crystal environments: a database study. Acta Crystallogr. B64: 348–362.
- 23. MOE2008.10. Montreal, Quebec, Canada: Chemical Computing Group, Inc.. www.chemcomp.com.
- 24. Delley, B. (1990). An all‐electron numerical method for solving the local density functional for polyatomic molecules. J. Chem. Phys. 92: 508–517.
- 25. Delley, B. (2000). From molecules to solids with the DMol3 approach. J. Chem. Phys. 113: 7756–7764.
- 26. Accelrys Software (2008). Material Studio 4.4, Dmol3. San Diego: Accelrys Software Inc.
- 27. Perdew, J.P., Burke, K., and Ernzerhof, M. (1996). Generalized gradient approximation made simple. Phys. Rev. Lett. 77: 3865–3868.
- 28. Andzelm, J., Kölmel, C., and Klamt, A. (1995). Incorporation of solvent effects into density functional calculations of molecular energies and geometries. J. Chem. Phys. 103: 9312–9320.
- 29. Zhao, Y. and Truhlar, D.G. (2005). Benchmark databases of nonbonded interactions and their use to test density functional theory. J. Chem. Theory Comput. 1: 415–432.
- 30. Klampt, A. (2005). COSMO‐RS; From Quantum Chemistry to Fluid‐Phase Thermodynamics and Drug Design. Amsterdam: Elsevier.
- 31. COSMOTherm Version C2.1_0108. Leverkusen, Germany: COSMOLogic GmbH.
- 32. Lein, M., Dobson, J.F., and Gross, E.K.U. (1999). Towards the description of van der Waals interactions within density functional theory. J. Comput. Chem. 20: 12–22.
- 33. Weigend, F., Häser, M., Patzelt, H., and Ahlrichs, R. (1998). RI‐MP2: optimized auxiliary basis sets and demonstration of efficiency. Chem. Phys. Lett. 294: 143–152.
- 34. TURBOMOLE V6.0 2009, a development of University of Karlsruhe and Forschungszentrum Karlsruhe GmbH, 1989–2007. TURBOMOLE GmbH, since 2007.
- 35. Keeler, J., Neuhaus, D., and Titman, J.J. (1988). A convenient technique for the measurement and assignment of long‐range carbon‐13 proton coupling constants. Chem. Phys. Lett. 146: 545–548.
- 36. Yamasaki, R., Tanatani, A., Azumaya, I. et al. (2006). Solvent‐dependent conformational switching of N‐phenylhydroxamic acid and its application in crystal engineering. Cryst. Growth Des. 9: 2007–2010.
- 37. Forbes, C.C., Beatty, A.M., and Smith, B.D. (2001). Using pentafluorophenyl as a lewis acid to stabilize a cis secondary amide conformation. Org. Lett. 3: 3595–3598.
- 38. Gu, C., Young, V. Jr., and Grant, D.J.W. (2001). Polymorphs screening: influence of solvents on the rate of solvent‐mediated polymorphic transformation. J. Pharm. Sci. 90: 1878–1890.
- 39. Miller, J.M., Collman, B.M., Greene, L.R. et al. (2005). Identifying the stable polymorph early in the drug discovery–development process. Pharm. Dev. Technol. 10: 291–297.
- 40. Ostwald, W. (1897). Studien Uber Die Bildung und Umwandlung Fester Korper. Z. Phys. Chem. 22: 289–302.
- 41. Maruyama, S., Ooshima, H., and Kato, J. (1999). Crystal structures and solvent‐mediated transformation of taltirelin polymorphs. Chem. Eng. J. 75: 193–200.
- 42. Maruyama, S. and Ooshima, H. (2001). Mechanism of the solvent‐mediated transformation of taltirelin polymorphs promoted by methanol. Chem. Eng. J. 81: 1–7.
- 43. Allen, F.H., Bellard, S., Brice, M.D. et al. (1979). The Cambridge Structural Database: a quarter of a million crystal structures and rising. Acta Crystallogr. B35: 2331–2339.
- 44. Lu, J., Wang, X.‐J., Yand, X., and Ching, C.‐B. (2007). Characterization and selective crystallization of famotidine polymorphs. J. Pharm. Sci. 96: 2457–2468.
- 45. Chemburkar, S.R., Bauer, J., Deming, K. et al. (2000). Dealing with the impact of ritonavir polymorphs on the late stages of bulk drug process development. Org. Process Res. Dev. 4: 413–417.
- 46. Abramov, Y.A. (2013). Current computational approaches to support pharmaceutical solid form selection. Org. Process Res. Dev. 17: 472–485.
- 47. Krzyzaniak, J.F., Meenan, P.A., Doherty, C.L. et al. (2016). Integrating computational materials science tools in form and formulation design. In: Computational Pharmaceutical Solid State Chemistry (ed. Y.A. Abramov), 117–144. Hoboken, NJ: Wiley.
- 48. Abramov Y.A. (ed.) (2016). Computational Pharmaceutical Solid State Chemistry. Hoboken, NJ: Wiley.
- 49. Campeta, A.M., Chekal, B.P., Abramov, Y.A. et al. (2010). Development of a targeted polymorph screening approach for a complex polymorphic and highly solvating API. J. Pharm. Sci. 99: 3874–3886.