
38
MILLING OPERATIONS IN THE PHARMACEUTICAL INDUSTRY
Kevin D. Seibert, Paul C. Collins, and Carla V. Luciani
Eli Lilly and Company, Indianapolis, IN, USA
Elizabeth S. Fisher
Merck & Co., Inc., Rahway, NJ, USA
38.1 INTRODUCTION
Two aspects of a successful formulation are that it produces consistent results in vivo and it can be manufactured reproducibly. One of an engineer's main goals in pharmaceutical development is to design a process that results in a high level of consistency and control of final product performance from research through manufacturing. Particle size of ingredients in a formulation, especially the active pharmaceutical ingredient (API), greatly impacts bioperformance and process capability, and as such it is an important parameter to understand and control. Milling, or mechanical size reduction of solids, is frequently used to achieve API or formulated intermediate particle size control and can also be used for reagent and excipient size control [1]. Size reduction can be performed with enough energy to break individual particles or with less energy to break granules or agglomerates during formulation; it can be performed on dry solids, partially wet solids, or in slurry mode; it can be performed on reagents and excipients as well as final API. While there are other processing options that can be used to achieve these goals, milling is a powerful tool that is frequently chosen as a relatively straightforward way not only to evaluate whether particle size control will provide the desired performance and consistency but also to effect the desired process or product performance control from early development through commercial‐scale manufacturing.
Milling can increase the surface area of solids and their dissolution rate. This can be extremely important for improving bioavailability of a formulated drug product. The Biopharmaceutics Classification System [2–4] is one way of characterizing whether increasing API dissolution rate may improve its bioperformance; in this system, compounds are classified as BCS II or IV when their solubility is low based on a set of standard dissolution test conditions. While clearly particle size does not affect compound equilibrium solubility, dissolution rate is impacted and is directly proportional to particle size (see Noyes–Whitney equation, Fick's first law).
Control of dissolution rate can also be important for facilitating or improving chemical reaction performance when a reagent is charged in solid form. Increasing surface area of the API can also increase its effectiveness as seed for crystallization. As discussed in previous chapters, providing enough available surface of the correct crystal form is important for controlling API crystal size and form uniformity.
Size reduction of API and/or excipients can also be important to ensure consistency of formulation processing. This processing frequently involves dry blending of API with one or more excipients, and the mean size and particle size distribution (PSD) of the API relative to the excipients can influence the tendency of the API to either segregate or not mix uniformly with the other ingredients. Low dose formulations can be especially sensitive to blend uniformity problems linked to variable API particle size and disparity between the API particle size and that of the excipients. Milling can produce tight PSDs and small API mean size that may be necessary for drug product quality attributes [5]. Suspension or controlled release formulations may also have tight requirements on mean and top (largest) size in the API PSD. Additionally, API that is used in dry powder or metered dose inhalers must have sizes smaller than 5–6 μm and larger than 0.5–1 μm to reach deep lung and not be exhaled [6, 7].
In a milling operation, mechanical energy imparts stress to particles, and they are strained and deformed. When strained to the point of failure, cracks are formed and can propagate through the particle and result in breakage. Crystalline materials tend to break along crystal planes, while amorphous materials break randomly, and flawed particles will be easier to break than those with fewer internal weaknesses. When sufficient force is rapidly applied normal to a particle surface and directed toward its center, mass fracture or breakage into a few large fragments usually occurs. When force is applied more slowly, compression will be the main cause of particle breakage. If force is applied parallel to the surface of the solid, over time the particle can break into many fine particles, which is usually described as attrition [1]. Mill design and operation play a large role in determining which mode of breakage occurs.
There are several techniques available to characterize the distribution of particle and granule sizes produced by milling. Optical microscopy or image analysis is useful when little material is available, and observations of particle/granule morphology can be invaluable in troubleshooting milling problems or interpreting other particle size analysis results and powder flow behaviors. Laser light scattering particle size analysis requires more material but is commonly used to evaluate API PSDs. Solids to be analyzed can be dispersed in a carrier gas or liquid, and some force (air pressure or sonication) is applied to disrupt agglomerates and permit analysis of individual or primary particles (Figure 38.1). This technique can also be used online as milling takes place and therefore permit additional process understanding and control [8–10]. Sieve analysis, or determining the amount of material that passes through or is retained on standard mesh screens, is also used to assess size distribution of granules in a formulation process. Perry's Chemical Engineers' Handbook [11] summarizes several size analysis techniques and provides additional references on this topic.

FIGURE 38.1 Laser light scattering device.
It is important to note that in certain situations milling can be challenging and alternative size reduction techniques should be considered. If the milling operation results in material that contains a high proportion of fines (particles much smaller than the average size), processing problems can occur in subsequent unit operations. Large proportions of fine particles can increase cohesive behavior of the bulk solid, resulting in poorly flowing powder as the API is handled during formulation [12]. When solids are milled in a slurry and then need to be isolated from the liquors, fines can pass through the filter media and reduce overall yield. Fines can also reduce cake and filter media permeability and reduce filtration productivity. At pilot and manufacturing scale, formulation usually involves mechanical solids feeding, which requires that the solids flow in a predictable manner. This “flowability” can be assessed in different ways [13–15], and there is no standard industry practice for this testing in pharmaceutical manufacturing. However, it is clear that solids that tend to demonstrate cohesive behaviors and clump or stick to equipment surfaces can be challenging to process reproducibly and efficiently in formulation without additional effort and safeguards.
Applying mechanical energy via milling does more than break crystals. As the applied energy increases to be sufficient to make individual crystals smaller, the force and stress that cause fracture can also induce changes in the crystal. These changes may manifest themselves in a variety of ways, from increasing numbers of surface cracks and flaws that may increase specific surface area and surface roughness to changes in crystal form, including conversion to an amorphous form. All of these types of changes can affect performance in formulation/in vivo and can affect physical and chemical stabilities. This observation is more common for dry milling operations that break primary particles than it is for delumping/granule breaking operations or for wet milling. While milling‐induced disorder likely occurs during a wet milling process, contact of the crystal with a liquid medium facilitates surface annealing via dissolution and subsequent redeposition, and the liquid present can transfer heat more readily than a gas stream. As understanding of solid surface chemistry and crystal structure has increased, and analytical detection and quantification capabilities have improved, these consequences of milling have become more frequently reported and studied. Ongoing work in this area continues to show that while milling can be a desirable way to control particle size, it is important to fully characterize the quality of the milled product. Some analytical techniques to assess amorphous content or crystal form include X‐ray powder diffraction and differential scanning calorimetry, and techniques to assess surface energy include atomic force microscopy and inverse gas chromatography [16–18].
Each type of milling equipment is designed to impart different amounts of energy to the solids and therefore can produce different mean sizes and size distributions. Product requirements and process limitations will inform what target size is required and/or largest size is allowed. The following sections provide some guidance on how to use that information to select milling equipment and the key parameters that can influence its performance. The resulting mean particle size and PSD depend not only on the mill but also on physical properties of the feed solids such as brittleness and hardness [19], as well as its initial size distribution. Generally speaking, the most efficient way to assess milling feasibility is to perform trial experiments that can be combined with mechanistic tools to describe particle breakage. Even when combined with a size classification operation, it is not possible to use a mill to precisely “dial in” a mean size or PSD with any reliability without the use of feedback control from in‐line particle size analysis equipment. However, engineering understanding of mill operation and key process parameters permits effective scale‐up of milling, so that the particle size to be achieved at large scale can be predicted accurately from carefully conducted gram‐scale bench experiments.
38.2 SAFETY AND QUALITY CONCERNS
Chemical engineers must proactively address process safety concerns and quality risks associated with wet and dry milling processes. While these operations are not unique to the pharmaceutical industry, performing these operations on potent organic molecules can pose some unique challenges.
The main quality concern for both wet and dry milling is to minimize introduction of extraneous matter into the milled material. The most common material of construction of milling equipment is stainless steel, although ceramic, Hastelloy C, and various types of Teflon are also frequently used depending on the material to be milled. Abrasion of the mill surfaces by API or excipient particles can result in erosion of the mill material, and levels of residual metals such as Cr and Ni must be minimized relative to the human dose of API [20]. Assessing the hardness of the API during milling process development, either empirically through small‐scale milling experiments or fundamentally through experiments such as indentation testing [19], will help prevent unexpected outcomes on scale‐up.
The most obvious safety risk associated with dry milling is personnel exposure to highly potent airborne dust. This is especially important to consider during drug development, before full API safety testing has been completed, and a conservative equipment setup is recommended at early development stages. While most mill equipment is or can be enclosed during operation, minimizing this exposure risk, solids recovery/packaging operations and equipment cleaning should not be overlooked as opportunities for exposure. Typical methods to address this risk include clean‐in‐place systems and performing the entire milling operation in a negative pressure isolator with HEPA filtered exhaust. Multiple levels of exposure control, beginning with these engineering controls and continuing through personal protective equipment (PPE), are often required to ensure adequate operator protection.
Perhaps less apparent but no less serious is the risk of dust explosion during dry milling or post‐milling activities [21, 22]. There have been numerous reported incidents of explosions occurring in the chemical, food, and pharmaceutical industries, in situations where fine powders are dispersed in air and a spark may be present. The most straightforward way to address this risk in development is to mill in an inert atmosphere (no/limited oxygen), using nitrogen or argon, and maintaining a scrupulously clean processing area. When sufficient API is available (tens of grams), the explosive properties of the dust should be quantified to better understand dust explosion risks. Typical measurements include determining the minimum ignition energy (MIE, smallest amount of energy required to ignite a dust cloud of optimal concentration) and minimum ignition temperature (minimum temperature at which a dust cloud will ignite) [23, 24]. If an explosive dust (MIE < 20 mJ) will be dry milled at pilot or manufacturing scale, engineering controls must be employed to minimize risk of explosion [25]. The force of a possible explosive event can be quantified by measuring Kst (expression of the burning dust's rate of pressure increase), and this parameter can be used in equipment/facility design. Engineering or design solutions include inertion of the process train and the use of rupture disks or automatic shutoff valves that quickly close when pressure spikes are detected.
The most common risk associated with wet milling is that of accumulating a static charge in a recirculating loop, especially when a nonconductive solvent such as hexane, heptane, or toluene is used. Electrostatic charge accumulation results from frictional contact between flowing liquids and solids in recirculating loops and the surfaces of equipment (pipes, vessels, agitators). The resulting potential difference between batch and processing surfaces could lead to a static discharge, which could ignite a fire or explosion, especially while processing with flammable organic solvents. Conductivity of organic solvents can range from 107 to <1 pS/m. Another way to interpret these values is to estimate the time required for an accumulated charge to decay (a multiple of the relaxation time). For 99% charge decay this may range from milliseconds for water to several minutes for n‐hexane [26]. Slurry conductivities of less than 100 pS/m are considered at high risk for electrostatic discharge if a mechanism for charge formation is present (such as a recycle loop or wet mill). Charges can be encouraged to dissipate by the use of conductive equipment (stainless steel in place of Teflon‐lined pipe) and grounding and bonding the equipment. Additional precautions include operating under nitrogen and keeping linear velocity through the recirculation loop as low as is practical (while maintaining adequate flow rates to ensure solids do not settle within the recirculation piping and low points in the loop).
38.3 TYPES OF MILLING AND MILL EQUIPMENT
The two primary means of reducing particle size of a solid product are wet and dry milling as defined by the media in which the engineer chooses to carry out the milling activity. Selecting a milling strategy depends on a variety of factors including particle physical and chemical properties, chemical stability, and safety‐related issues.
API is most often isolated by crystallization, followed by filtration of the solids and a terminal drying step. Based on the thermodynamic and kinetic properties of the system, the physical properties of the solids of interest, and the dynamics of the environment within the crystallizer, several outcomes are possible. Crystallizations that end in final isolated particles at the desired PSD specification require no further processing to be carried into the downstream processing train and are often the result of targeted particle engineering efforts [27–29]. Particles below the target PSD can either be tested for processability in the drug product manufacturing, or the size can be increased through modified crystallization strategies to yield larger particles of the desired PSD [30]. Most often, and generally by design, the isolated crystals are larger than the target PSD as established through formulation development or bioavailability testing. In these situations the resulting material must be milled to reduce the PSD to the target.
Deliberately growing and isolating particles larger than the target PSD may offer several advantages such as cycle time savings from reduced filtration time during isolation. While the filtration time for small particles can be reduced through increased pressure, equipment limitations and nonlinearity associated with compressible solids may result in diminishing returns with respect to cycle time savings. As a result, it is often advantageous to attempt to grow, isolate, and dry larger particles in the final processing steps of an API synthesis. In situations with solution instability, this may be the only suitable processing option as the time associated with milling a slurry could negatively impact API purity in these cases. Therefore, in considering the overall manufacturing efficiency associated with making API, the purposeful generation of large particles, which are later reduced in size, is a viable option to consider. In these scenarios, dry milling is the preferred technology for micronization.
Dry milling may also be preferred over wet milling due to incompatibility between the processing solvent and the available wet milling equipment, such as when the process stream is corrosive to stainless steel. Additionally, dry milling may be a desirable unit operation if an isolation lends itself to some process advantage. Motivating factors driving an isolation prior to reducing particle size may include impurity removal or rejection resulting from a selective crystallization and rapid removal of the liquors.
While growing of oversized crystals followed by terminal dry milling offers a unique set of advantages with respect to overall cycle time, there are other significant disadvantages when compared with particle size reduction using wet milling techniques. Oftentimes dry milling equipment and facilities are difficult and time consuming to clean when compared with in‐line wetted pipes that can easily be cleaned with circulating cleaning solutions. For highly potent or toxic compounds, operator exposure is generally considered less complex to achieve in wet milling infrastructure. Lastly, the risk for dust‐related events is nearly eliminated when choosing a wet milling approach.
Wet milling offers an advantage in that milling can be combined with terminal isolation such as selective crystallization of the desired product. When impurity removal is still of principal concern, techniques such as decantation, cross‐flow microfiltration with diafiltration, or filtration with reslurry to remove crystallization mother liquors may be employed as a way to remove rejected impurities or selectively switch to a desired solvent system.
An additional process design benefit is potentially realized with wet milling, as it allows for greater flexibility in terms of how a crystallization process is developed. As an example, as crystallization progresses the mean size of the crystals can be simultaneously reduced by milling during the crystallization process. This is time sparing and also presents crystallization benefits by continually exposing new surface area for use in the ongoing crystallization. Wet mills are also preferred if the material being milled exhibits undesirable physical properties or phase changes at higher temperatures. The increased heat capacity of the liquid carrier media allows for smaller temperature fluctuations during milling. This can be especially important for materials that have either a low melting point or are susceptible to crystal form conversion at lower temperature.
Wet milling may offer significant operating advantages over dry milling when the solvent system used for particle size reduction is directly compatible with the downstream drug product processing operation. Drug product unit operations including spray coating and wet granulation require the blend of the milled drug substance with liquid and may therefore be amenable to wet milling followed by direct use of the slurry stream in the formulation processing.
38.3.1 Dry Milling Setup
A general dry milling setup is shown in Figure 38.2. Unmilled solids are charged to the feed hopper via several methods, generally designed to contain any particle dusting during the charge operation. Solids are fed from the feed hopper through a feed device that will allow a constant mass flow to the milling unit. They are conveyed by either gravitational flow through the milling apparatus, through screw conveyance, or by conveyance with a carrier gas such as nitrogen. Typically, rotary valves and screw feeders are used to ensure constant feed rates and prevent backflow of solids due to the slightly positive gas pressures in the mill itself. Feed hoppers are generally designed with sloped sides to enable proper solids flow into the rotary valve and screw feeder system. For poorly flowing solids, “bridge breakers” or small agitators designed to facilitate solids flow from the hopper into the screw feeder are also installed.

FIGURE 38.2 General setup for dry milling operations.
Gas is fed to the mill along with the solids. Depending on the type of mill being used, some of the gas may be introduced to the mill separately from the entering solids, such as in the design of a loop or spiral jet mill, or the gas may be used as a carrier fluid to convey the solids to the mill as is the case in a hammer or pin mill design. While air may be used to convey and mill the solids, nitrogen is most often used to ensure adequate inertion of the environment around the solid phase. For solids with a low melting point, or a propensity to undergo a pressure‐induced phase transition to an amorphous solid, liquid nitrogen may be supplied via an orifice upstream of the milling operation to maintain cryogenic temperatures within the mill internals.
Depending on the mechanism of grinding within the mill, the residence time of the solids may vary from one to several seconds of average residence time. Once milled, particles will exit the grinding chamber and be carried to product collection. When tighter particle size control is desired, a classifier may be installed in‐line that allows for larger particles to be returned to the feed hopper while particles that have been adequately reduced will be routed to the collection area. Product collection from the gas stream will frequently use a cyclone to separate most of the larger solids from the gas stream and then send the gas‐containing finer particles to a bag filter and HEPA filter for final dust removal.
In most size reduction milling equipment, residence time in the mill is a key parameter determining outlet particle size. As a result, the feed rate becomes a significant part of the control strategy and must be carefully considered on scale‐up.
38.3.2 Dry Milling Equipment
Dry milling may be accomplished by grinding or high force collisions of particles with a moving pin or hammer. Alternatively, it may be accomplished by high‐energy particle–particle and particle–wall collisions as is the case with jet mills. The following sections briefly describe different types of dry mills. Note that for reduction of particle size to submicron, dry milling strategies are not usually adequate, and therefore wet milling strategies are typically employed. The table below summarizes some different types of dry mills, their key scale‐up parameters, and typical minimum particle sizes they can produce. As noted above, solids residence time in the mill is always an important scale‐up parameter for dry milling. This can be easily measured experimentally and can be controlled by limiting solid and gas feed rates to match mill efficiency.
| Mill Type | Typical Minimum Milled Size (μm) | Key Parameters |
| Hammer mill | 20–60 | Mill speed, solids residence time, hammer type, screen size/type, feed size |
| Universal/pin mill | 15–30 | Mill speed, solids residence time, head type, feed size |
| Jet mill | 2–10 | Gas pressure, solids residence time |
38.3.2.1 Hammer Mill
Hammer mills involve feeding solids through a series of spinning hammers contained within a casing that may also contain breaker plates. Attrition of particles is accomplished through their impact with the hammers and the mill internals. A sieve screen at the mill outlet is used to limit the size of the particle that can exit the system. Hammer mills come in a wide range of motor speeds, and this is the most important parameter to investigate to ensure reliable scale‐up. Screen design is another important parameter, in that size and shape of perforations in the screen will affect mill residence time or how easily milled particles escape the chamber. The hammer mill is not ideal for milling very abrasive materials because significant metal erosion/mill wear can result over time. It is also not preferred for milling highly elastic materials, which could blind the screen, reduce gas flow through the mill, and lead to overheating.
38.3.2.2 Universal/Pin Mill
The term “universal” mill usually refers to a mill configuration where multiple milling heads can be used. These mills often can be fitted with pin, turbo rotor, and hammer‐type heads. Pin mills operate similarly to hammer mills but with typically faster rotor speeds and small clearances between rotating and stationary pins. Solids are fed to a milling chamber in a conveyance gas stream. The milling chamber contains a high‐speed rotor/stator configuration of pins, which impact the particles as solids are directed from the center of the pin disk out through all the rows of intermeshing pins (Figure 38.3). Control parameters to adjust and vary the output PSD include pin gap or pin spacing, the rotational speed of the rotor, solids feed rate, size of the mill, and velocity of the carrier gas used to convey the solids out of the mill.

FIGURE 38.3 Pin mill internals.
Source: Photo courtesy of Hosokawa Micron Powder Systems.
38.3.2.3 Jet Mill
Jet mills are an alternative to hammer or pin milling, where the primary mode of action is mechanical impact of the mill with the particle. With jet milling, micronization is accomplished mainly through particle–particle and particle‐wall collisions caused by high velocity gas streams. Spiral jet mills, loop jet mills, and fluidized bed jet mills are examples of jet or fluid energy mills. These jet mills use the same general operating principle. Through the introduction of high pressure air or other carrier gas (i.e. nitrogen) into specially designed nozzles, the potential energy of the compressed gas is converted into a grinding stream at sonic or supersonic velocities.
Differences in the various jet mills are predominantly in the geometry of the grinding chamber itself. Spiral mills create a high velocity helix of gas that rotates around the center of the circular jet mill. Solids are introduced via a venturi feed eductor (Figure 38.4) and become entrained in the turbulent helical flow. The resulting high‐energy collisions between particles as well as between the particles and the mill internals fracture particles to micron and submicron size. For loop jet mills, air or carrier gas is injected into an oval grinding loop or “race track” through specially designed nozzles (Figure 38.5). Solids are introduced in a manner similar to the spiral jet mill. In both designs, particles will classify based on their relative inertia toward the outlet of the mill, resulting in larger particles remaining in the grinding chamber longer while smaller particles are carried out of the mill with the overall gas exhaust to the collection cyclone or chamber. This permits some internal classification and makes the spiral or loop mill performances somewhat less dependent on feed particle size, compared with hammer and pin mills. A derivation is available for spiral jet mill cut size as a function of micronization settings, gas properties, and other empirical constants for the material and mill [31]. Key scale‐up parameters are the grinder nozzle pressure and the mill residence time, typically determined as particle density in the mill (ratio of solid mass flow to volumetric gas flow through the mill).
FIGURE 38.4 Spiral jet or “pancake” mill.
Source: Photo courtesy of Hosokawa Micron Powder Systems.

FIGURE 38.5 Loop jet mill.
In fluidized bed jet mills, the grinding chamber is oriented as a fluidized bed, with specially designed nozzles introducing the grinding gas at the bottom of the mill chamber, creating high intensity collisions between particles (Figure 38.6). Net vertical gas flow out of the mill fluidizes the milled material in the grinding chamber. Fluidized bed jet mills are usually fitted with a classification wheel. Based on the rotational speed of the classifier wheel, large particles gain radial momentum and are returned to the grinding zone of the fluidized bed. Lighter particles can escape the mill through vanes in the classifier wheel, carried by the main gas exhaust. This type of arrangement can lead to much narrower PSDs than other types of jet milling equipment. In addition to grinder pressure, classifier speed is clearly an important scale‐up parameter. To control the solids residence time in the mill, nozzle diameter, total gas flow rate, and mill chamber pressure can be varied with solids feed rate, and these variables must be controlled on scale‐up as well.

FIGURE 38.6 Fluidized bed jet mill with classification.
Source: Photo courtesy of Hosokawa Micron Powder Systems.
38.3.3 Wet Milling Setup
Milling a solid suspended in liquid is referred to as either wet or slurry milling. Figure 38.7 shows a generalized setup for a wet milling operation. Wet milling typically occurs in a recirculation loop from a well‐mixed holding vessel. Solids are suspended in an appropriate solvent or solvent mixture, either through selective crystallization from that solvent mixture or the reslurry of previously isolated solids. The system is agitated to maintain a well‐mixed suspension and prevent plugging of the vessel outlet. The slurry is circulated through the wet mill and cycled back to the holding vessel. Wet milling operations can easily be part of a continuous API or drug product manufacturing process.
FIGURE 38.7 General setup for wet milling operations.
Slurry recirculation is continued until samples from the vessel show adequate reduction in particle size. Because of the nature of the recirculation operation, there exists a residence time distribution for particles within the slurry vessel. Where some particles will have traveled through the recirculation loop in multiple passes, some will have not yet passed at all. As a result, the distribution of particle sizes can tend to broaden over time. Operating repeatedly in single‐pass or “once‐through” mode may tighten the distribution, depending on solid properties.
Generally, a lower limit exists for the obtainable particle size. Figure 38.8 shows the X90 (90% of the particles have a diameter ≤X90) of a slurry of drug substance as a function of the mill passes (defined as the ratio of the volume of material processed to the volume of the slurry). As can be seen by the figure, a point of diminishing returns is often reached where further circulation through the mill does very little to further reduce the particle size but will continue to increase the levels of fines produced by chipping rather than mass fracture.
FIGURE 38.8 Particle size versus mill passes in a slurry milling operation.
38.3.4 Wet Milling Equipment
Wet milling offers many advantages to dry milling, though there are some limitations. One significant advantage is the ability to eliminate a separate unit operation of dry milling. Wet milling can be carried out as part of the final crystallization–isolation sequence. This approach eliminates the cycle time and cost associated with an extra unit operation, which can be particularly significant if special containment is necessary (for personnel protection). Wet mills also provide the ability to protect the product from the heat input from some dry milling equipment.
Multiple types of wet mills are available. The three most commonly used in pharmaceutical manufacturing are toothed rotor–stator mills, high pressure homogenizers, and media mills. The table below summarizes typical minimum particle sizes and main scale‐up parameters for these mills. If the mills are operated in recycle mode but not allowed to reach “steady‐state” milled particle size, feed particle size will also be an important scale‐up parameter.
| Mill Type | Typical Minimum Milled Size (μm) | Key Parameters |
| Toothed rotor–stator mill | 20–30 | Mill speed, tooth spacing, rotor–stator design, milling time (number of passes) |
| High pressure homogenizers | <1–10 | Gap size, pressure, number of homogenization cycles |
| Media mill | <1–10 | Mill speed, slurry composition, amount and size of media in mill |
38.3.4.1 Toothed Rotor–Stator Mills
Rotor–stator mills (Figure 38.9) consist of a rotating shaft (rotor), with an axially fixed concentric stator. Toothed rotor–stator mills have one or more rows of intermeshing teeth on both the rotor and the stator with a small gap between the rotor and stator. Variations in the number of teeth, teeth spacing, angle of incidence, etc. all impact the milling efficiency of toothed rotor–stator mills [32–34].
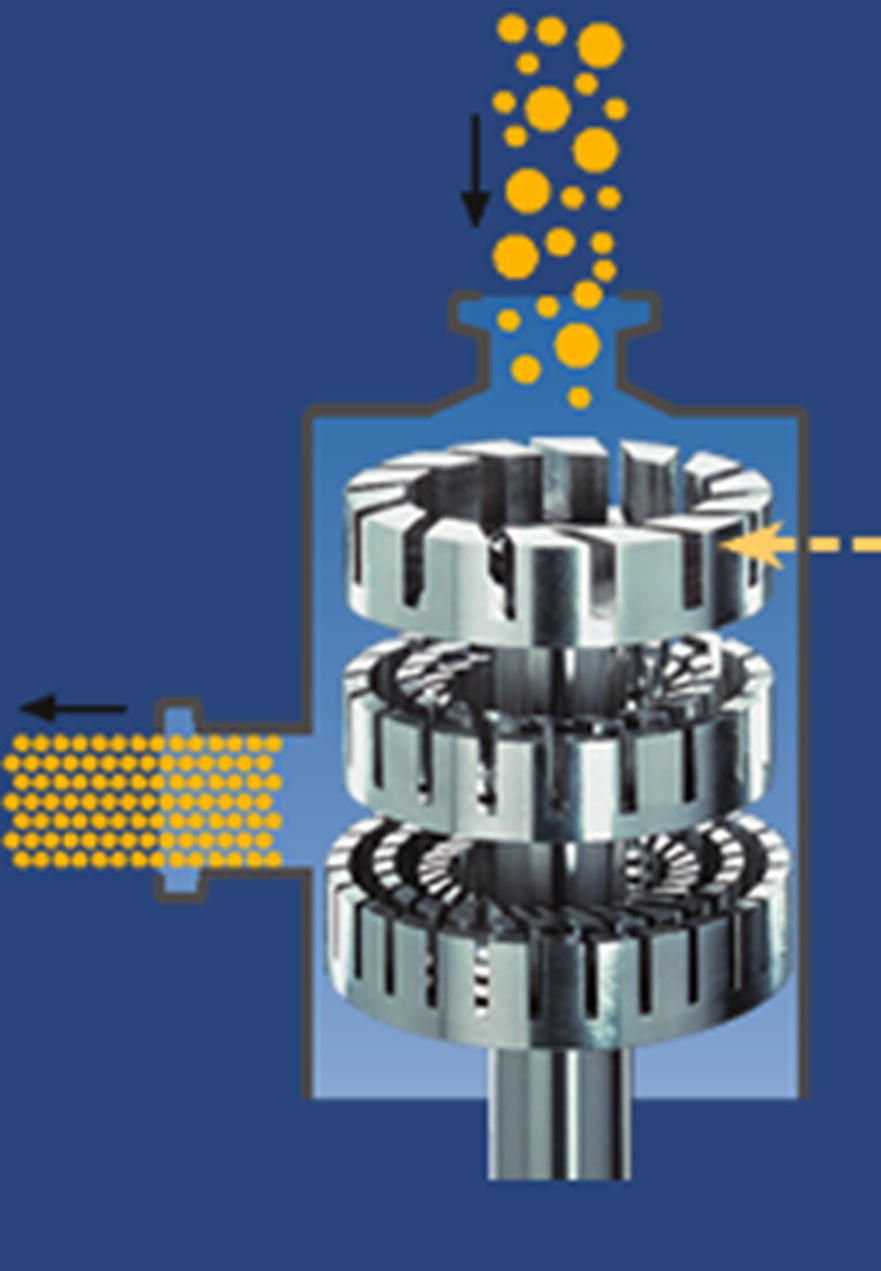
FIGURE 38.9 Wet mill internals.
Source: Photo courtesy of IKA Works Inc.
The differential speed between the rotor and the stator imparts extremely high‐shear and turbulent energy in the gap between the rotor and stator. In this configuration, particle size is reduced by both the high shear created in the annular region between the teeth and the collisions of particles on the leading edge of the teeth (Figure 38.10). Size is affected by selecting rotor–stator pairs with different gap thickness or by operating at different rotational rates (or tip speeds) of the rotor. Tip speed is a very important factor when considering the amount of shear input into the product. Tip speed (Sr) is determined according to the following equation:
where
- D is the rotor diameter
- ω is the rotation rate (rev/min)
The average shear created between the rotor and stator is a function of the tip speed and the gap thickness. The average shear rate ![]() is given by
is given by
where
- δ is horizontal gap distance between the rotor and stator.

FIGURE 38.10 Rotor–stator working principle.
Source: Photo courtesy of IKA Works Inc.
Another important factor is the number of occurrences when rotor and stator openings mesh. This is known as the shear frequency (fs) and is calculated as
where
- Nr and Ns are number of teeth on the rotor and stator, respectively.
The shear number (NSh) is given by
Depending upon the rotor–stator design, the number of rows should be accounted for when calculating the shear number. Scale‐up of toothed rotor–stator mills is accomplished by determining for the material in question whether shear frequency or tip speed has greater control over milled size and then working with rotor–stator design options and mill speed to maintain the key parameter across scales. If milling will be stopped before steady state/minimum size is achieved, the process must also be scaled on batch turnovers or passes through the mill.
In addition to the scale‐up guidelines mentioned above, integral scale‐up factors have been proposed. The term “integral” is used here to indicate that the milling time is also taken into account [35]. One approach calculates the normalized energy imparted to particles during milling (E*) and introduces a new scale‐up parameter [35]:

where
- Qmill is the volumetric flow rate.
- Wr and Hr are the rotor slot width and height, respectively.
- Subscript b indicates a reference experiment.
- Nbt is the total number of batch turnovers.
- Ng is the number of generators (rotor/stator pairs) in the mill.
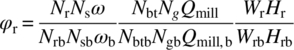
Another approach defines a number of slot events (Nse) to correct the conventional number of batch turnovers as an integral scale‐up factor [36]. In this approach, the same tip speed is used at different scales but incorporates geometrical considerations of slots as well as of the bypass region to correct the elapsed milling time as follows [36]:
where
- Ws and Hs are the stator slot width and height, respectively.
- Dr is the rotor diameter.
- ℓ is the vertical gap between rotor and stator.
38.3.4.2 High Pressure Homogenizer
High pressure homogenization is a high‐energy process in which size reduction of API particles is achieved by repeatedly cycling a slurry through a gap or orifice at high velocity, around 500 m/s, and pressure, 1000–1500 bars (Figure 38.11) [37]. When the slurry is forced through a gap at a high flow rate, the downstream pressure on the liquid falls below the vapor pressure of the liquid at the system temperature, and gas bubbles are formed. Bubbles collapse when the liquid exits from the gap. The cavitation forces arising from the formation and collapse of the gas bubbles, coupled with very high shear stresses, acceleration, impact, and intense turbulent flow in the liquid, result in effective particle breakage. The highly disruptive energy generated by high pressure homogenizers can produce extremely fine suspensions with particle sizes of less than 1 μm.

FIGURE 38.11 Schematic diagram of a high pressure homogenizer.
High pressure homogenization is widely used in the pharmaceutical and food industries [38, 39].
High pressure homogenizers expose drug particles to a power density greater than 1000 W/m3. The high energy activates the drug particles, potentially leading to partial or complete amorphization of the drug [38, 40].
38.3.4.3 Media Mills
Media mills, also referred to as pearl or bead mills, are much different in operation than a rotor–stator mill. The mill is composed of a milling chamber, milling shaft, and product recirculation chamber (Figure 38.12). The milling shaft extends the length of the chamber. A shaft can have either radial protrusions or fingers extending into the milling chamber, a series of disks located along the length of the chamber, or a relatively thin annular gap between the shaft and mill chamber. The chamber is filled with spherical milling media usually less than 2 mm in diameter and typically 1 mm in diameter or less. Media are retained in the mill by a screen located at the exit of the mill. The rotation of the shaft causes the protrusions to move the milling media, creating high shear forces [41]. Scale‐up of media mills is accomplished by maintaining residence time in the mill, keeping the milling media size constant, and holding energy input constant.
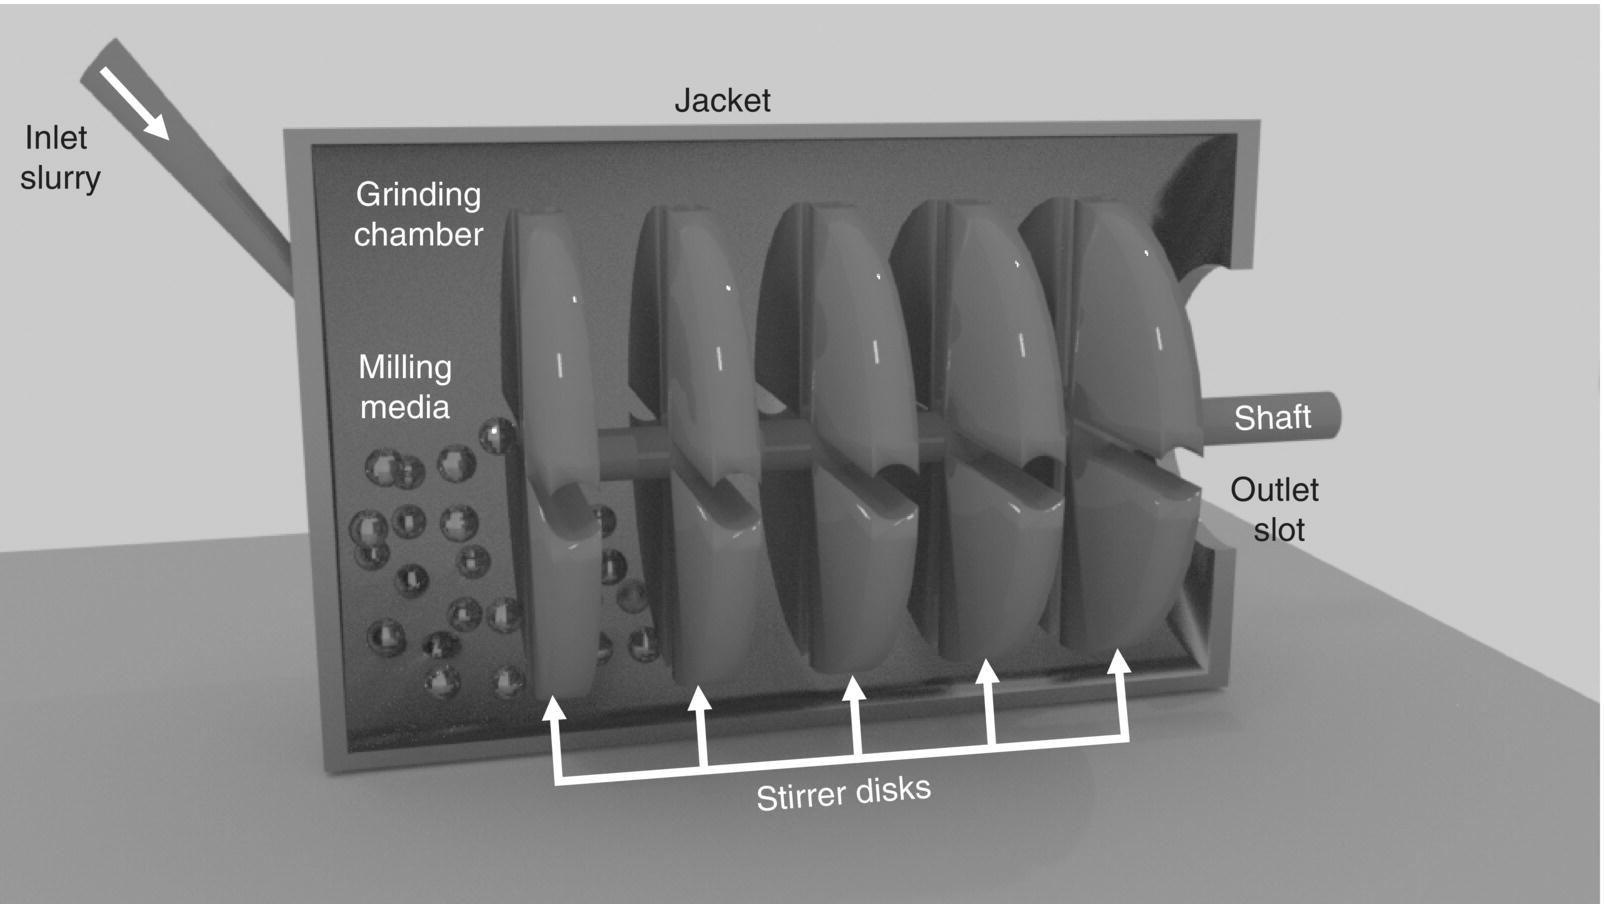
FIGURE 38.12 Schematic diagram of a media mill.
The high energy and shear that result from the movement of the milling media is imparted to the particles as the material is held in the mill or recirculated through the milling chamber by an external recirculation loop. Particles are ground by a combination of particle–media, particle–particle, and particle–wall collisions. These mills can produce submicron particles. Thermally labile material is easily handled as the milling chamber is jacketed. By utilizing smaller media (<100 μm), nanosized (20 nm) particles are achievable.
At the small size scales achievable by media milling, particle–particle interactions caused by van der Waals forces can begin to dominate [42]. By inclusion of certain additives to the dispersion fluid, the possible agglomeration and resulting reduced efficiency and reduced effectiveness of the mill can be mitigated. Surfactants can inhibit agglomeration by both electrostatic and steric stabilizations [43]. Similarly, polymeric stabilizers can also be used to retard agglomeration. The smaller the particle produced, the greater the amount of surfactant needed since the specific surface area of the particle increases proportionately with particle radius.
Milling media are available as glass, metals, ceramics such as zirconium oxide, and polymers such as a highly cross‐linked polystyrene resin. The proper selection of the milling media is an important criterion in the milling process. Materials such as glass and metals are typically not used for APIs since some abrasion of the milling media can occur, potentially resulting in extraneous material concerns. As a result, either polymeric or ceramic media are usually used.
38.4 MECHANISTIC MODELS
One of the most common ways to mathematically describe milling processes involves the use of population balance equations (PBEs). One of the key benefits of using PBEs is the ability to predict evolution of PSDs when multiple phenomena are involved such as primary nucleation, agglomeration, dissolution, and growth.
For a continuous milling process where nucleation, dissolution, agglomeration, and growth are neglected, the PBE can be simply expressed as follows [44]:
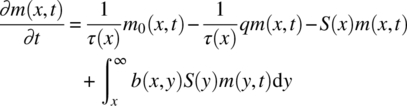
where
- m(x,t) and m0(x,t) are the masses of particles of size x at time t at the mill outlet and inlet streams, respectively.
- τ(x) is the residence time of particles in the mill of size x.
- S(x) is the specific breakage rate of particles of size x.
- b(x,y) is the mass‐based breakage distribution function that specifies the mass of fragments of child particle of size x formed when larger particles of size y are broken.
Equation (38.11) assumes first‐order kinetics for breakage [45].
A size‐discrete version of Eq. (38.11) is as follows:

where
- subscripts i and j represent bin sizes/classes.
The most commonly used convention establishes that bin 1 contains the coarsest particle, while size N contains the finest particle. The size discretization results in a set of ordinary differential equations, where Si and bi,j establish both breakage rate and breakage distribution function.
A variety of models have been proposed to describe specific breakage rate and breakage distribution functions for milling processes including empirically based equations 46, 47], statistically based models [48, 49], fracture mechanics‐based expressions [50–54], and data‐driven expressions [55, 56]. Table 38.1 summarizes some of the most common equations used to describe grinding processes.
TABLE 38.1 Examples of Common Equations Used to Describe Grinding Processes
| Approach | Equations | Uses | Reference |
| Empirical | bi, j = Bi, j − Bi + 1, j |
Ball and rod mill, ball‐and‐race pulverizer, shredder‐cutter mill, hammer mill, conical mill, and wet mill. Model has been tested for a variety of materials | Refs. [46, 47] |
| Statistical | Product function with a power law form: Summation function with a power law form: Bivariate kernels have been also developed |
Stirred vessels and various mills. Model has been tested for sugar crystals | Refs. [48, 49] |
| Fracture mechanics (energy) based | PB = 1 − exp[−fMat × k(Wm, kin − Wm, min)] |
Hammer mill and air classifier mill. The model performance has been tested for variety of materials | Refs. [52, 53] |
| Jet mill. It was tested with several organic compounds and APIs | Refs. [50, 51, 54] | ||
| Data driven | βi, j = (1 − kc)σj for i = j + 1 βi, j = kcσj for i = smallest bin βi, j = 0 for any other bin ni = w0 + wGPGP + wPPPP + wFRFR + wsizexi + wGPPPGP ⋅ PP θ = a0 + aGPGP + aPPPP + aFRFR |
Spiral air jet mil. The model was tested with sodium bicarbonate, α‐lactose monohydrate, and sucrose | Refs. [55, 56] |
Commercial implementations of PBE‐based grinding models are available for practitioners. For instance, DynoChem by Scale‐up Systems provides an implementation of the model by Vogel and Peukert [52, 53] for wet and dry milling applications. The mill model in gPROMS FormulatedProducts by Process Systems Enterprise Ltd. accounts for most of the specific breakage rates and breakage distribution function models listed in Table 38.1. Moreover, gPROMs Formulated Products allows milling unit operations to be integrated with drug substance and drug product unit operations in a single flowsheet.
38.5 CASE STUDIES
Throughout the development cycle of a drug substance, different PSDs may be studied to determine the optimum size range for an API or excipient. Milling process parameters that achieve these profiles have often been determined in an empirical fashion through the use of test milling – portions of a material lot are subjected to different milling conditions, and the resultant output is tested to determine PSD. While useful in establishing milling ranges for one particular lot of material, test mill runs do not easily allow extrapolation to different milling input conditions. As quality‐by‐design expectations continue to increase within the pharmaceutical processing world, an understanding of milling process parameters, as well as input PSD and their effect on final API attributes, is desirable.
In what follows, two examples of potential approaches to describe milling processes are presented: (i) statistical model and (ii) mechanistic model.
38.5.1 Milling: Statistical Model
As an example, a simple model for particle breakage, like the one shown in Eq. (38.13), would likely predict an output parameter, such as the X50 of the PSD, as a function of one or more input parameters:
To utilize this type of model, the input properties must be chosen, and parameters simulating residence time and energy input must be determined. For example, consider the case of dry milling of a material that has been crystallized and then dried in an agitated filter dryer. As a first approach, a static parameter such as the unmilled X50 of the slurry could be chosen as the input size, the mass feed rate (m) to the mill chosen as a surrogate for residence time, and rotor tip speed (ν) chosen for energy input:
Figure 38.13 shows the relationship between predicted and actual milled values using such a model following a calibration exercise to fit the exponents and the constant K.
FIGURE 38.13 Predictive ability of a milling model utilizing unmilled slurry X50 as an input parameter.
While a rough trend may be observed between predicted and actual, the accuracy of this model is not sufficient for predicting actual output PSD. Further examining the choice of input parameters for the model, one can observe that while the X50 of an in‐process sample from the crystallizer may represent the slurry PSD adequately prior to drying (Figure 38.14), this parameter may be insufficient to capture variations in actual mill input material following the final drying unit operation (Figure 38.15). The relatively unimodal peaks from the slurry samples clearly change to a wide variety of average sizes and modalities after drying in an agitated filter dryer. It is this variability in size entering the milling step that makes prediction difficult for a simple model such as that of Eq. (38.14).
FIGURE 38.14 Particle size of the API coming out of the crystallizer.
FIGURE 38.15 Particle size of API following agitated drying.
To account for the variability seen in the dried material prior to milling, a simple summary statistic cannot be used. Rather, a measure of the entire PSD should be utilized to inform the model of the distribution of particle sizes moving into the breakage operation. Most particle size analyzers generate histograms with multiple channels of data describing the overall distribution of particle sizes in the sample. Chemometric methods such as principal component analysis (PCA) allow the full shape of the PSD to be reduced from a very large number of histogram components to 2–3 principal components describing the breadth, shape, and skewedness of the distribution. Using PCA in this manner maintains model inputs to a minimum number without significant loss in ability to characterize the full PSD spectrum.
After adding the principal components to the model to accurately represent the shape of the distribution, our equation becomes
where
- PCA1, PCA2, and PCA3 represent the three principal components of the PSD.
This enhancement to the model, following a short number of calibration runs, allows much better prediction of output X50, as shown in Figure 38.16.

FIGURE 38.16 Predictive ability of a milling model incorporating full PSD spectrum as an input.
The final predictive model is still limited to the API that was used to generate the data. However, the model allows for prediction as needed, and the process of constructing the model may provide valuable information regarding the API, including the relative importance of inclusion of the entire PSD spectrum as well as the impact that filtration and drying technique may have upon milling performance.
38.5.2 Wet Milling: Mechanistic Model Approach
Mechanistic models describe the physics of the particle breakage process, and therefore they can be extrapolated as far as the underlying assumptions are met. Mechanistic models can be used not only for scale purposes but also for risk assessment and definition of proven acceptable ranges as well as design space [57].
As an example of the use of mechanistic models to scale up a wet milling process, small‐scale experiments were performed at different mill rotation rates using an IKA Magic Lab homogenizer (three fine heads) using a recirculation loop configuration (Figure 38.17a). A PBE was used following the same equations as in Luciani et al. [44] Parameters to define specific breakage rate were correlated with the shear number (i.e. Si = Sc(xi/xc)α, with Sc = ANSh + B) by minimizing the sum of relative squared deviations between experimental X90, X50, and X10 for different rotation rates. The critical particle size below which particle breakage does not occur (xc) was determined experimentally and correlated to cumulative energy transferred to particles during milling as shown in Figure 38.18. The cumulative energy transferred to particles during milling was adopted to be a function of the product between shear number (NSh) and the residence time in the mill (τ). For simplicity, a simple breakage distribution function was adopted (Bi, j = (xi/xj)) to describe the breakage mechanism. The model ability to capture milling curves is illustrated in Figure 38.17b.
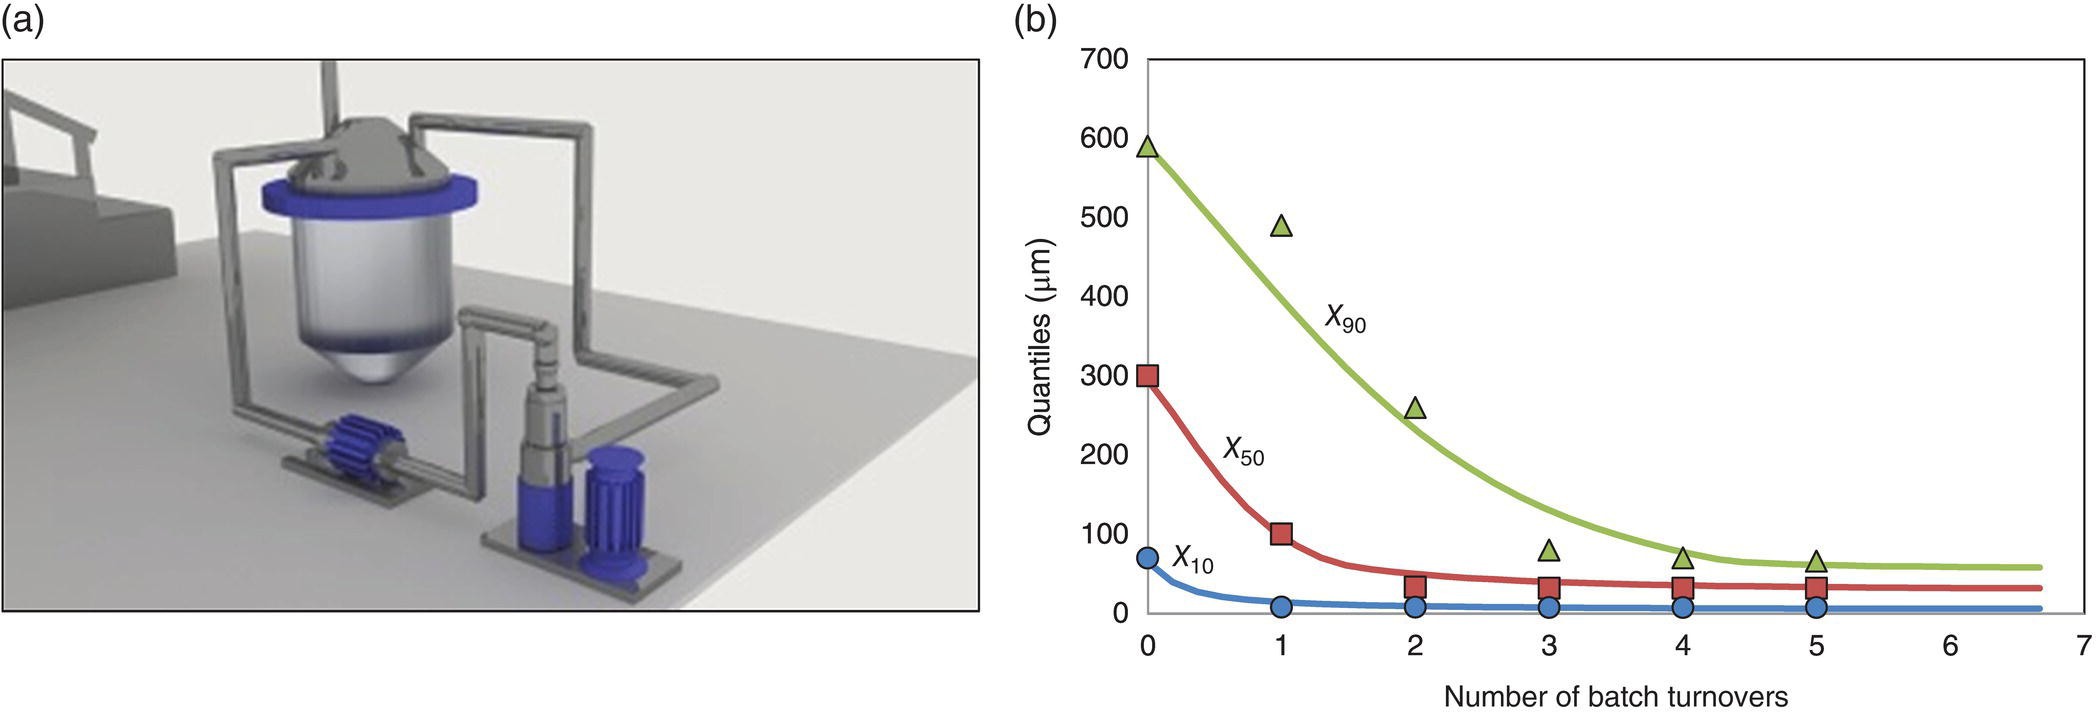
FIGURE 38.17 (a) Investigated recirculation loop (small‐scale) wet mill configuration. (b) Experimental and simulated milling curve (small‐scale) (experiments, symbols; simulation, traces).

FIGURE 38.18 Impact of shear number (NSh) and residence time in mill (τ) on diameter below which breakage does not take place.
As described, the population balance model considers the impact of mill geometry, initial PSD, scale, circulation flowrate, mill rotation rate, and mill configuration, but it does not account for particle mechanical properties, slurry density, and suspension medium.
Equation (38.12), Austin’s model for breakage rate, and the aforementioned simplified breakage distribution function were used to define target conditions when the milling process scale was changed from 0.1 to 12 kg API batch size, a larger mill (DRS 2000/5 homogenizer with 3 super fine heads), and different configuration (single pass), were used (Figure 38.19a). Since mechanistic models capture the physics of particle breakage, a relatively good prediction of the milling performance was achieved in this case.
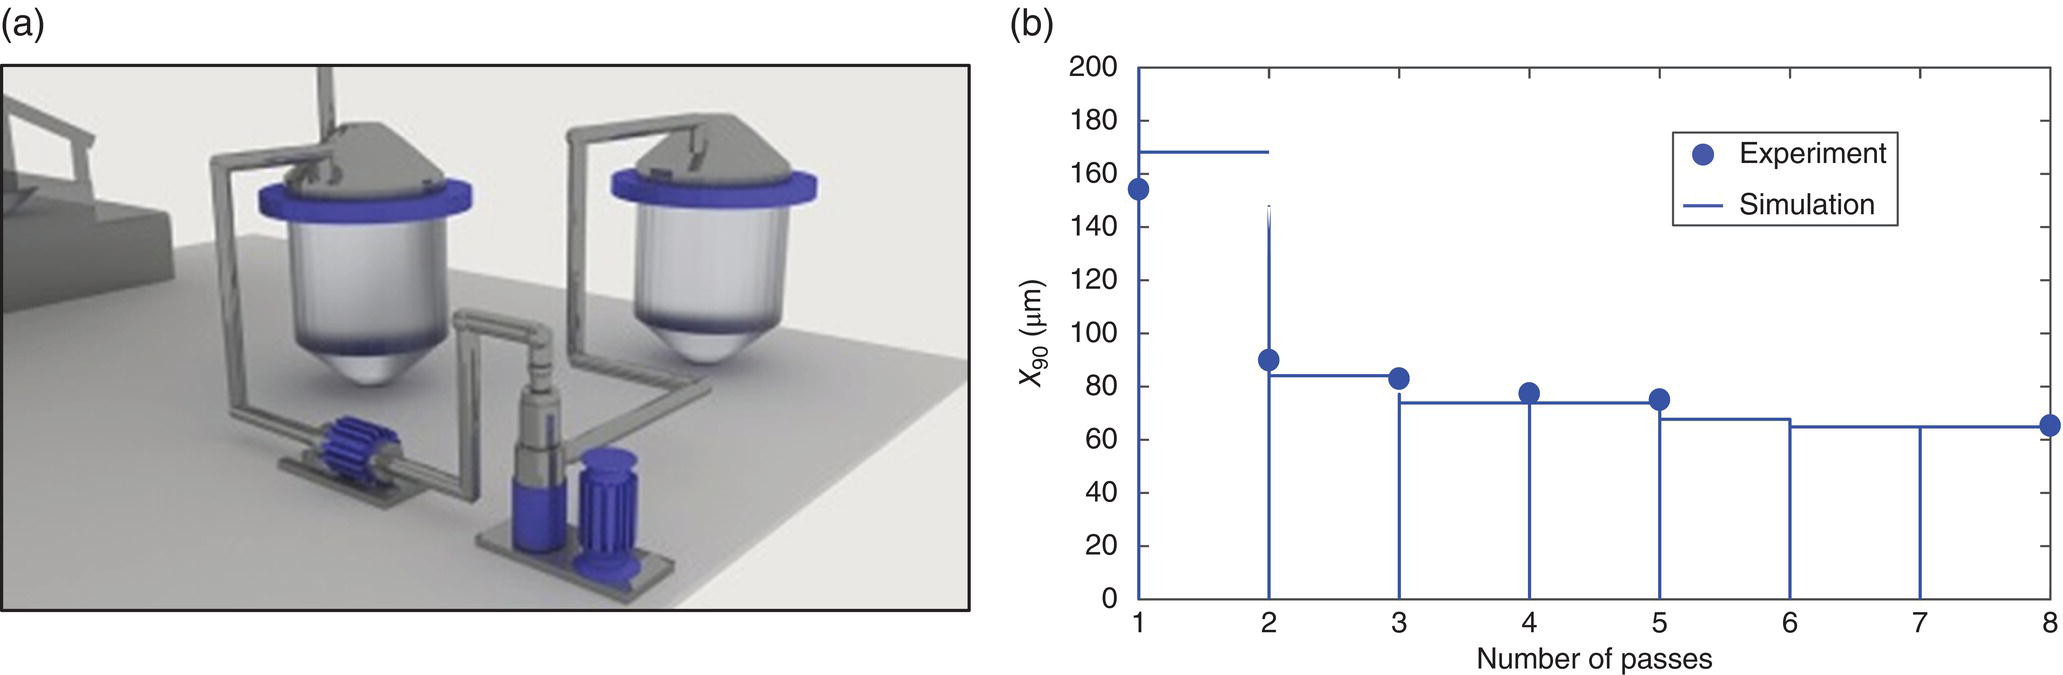
FIGURE 38.19 (a) Investigated large scale wet mill single pass configuration. (b) Comparison of experimental and simulated milling curves (large‐scale).
Figure 38.20 shows the impact of shear number and number of passes on X90. Increasing shear number and/or number of passes reduces particle size. For large NSh and number of passes, however, the impact to particle size is limited since the energy imparted to particles cannot induce further breakage. As illustrated in Figure 38.19b, models can also be used to map the impact of process parameters on X90, determining optimal target conditions for robust milling as well as the feasible operating region [57].

FIGURE 38.20 Contour plot of X90 (in μm) as a function of shear number and number of passes for single‐pass configuration wet mill.
38.6 CONCLUSIONS
Milling is a powerful unit operation to aid in the control of particle size for a variety of processing, bioavailability, reactivity, and safety‐related drivers. Milling can be helpful in controlling PSD for a variety of solids, including API, isolated intermediates, and formulated intermediates from a drug product process. While both wet and dry milling options are available to engineers as potential unit operations for particle size reduction, each infrastructure offers unique advantages and disadvantages that can be exploited to ensure the most robust, cost‐effective, and safe process can be developed. A variety of modeling techniques have been employed to better predict milling performance at large scale from a minimal data set of particle physical properties and smaller‐scale milling trials. As time and cost pressures continue to drive leaner, material‐sparing development programs, heavier reliance on modeling and predictive techniques will likely become a more significant element of the engineer's efforts in process optimization.
38.7 NOMENCLATURE
- aGP, aPP, and aFR
- jet mill‐dependent parameter
- a0
- jet mill material‐dependent parameter
- b(x,y)
- distribution of fragments of child particle of size x formed when larger particles of size are broken, dimensionless
- bi, j
- discrete distribution of fragments of child particle of size i formed when larger particles of size j are broken, dimensionless
- Bi, j
- discrete cumulative distribution of fragments of child particle of size i formed when larger particles of size j are broken, dimensionless
- c
- energy‐based model constant
- D
- wet mill rotor diameter, m
- Efract
- fracture energy, J/m3
- Ekin
- kinetic energy of the particles, J
- fMat
- mass‐based material strength
- FR
- jet mill feed flow rate, kg/s
- fS
- wet mill shear frequency, 1/s
- GP
- jet mill grinding pressure, Pa
- H
- material hardness, Pa
- Hr
- wet mill rotor slot height, m
- Hs
- wet mill stator slot height, m
- k
- number of impacts, dimensionless
- kc
- conditional probability of chipping upon breakage, dimensionless
- K1c
- stress intensity factor, Pa∙m1/2
- l/xi
- relative length of the initial cracks, dimensionless
- m
- positive integer use in statistical‐based breakage model, dimensionless
- m(x,t)
- mass of particles of size x at time t at the mill outlet, kg
- m0(x,t)
- mass of particles of size x at time t at the mill inlet, kg
- n
- power law coefficient, dimensionless
- Nbt
- number of batch turnovers, dimensionless
- Nr
- number of teeth on wet mill rotor, dimensionless
- Ns
- number of teeth on wet mill stator, dimensionless
- Nse
- number of slot events, dimensionless
- NSh
- shear number, 1/s2
- p
- number of child particles formed upon breakage
- PB
- probability of breakage upon impact, dimensionless
- PP
- jet mill pusher pressure, Pa
- Py
- yield pressure, Pa
- Qmill
- wet mill volumetric flow rate, m3/s
- S(x)
- specific breakage rate of particles of size x, 1/s
- Si
- discrete specific breakage rate, 1/s
- Sr
- wet mill rotor tip speed, m/s
- V
- volume of mill chamber, m3
- Vi
- volume of the particle, m3
- Wm,kin
- mass‐specific impact energy
- Wm,min
- mass‐specific threshold energy (mass‐specific energy that a particle can absorb without fracture)
- Wr
- wet mill rotor slot width, m
- Ws
- wet mill stator slot width, m
- w0, wGP, wPP, wFR, and wGPPP
- jet mill‐dependent parameters
- wsize
- jet mill material‐dependent parameter
- x, y, y′
- particle sizes, m
- X10, X50, X90
- PSD quantiles, μm
SYMBOLS
-

- average shear rate, 1/s
- δ
- horizontal gap distance between the rotor and stator, m
- θ
- jet mill average productive impact angle, radian
- ρ
- material density, kg/m3
- σj
- probability of breaking a particle in given residence time, dimensionless
- τ(x)
- residence time of particles of size x, s
- ϕ, γ, β
- Austin's model parameters, dimensionless
- ω
- wet mill rotation rate, 1/s
- ℓ
- vertical gap distance between the rotor and stator, m

- crack propagation velocity, m/s
SUBSCRIPTS
- 1
- coarsest particle size
- i, j
- bin classes
REFERENCES
- 1. Parrott, E.L. (1974). Milling of pharmaceutical solids. J. Pharm. Sci. 63 (6): 813–829.
- 2. Amidon, G.L., Lennernas, H., Shah, V.P., and Crison, J.R. (1995). A theoretical basis for a biopharmaceutic drug classification: the correlation of in vitro drug product dissolution and in vivo bioavailability. Pharm. Res. 12: 413–420.
- 3. Oh, D.M., Curl, R., and Amidon, G. (1993). Estimating the fraction dose absorbed from suspensions of poorly soluble compounds in humans: a mathematical model. Pharm. Res. 10: 264–270.
- 4. FDA (2015). Waiver of in vivo bioavailability and bioequivalence studies for immediate‐release solid oral dosage forms based on a biopharmaceutics classification system. U.S. Department of Health and Human Services Food and Drug Administration Center for Drug Evaluation and Research (CDER) May 2015, Revision 1.
- 5. Rohrs, B.R., Amidon, G.E., Meury, R.H. et al. (1996). Particle size limits to meet USP content uniformity criteria for tablets and capsules. J. Pharm. Sci. 95 (5): 1049–1059.
- 6. Shoyele, S.A. and Cawthorne, S. (2006). Particle engineering techniques for inhaled biopharmaceuticals. Adv. Drug Deliv. Rev. 58 (9–10): 1009–1029.
- 7. Malcolmson, R.J. and Embleton, J.K. (1998). Dry powder formulations for pulmonary delivery. Pharm. Sci. Technol. Today 1: 394–398.
- 8. Holve, D.J. and Harvill, T.L. (1996). Particle size distribution measurements for in‐process monitoring and control. Adv. Powder Metall. Part. Mater. 1: 4.81–4.93.
- 9. Collin, A. (1997). Online control of particle size distribution. Spectra Analyse 26 (196): 31–33.
- 10. Harvill, T.L., Hoog, J.H., and Holve, D.J. (1995). In‐process particle size distribution measurements and control. Part. Part. Syst. Charact. 12 (6): 309–313.
- 11. Snow, R.H., Allen, T., Ennis, B.J., and Litster, J.D. (1997). Size reduction and size enlargement. In: Perry’s Chemical Engineers' Handbook, 7e (ed. R.H. Perry and D.W. Green). New York: McGraw Hill.
- 12. Popov, K.I., Krstic, S.B., Obradovic, M.C. et al. (2003). The effect of the particle shape and structure on the flowability of electrolytic copper powder. I. Modeling of a representative powder particle. J. Serb. Chem. Soc. 68 (10): 771–777.
- 13. Brittain, H.G., Bogdanowich, S.J., Bugay, D.E. et al. (1991). Review: physical characterization of pharmaceutical solids. Pharm. Res. 8: 963–973.
- 14. Gabaude, C.M.D., Gautier, J.C., Saudemon, P., and Chulia, D. (2001). Validation of a new pertinent packing coefficient to estimate flow properties of pharmaceutical powders at a very early development stage, by comparison with mercury intrusion and classical flowability methods. J. Mater. Sci. 36: 1763–1773.
- 15. Lindberg, N.O., Palsson, M., Pihl, A.C. et al. (2004). Flowability measurements of pharmaceutical powder mixtures with poor flow using five different techniques. Drug Dev. Ind. Pharm. 30: 785–791.
- 16. Ward, G.H. and Shultz, R.K. (1995). Process‐induced crystallinity changes in albuterol sulfate and its effect on powder physical stability. Pharm. Res. 12: 773–779.
- 17. Buckton, G. (1997). Characterization of small changes in the physical properties of powders of significance for dry powder inhaler formulations. Adv. Drug Deliv. Rev. 26: 17–27.
- 18. Price, R. and Young, P.M. (2005). On the physical transformations of processed pharmaceutical solids. Micron 36: 519–524.
- 19. Ghadiri, M., Kwan, C., and Ding, Y. (2007). Analysis of milling and the role of feed properties. In: Handbook of Powder Technology, vol. 12. Elsevier B.V.
- 20. ICH Harmonized Guideline (2014). Guideline for elemental impurities Q3D, 16 December 2014.
- 21. Cashdollar, K. (1996). Coal dust explosivity. J. Loss Prev. Process Ind. 9 (1): 65–76.
- 22. Eckhoff, R.K. (2003). Dust Explosions in the Process Industries, 3e. Burlington, MA: Gulf Professional Publishing.
- 23. Eckhoff, R.K. (1991). Dust Explosions in the Process Industries. Oxford: Butterworth‐Heinemann Ltd.
- 24. Jaeger, N. and Siwek, R. (1999). Prevent explosions of combustible dusts. Chem. Eng. Prog. June: 25–37.
- 25. Stevenson, B. (2001). Preventing disaster: analyzing your plant's dust explosion risks. Powder Bulk Eng. 15: 19–27.
- 26. Britton, L.G. (1999). Avoiding Static Ignition Hazards in Chemical Operations. New York: Center for Chemical Process Safety of the AIChE.
- 27. Liotta, V. and Sabesan, V. (2004). Monitoring and feedback control of supersaturation using ATR‐FTIR to produce and active pharmaceutical ingredient of a desired crystal size. Org. Process. Res. Dev. 8: 488–494.
- 28. Dennehy, R.D. (2003). Particle engineering using power ultrasound. Org. Process. Res. Dev. 7: 1002–1006.
- 29. Kim, S., Lotz, B., Lindrud, M. et al. (2005). Control of particle properties of a drug substance by crystallization engineering and the effect on drug product formulation. Org. Process. Res. Dev. 9: 894–901.
- 30. Tung, H.H., Paul, E.L., Midler, M., and McCauley, J.A. (2009). Crystallization of Organic Compounds: An Industrial Perspective. New York: Wiley.
- 31. MacDonald, R., Rowe, D., Martin, E., and Gorringe, L. (2016). The spiral jet mill cut size equation. Powder Technol. 299: 26–40.
- 32. Urban, K., Wagner, G., Schaffner, D. et al. (2006). Rotor‐stator and disc systems for emulsification processes. Chem. Eng. Technol. 29 (1): 24–31.
- 33. Lee, I., Variankaval, N., Lindemann, C., and Starbuck, C. (2004). Rotor‐stator milling of APIs: empirical scale up parameters and theoretical relationships between the morphology and breakage of crystals. Am. Pharm. Rev. 7 (5): 120–123.
- 34. Atiemo‐Obeng, V. and Calabrese, R. (2003). Rotor stator mixing devices. In: Handbook of Industrial Mixing, 1e (ed. E.L. Paul, V. Atiemo‐Obeng and S. Kresta). New York: Wiley.
- 35. Engstrom, J., Wang, C., Lai, C., and Sweeney, J. (2013). Introduction of a new scaling approach for particle size reduction in toothed rotor‐stator wet mills. Int. J. Pharm. 456: 261–268.
- 36. Harter, A., Schenck, L., Lee, I., and Cote, A. (2013). High‐shear rotor–stator wet milling for drug substances: expanding capability with improved scalability. Org. Process. Res. Dev. 17: 1335–1344.
- 37. Loh, Z.H., Samanta, A.K., and Heng, P.W.S. (2015). Overview of milling techniques for improving the solubility of poorly soluble drugs. Asian J. Pharm Sci 10: 255–274.
- 38. Mohr, K.H. (1987). High‐pressure homogenization. Part I. Liquid‐liquid dispersion in turbulence fields of high energy density. J. Food Eng. 6: 177–186.
- 39. Pandolfe, W.D. (1981). Effect of dispersed and continuous phase viscosity on droplet size of emulsions generated by homogenization. J. Dispers. Sci. Technol. 2: 459–474.
- 40. Müller, R.H. and Peters, K. (1998). Nanosuspensions for the formulation of poorly soluble drugs. I. Preparation by a size‐reduction technique. Int. J. Pharm. 160: 229–237.
- 41. Kwade, A. and Schwedes, J. (2007). Wet grinding in stirred media mills. In: Handbook of Powder Technology, vol. 12 (ed. A.D. Salman, M. Ghadiri and M.J. Hounslow), 229–249. Amsterdam: Elsevier.
- 42. Russel, W.B., Saville, D.A., and Schowalter, W.R. (1991). Colloidal Dispersions. New York: Cambridge University Press.
- 43. Bilgili, E., Hamey, R., and Scarlett, B. (2006). Nano‐milling of pigment agglomerates using a wet stirred media mill: elucidation of the kinetics and breakage mechanisms. Chem. Eng. Sci. 61 (1): 149–157.
- 44. Luciani, C., Conder, E., and Seibert, K. (2015). Modeling‐aided scale‐up of high‐shear rotor–stator wet milling for pharmaceutical applications. Org. Process. Res. Dev. 19 (5): 582–589.
- 45. Bilgili, E., Yepes, J., and Scarlett, B. (2006). Formulation of a non‐linear framework for population balance modeling of batch grinding: beyond first‐order kinetics. Chem. Eng. Sci. 61: 33–44.
- 46. Austin, L., Shoji, K., Bhatia, V. et al. (1976). Some results on the description of size reduction as a rate process in various mills. Ind. Eng. Chem. Process. Des. Dev. 15: 187–196.
- 47. Austin, L., Klimpel, R., and Luckie, P. (1984). Process Engineering of Size Reduction: Ball Mill. New York: Society of Mining Engineers of the American Institute of Mining, Metallurgical, and Petroleum Engineers.
- 48. Hill, P. and Ng, K. (1996). Statistics of multiple particle breakage. AIChE J. 42: 1600–1611.
- 49. Hill, P. (2004). Statistics of multiple particle breakage accounting for particle shape. AIChE J. 50: 937–952.
- 50. de Vegt, O., Vromans, H., Faasen, F., and van der Voort Maarschalk, K. (2005). Milling of organic solids in a jet mill. Part 1: Determination of the selection function and related mechanical material properties. Part. Part. Syst. Charact. 22: 133–140.
- 51. de Vegt, O., Vromans, H., Faassen, F., and van der Voort Maarschalk, K. (2005). Milling of organic solids in a jet mill. Part 2: Checking the validity of the predicted rate of breakage function. Part. Part. Syst. Charact. 22: 261–267.
- 52. Vogel, L. and Peukert, W. (2003). Breakage behaviour of different materials: construction of a mastercurve for the breakage probability. Powder Technol. 129: 101–110.
- 53. Vogel, L. and Peukert, W. (2005). From single impact behaviour to modelling of impact mills. Chem. Eng. Sci. 60: 5164–5176.
- 54. Berthiaux, H. and Varinot, C. (1996). Approximate calculation of breakage parameters from batch grinding tests. Chem. Eng. Sci. 51: 4509–4516.
- 55. Starkey, D., Taylor, C., Morgan, N. et al. (2014). Modeling of continuous self‐classifying spiral jet mills. Part 1: Model structure and validation using mill experiments. AIChE J. 60: 4086–4095.
- 56. Starkey, D., Taylor, C., Siddabathuni, S. et al. (2014). Modeling of continuous self‐classifying spiral jet mills. Part 2: Powder‐dependent parameters from characterization experiments. AIChE J. 60: 4096–4103.
- 57. García‐Muñoz, S., Luciani, C.V., Vaidyaraman, S., and Seibert, K. (2015). Definition of design spaces using mechanistic models and geometric projections of probability maps. Org. Process. Res. Dev. 19 (8): 1012–1023.