47
THE ROLE OF SIMULATION AND SCHEDULING TOOLS IN THE DEVELOPMENT AND MANUFACTURING OF ACTIVE PHARMACEUTICAL INGREDIENTS
Demetri Petrides, Doug Carmichael, Charles Siletti, and Dimitris Vardalis
Intelligen, Inc., Scotch Plains, NJ, USA
Alexandros Koulouris
Alexander Technological Education Institute of Thessaloniki, Thessaloniki, Greece
Pericles Lagonikos
Merck & Co. Inc., Singapore, Singapore
47.1 INTRODUCTION
The global competition in the pharmaceutical industry and the increasing demands by governments and citizens for affordable medicines have driven the industry’s attention toward manufacturing efficiency. In this new era, improvements in process and product development approaches and streamlining of manufacturing operations can have a profound impact on the bottom line. It has been estimated that improvements in supply chain management alone could provide $65 billion in benefits to the pharmaceutical industry [1]. Computational tools such as process simulation and scheduling applications can play an important role in these endeavors. The role of such tools in the development and operation of processes for the manufacture of pharmaceutical products has been reviewed previously [2]. This chapter focuses on the role of these tools in the process development and manufacturing of active pharmaceutical ingredients (APIs) and specifically on small molecule APIs that are produced through organic synthesis. Information on the role of such tools in the development and manufacturing of biologics is also available in the literature [3].
Process simulation and scheduling tools serve a variety of purposes throughout the life cycle of product development and commercialization in the pharmaceutical industry [3–6]. During process development, process simulators are used to facilitate the following tasks:
- Represent the entire process on the computer.
- Perform material and energy balances.
- Estimate the size of equipment.
- Calculate demand for labor and utilities as a function of time.
- Estimate the cycle time of the process.
- Perform cost analysis.
- Assess the environmental impact.
The availability of a good computer‐based model improves the understanding of the entire process by the team members and facilitates communication. What‐if and sensitivity analyses are greatly facilitated by such tools. The objective of such studies is to evaluate the impact of critical parameters on various key performance indicators (KPIs), such as production cost, cycle times, and plant throughput. If there is uncertainty in some of the input parameters, sensitivity analysis can be supplemented with Monte Carlo simulation to quantify the impact of the uncertainty. Cost analysis, especially capital cost estimation, facilitates decisions related to in‐house manufacturing versus outsourcing. Estimation of the cost of goods identifies the expensive processing steps, and the information generated is used to guide R&D work in a judicious way.
When a process is ready to move from development to manufacturing, process simulation facilitates technology transfer and process fitting. A detailed computer model provides a thorough description of a process in a way that can be readily understood and adjusted by the recipients. Process adjustments are commonly required when a new process is moved into an existing facility whose equipment is not ideally sized for the new process. The simulation model is then used to adjust batch sizes, figure out cycling of certain steps (for equipment that cannot handle a batch in one cycle), estimate recipe cycle times, etc.
Production scheduling tools play an important role in manufacturing (large scale as well as clinical). They are used to generate production schedules on an ongoing basis in a way that does not violate constraints related to the limited availability of equipment, labor resources, utilities, inventories of materials, etc. Production scheduling tools close the gap between enterprise resource planning (ERP)/manufacturing resource planning (MRP) II tools and the plant floor [7, 8]. Production schedules generated by ERP and MRP II tools are typically based on coarse process representations and approximate plant capacities, and, as a result, solutions generated by these tools may not be feasible, especially for multiproduct facilities that operate at high capacity utilization. That often leads to late orders that require expediting and/or to large inventories in order to maintain customer responsiveness. “Lean manufacturing” principles, such as just‐in‐time (JIT) production, low work in progress (WIP), and low product inventories, cannot be implemented without good production scheduling tools that can accurately estimate capacity.
47.2 COMMERCIALLY AVAILABLE SIMULATION AND SCHEDULING TOOLS
Computer‐aided process design and simulation tools have been used in the chemical and petrochemical industries since the early 1960s. Simulators for these industries have been designed to model continuous processes and their transient behavior for process control purposes. Although there is ongoing research into continuous manufacturing of pharmaceuticals, there are substantial complications and challenges to implementing this type of process in the pharmaceutical industry, and therefore most APIs and pharmaceutical products are currently manufactured in batch or semicontinuous modes [9, 10]. Such processes are best modeled with batch process simulators that account for time dependency and sequencing of events. Batches from Batch Process Technologies, Inc. (West Lafayette, IN) was the first simulator specific to batch processing. It was commercialized in the mid‐1980s. All of its operation models are dynamic, and simulation always involves integration of differential equations over a period of time. In the mid‐1990s, Aspen Technology (Burlington, MA) introduced Batch Plus, a recipe‐driven simulator that targeted batch pharmaceutical processes. Around the same time, Intelligen, Inc. (Scotch Plains, NJ) introduced SuperPro Designer. The initial focus of SuperPro was on bioprocessing. Over the years, its scope has been expanded to include modeling of small molecule API and secondary pharmaceutical manufacturing processes.
Discrete‐event simulators have also found applications in the pharmaceutical industry, especially in the modeling of secondary pharmaceutical manufacturing processes. Established tools of this type include ProModel from ProModel Corporation (Orem, UT); Arena and Witness from Rockwell Automation, Inc. (Milwaukee, WI); and Extend from Imagine That, Inc. (San Jose, CA). The focus of models developed with such tools is usually on the minute‐by‐minute time dependency of events and the animation of the process. Material balances, equipment sizing, and cost analysis tasks are usually out of the scope of such models. Some of these tools are quite customizable, and third‐party companies occasionally use them as platforms to create industry‐specific modules.
Microsoft Excel is another common platform for creating models for pharmaceutical processes that focus on material balances, equipment sizing, and cost analysis. Some companies have even developed models in Excel that capture the time dependency of batch processes. This is typically done by writing extensive code (in the form of macros and subroutines) in Visual Basic for Applications (VBA) that comes with Excel. K‐TOPS from Biokinetics, which is now part of Amec Foster Wheeler (Philadelphia, PA), belongs to this category.
In terms of production scheduling, established tools include Optiflex from i2 Technologies, Inc. (Irving, TX); SAP APO from SAP AG (Walldorf, Germany); ILOG Plant PowerOps from ILOG SA (Gentilly, France); Aspen SCM (formerly Aspen MIMI) from Aspen Technology, Inc. (Burlington, MA); etc. Their success in the pharmaceutical industry, however, has been rather limited thus far. This is partly due to the complexity and time‐consuming nature of scheduling based on mathematical optimization, as well as the primary focus on discrete manufacturing (as opposed to batch chemical manufacturing) for many supply chain management tools. In contrast, SchedulePro from Intelligen, Inc. (Scotch Plains, NJ) is a finite capacity scheduling tool that focuses on scheduling of batch and semicontinuous pharmaceutical and related processes. It is a recipe‐driven tool with emphasis on generation of feasible solutions that can be readily improved by the user in an interactive manner.
47.3 MODELING AND ANALYSIS OF AN API MANUFACTURING PROCESS
The steps involved during the development of a model will be illustrated with a simple process that represents the manufacturing of an active compound for skin care applications.
The first step in building a simulation model is always the collection of information about the process. Engineers rely on draft versions of process descriptions, block flow diagrams, and batch sheets from past runs, which contain information on material inputs and operating conditions, among others. Reasonable assumptions are then made for missing data.
The steps of building a batch process model are generally the same for all batch process simulation tools. The best practice is to build the model step by step, gradually checking the functionality of its parts. The registration of materials (pure components and mixtures) is usually the first step. Next, the flow diagram (see Figure 47.1) is developed by putting together the required unit procedures and joining them with material flow streams. Operations are then added to unit procedures (see next paragraph for explanation), and their operating conditions and performance parameters are specified.
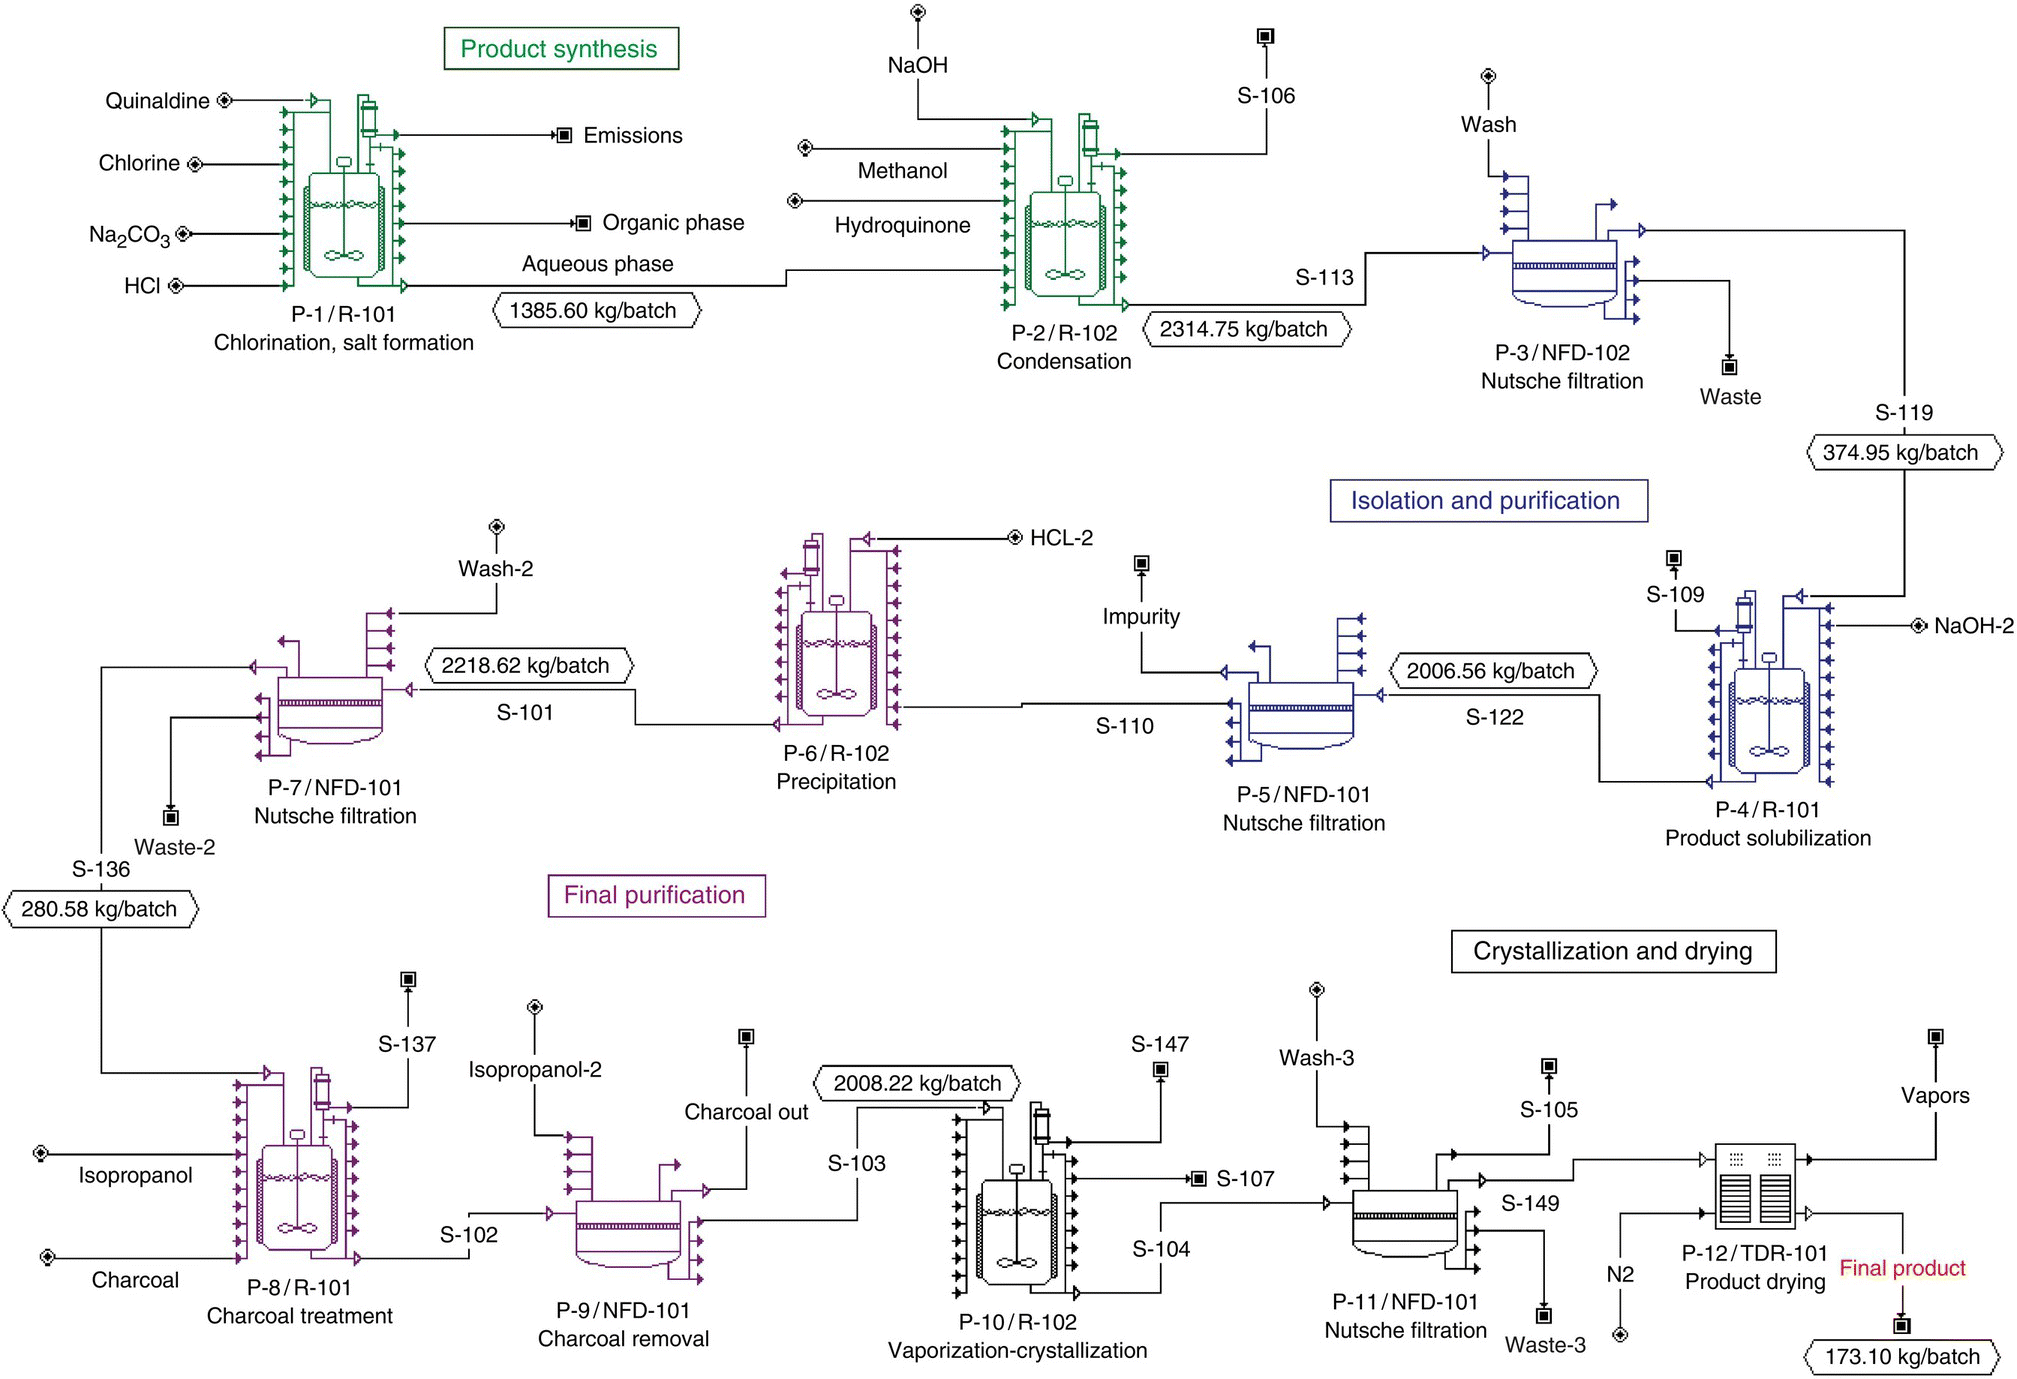
FIGURE 47.1 Flow diagram of the API process.
In SuperPro Designer, the representation of a batch process model is loosely based on the ISA S‐88 standards for batch recipe representation [11]. A batch process model is in essence a batch recipe that describes how to make a certain quantity of a specific product. The set of operations that comprise a processing step is called a “unit procedure” (as opposed to a unit operation, which is a term used for continuous processes). The individual tasks contained in a procedure are called “operations.” A unit procedure is represented on the screen with a single equipment‐looking icon. Figure 47.2 displays the dialog through which operations are added to a vessel unit procedure. On the left‐hand side of that dialog, the program displays the operations that are available in the context of a vessel procedure; on the right‐hand side, it displays the registered operations (Charge Quinaldine, Charge Chlorine, Charge Na2CO3, Agitate, etc.). The two‐level representation of operations in the context of unit procedures enables users to describe and model batch processes in detail.
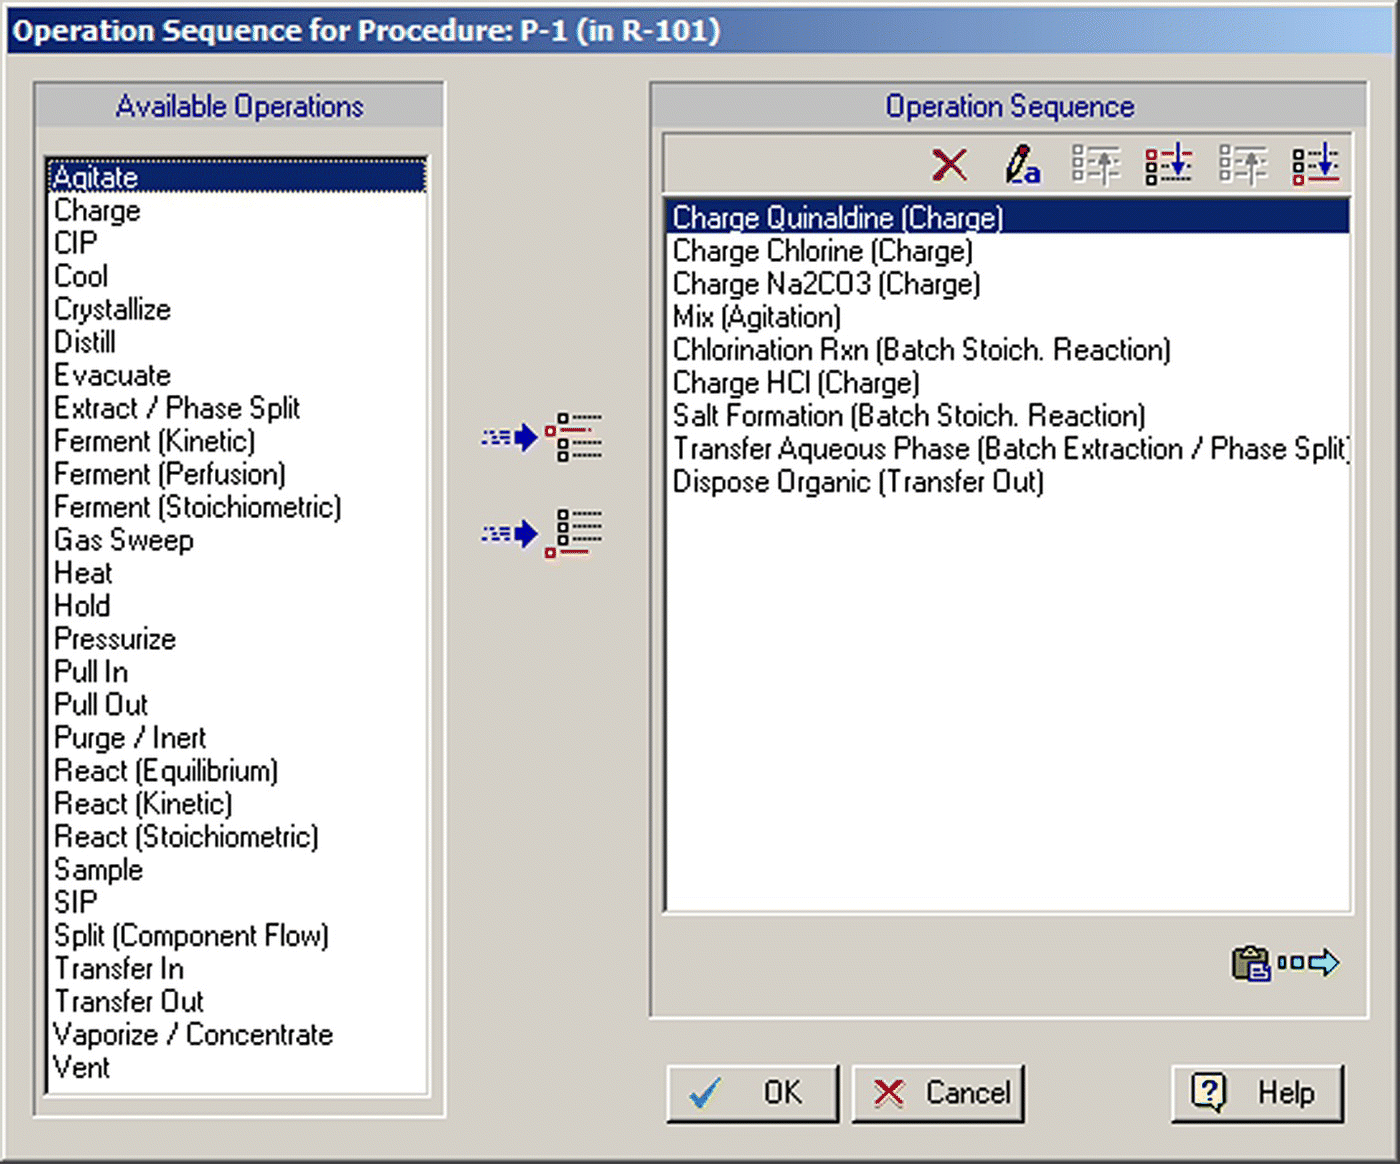
FIGURE 47.2 The operations associated with the first unit procedure of Figure 47.1.
For every operation within a unit procedure, the simulator includes a mathematical model that performs material and energy balance calculations. Based on the material balances, it performs equipment‐sizing calculations. If multiple operations within a unit procedure dictate different sizes for a certain piece of equipment, the software reconciles the different demands and selects an equipment size that is appropriate for all operations. The equipment is sized so that it is large enough and, hence, not overfilled during any operation, but it is not larger than necessary (in order to minimize capital costs). If the equipment size is specified by the user, the simulator checks to make sure that the vessel is not overfilled. In addition, the tool checks to ensure that the vessel contents do not fall below a user‐specified minimum volume (e.g. a minimum stirring volume) for applicable operations.
In addition to material balances, equipment sizing, and cycle time analysis, the simulator can be used to carry out cost‐of‐goods analysis and project economic evaluation. The Sections 47.3.1 through 47.6.1 that follow provide illustrative examples of the above.
Having developed a good model using a process simulator, the user may begin experimenting on the simulator with alternative process setups and operating conditions. This has the potential of reducing the costly and time‐consuming laboratory and pilot plant effort. Of course, the garbage‐in, garbage‐out (GIGO) principle applies to all computer models. If critical assumptions and input data are incorrect, so will be the outcome of the simulation.
When modeling an existing process, input data required by the model can be extracted from the data recorded by the actual process. A communication channel must, therefore, be established between the modeler and the operations department. The application of some data mining technique is usually required to transform the process data to the form required by the model. When designing a new plant, experience from similar projects can be used to fill in the information gaps. In all cases, a certain level of model verification is necessary after the model is developed. In its simplest form, a review of the results by an experienced engineer can play the role of verification. Running a sensitivity analysis on key input variables can reveal the parameters with the greatest impact on the model's most important outputs. These parameters would then constitute the focal points in the data acquisition effort in an attempt to estimate their values and uncertainty limits with the best possible accuracy.
47.3.1 Design Basis and Process Description
A simple batch process is used to illustrate the steps involved in building a model with SuperPro Designer. It is assumed that the process has been developed at the pilot plant and it is ready to be moved to large‐scale manufacturing. Based on input from the marketing department, the objective is to produce at least 27 000 kg of active ingredient per year at a cost of no more than $330/kg. A production suite can be dedicated to this process that includes two 3800 L reactors (R‐101 and R‐102), one 2.5 m2 Nutsche filter (NFD‐101), and a 10 m2 tray dryer (TDR‐101).
The entire flow sheet of the batch process is shown in Figure 47.1. It is divided into four sections: (i) product synthesis, (ii) isolation and purification, (iii) final purification, and (iv) crystallization and drying. A flowsheet section in SuperPro Designer is simply a group of unit procedures (processing steps). The unit procedures of each section are marked by distinct colors.
The formation of the final product in this example involves 12 unit procedures. The first reaction step (procedure P‐1) involves the chlorination of quinaldine. Quinaldine is dissolved in carbon tetrachloride (CCl4) and reacts with gaseous Cl2 to form chloroquinaldine.1 The conversion of the reaction is around 98% (based on amount of quinaldine fed). The generated HCl is then neutralized using Na2CO3. The stoichiometry of these reactions follows:
The small amounts of unreacted Cl2, generated CO2, and volatilized CCl4 are vented. The above three reactions occur sequentially in the first reactor vessel (R‐101). Next, HCl is added in order to produce chloroquinaldine‐HCl. The HCl first neutralizes the remaining NaHCO3 and then reacts with chloroquinaldine to form its salt, according to the following stoichiometries:
The small amounts of generated CO2 and volatilized CCl4 are vented. The presence of water (added with HCl as hydrochloric acid solution) and CCl4 leads to the formation of two liquid phases. Then the small amounts of unreacted quinaldine and chloroquinaldine are removed with the organic phase. The chloroquinaldine‐HCl remains in the aqueous phase. This sequence of operations (including all charges and transfers) requires about 14.5 hours.
After removal of the unreacted quinaldine, the condensation of chloroquinaldine and hydroquinone takes place in reactor R‐102 (procedure P‐2). First, the salt chloroquinaldine‐HCl is converted back to chloroquinaldine using NaOH. Then, hydroquinone reacts with NaOH and yields hydroquinone‐Na. Finally, chloroquinaldine and hydroquinone‐Na react and yield the desired intermediate product. Along with product formation, roughly 2% of chloroquinaldine dimerizes and forms an undesirable by‐product impurity. This series of reactions and transfers takes roughly 13.3 hours. The stoichiometry of these reactions follows:
Both the product and impurity molecules formed during the condensation reaction precipitate out of solution and are recovered using a Nutsche filter (procedure P‐3, filter NFD‐101). The product recovery yield is 90%. The filtration, wash, and cake transfer time is 6.4 hours.
Next, the product/impurity cake recovered by filtration is added into a NaOH solution in reactor R‐101 (procedure P‐4). The product molecules react with NaOH to form product‐Na, which is soluble in water. The impurity molecules remain in the solid phase and are subsequently removed during procedure P‐5 in filter NFD‐101. The product remains dissolved in the liquors. Procedure P‐4 takes about 10 hours, and procedure P‐5 takes approximately 4 hours.
Notice that the single filter (NFD‐101) is used by several different procedures. The two reactors are also used for multiple procedures during each batch. Please note that the equipment icons in Figure 47.1 represent unit procedures (processing steps), as opposed to unique pieces of equipment. The procedure names (P‐1, P‐3, etc.) below the icons refer to the unit procedures, whereas the equipment tag names (R‐101, R‐102, etc.) refer to the actual physical pieces of equipment. The process flow diagram in SuperPro Designer is essentially a graphical representation of the batch “recipe” that displays the execution sequence of the various steps.
After the filtration in procedure P‐5, the excess NaOH is neutralized using HCl, and the product‐Na salt is converted back to product in reactor R‐102 (procedure P‐6). Since the product is insoluble in water, it precipitates out of solution. The product is then recovered using another filtration step in procedure P‐7. The product recovery yield is 90%. The precipitation procedure takes roughly 10.7 hours, and the filtration takes about 5.7 hours. The recovered product cake is then dissolved in isopropanol and treated with charcoal to remove coloration. This takes place in reactor R‐101 under procedure P‐8. After charcoal treatment, the solid carbon particles are removed using another filtration step in procedure P‐9. The times required for charcoal treatment and filtration are 15.9 and 5 hours, respectively.
In the next step (procedure P‐10), the solvent is distilled off until the solution is half its original volume. The product is then crystallized in the same vessel with a yield of 97%. The crystalline product is recovered with a 90% yield using a final filtration step (procedure P‐11). The distillation and crystallization steps take approximately 18.3 hours, and the filtration requires roughly 3.3 hours. The recovered product crystals are then dried in a tray dryer (procedure P‐12, TDR‐101). This takes an additional 15.6 hours. The amount of purified product generated per batch is 173.1 kg.
Table 47.1 displays the raw material requirements in kg per batch and per kg of main product (MP = purified product) that correspond to the maximum batch size achievable with the available equipment. Note that around 54.3 kg of raw materials (solvents, reagents, etc.) is used per kg of main product produced. Thus the product to raw material ratio is only 1.84%, an indication that large amounts of waste are generated by this process. A more detailed description of this process along with information on how the pilot plant process is transferred to the large‐scale manufacturing facility is available in the literature [12].
TABLE 47.1 Raw Material Requirements
| Material | kg/Batch | kg/kg MP |
| Carbon tetrachloride | 497.31 | 2.87 |
| Quinaldine | 148.63 | 0.86 |
| Water | 3621.44 | 20.92 |
| Chlorine | 89.52 | 0.52 |
| Na2CO3 | 105.06 | 0.61 |
| HCl (20% w/w) | 357.44 | 2.07 |
| NaOH (50% w/w) | 204.52 | 1.18 |
| Methanol | 553.26 | 3.20 |
| Hydroquinone | 171.45 | 0.99 |
| Sodium hydroxide | 74.16 | 0.43 |
| HCl (37% w/w) | 217.57 | 1.26 |
| Isopropanol | 2232.14 | 12.90 |
| Charcoal | 15.85 | 0.09 |
| Nitrogen | 1111.49 | 6.42 |
| Total | 9399.84 | 54.30 |
47.3.2 Process Scheduling and Cycle Time Reduction
Figure 47.3 displays the equipment occupancy chart for three consecutive batches (each color represents a different batch). The process batch time is approximately 92 hours. This is the total time between the start of the first step of a batch and the end of the last step of that batch. However, since most of the equipment items are utilized for shorter periods within a batch, a new batch can be initiated every 62 hours, which is known as the minimum cycle time of the process. Multiple bars on the same line (e.g. for R‐101, R‐102, and NFD‐101) represent reuse (sharing) of equipment by multiple procedures. If the cycle times of procedures that share the same equipment overlap, scheduling with the assumed equipment designation is infeasible. White space between bars represents idle time. The equipment with the least idle time between consecutive batches is the time (or scheduling) bottleneck (R‐102 in this case) that determines the maximum number of batches per year. Its occupancy time (~62 hours) is the minimum possible time between consecutive batches.
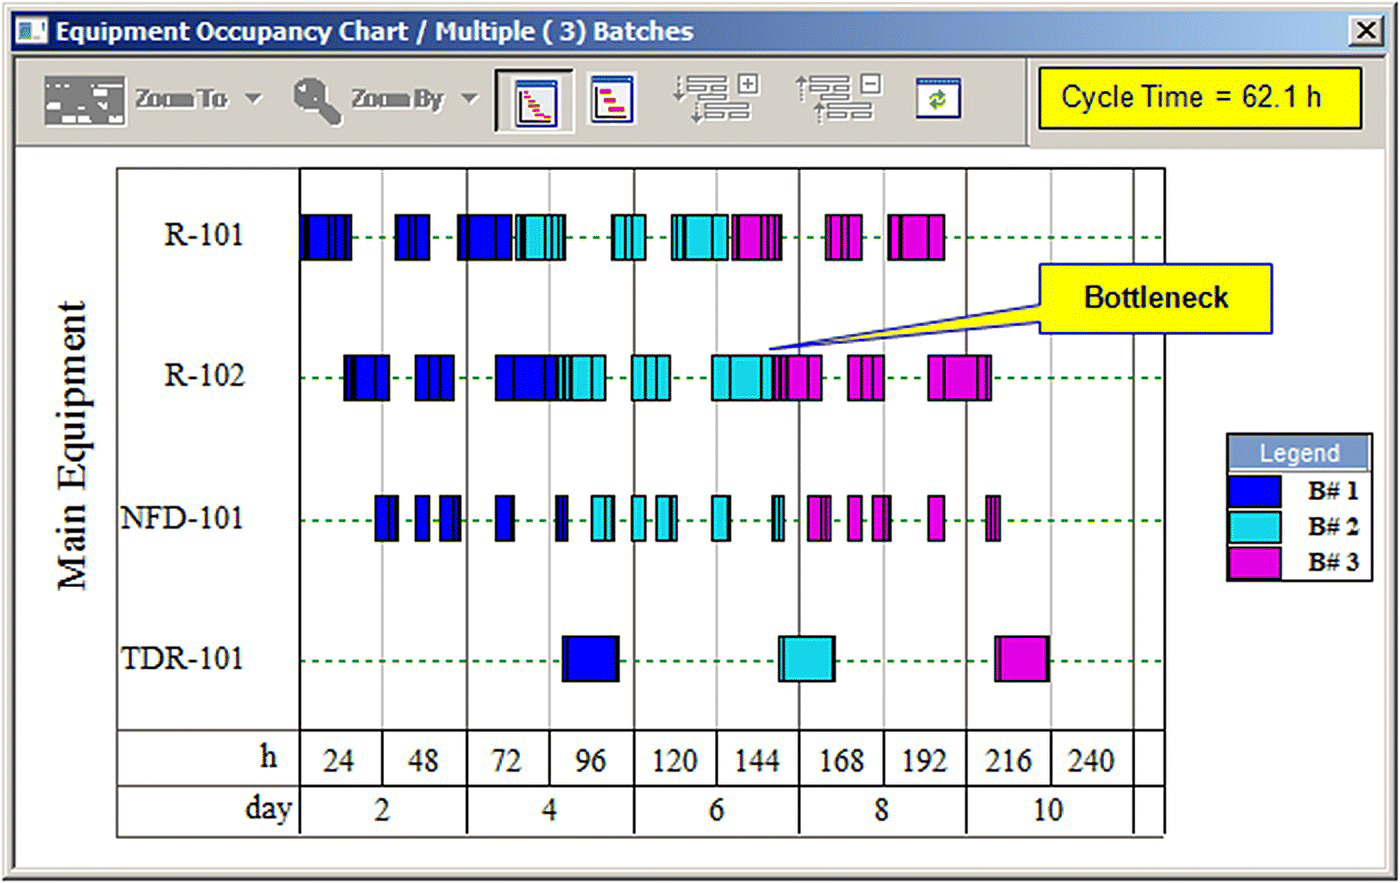
FIGURE 47.3 Equipment occupancy chart for three consecutive batches.
Scheduling in the context of a simulator is fully process driven, and the impact of process changes can be analyzed in a matter of seconds. For instance, the impact of an increase in batch size (that affects the duration of charge, transfer, filtration, distillation, and other scale‐dependent operations) on the plant batch time and the maximum number of batches can be seen instantly. Due to the many interacting factors involved with even a relatively simple process, simulation tools that allow users to describe their processes in detail and to quickly perform what‐if analyses can be extremely useful.
If this production line operated around the clock for 330 days a year (7920 hours) with its minimum cycle time of 62 hours, its maximum annual number of batches would be 126, leading to an annual production of 21 810 kg of API (126 batches × 173.1 kg/batch), which is less than the project's objective of 27 000 kg. And since the process operates at its maximum possible batch size, the only way to increase production is by reducing the process cycle time and thus increasing the number of batches per year. The cycle time can be reduced through process changes or by addition of extra equipment. However, major process changes in GMP manufacturing usually require regulatory approval and are avoided in practice. Addition of extra equipment is the practical way for cycle time reduction. Since R‐102 is the current bottleneck, addition of an extra reactor can shift the bottleneck to another unit. Figure 47.4 displays the effect of the addition of an extra reactor (R‐103). Please note that under the new conditions each reactor handles two procedures instead of three.
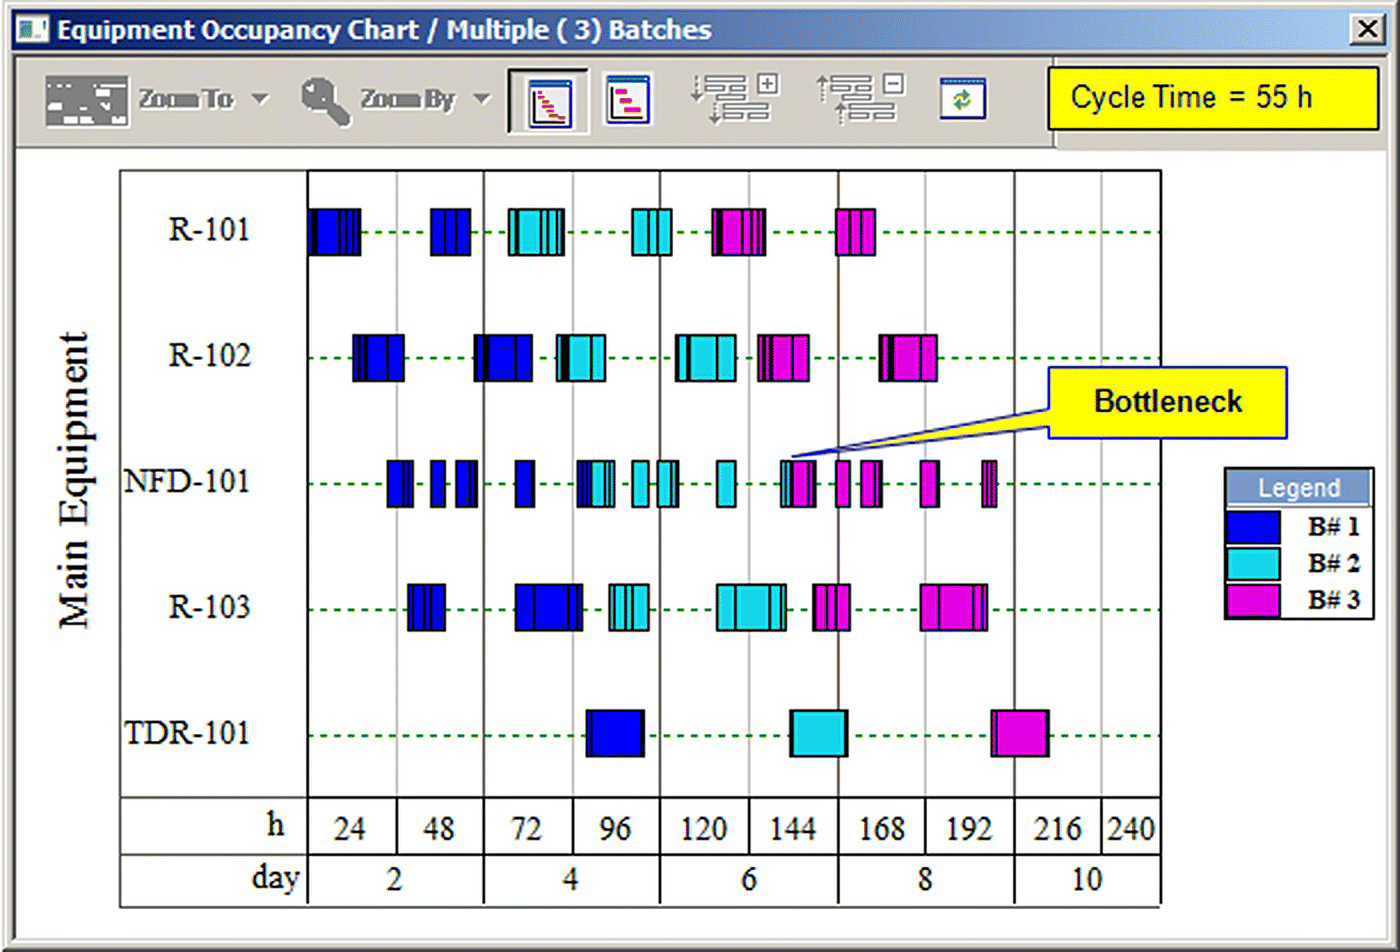
FIGURE 47.4 Equipment occupancy chart for the case with three reactors.
The addition of R‐103 reduces the cycle time of the process to 55 hours, resulting in 143 batches per year and annual throughput of 24 753 kg. Under these conditions the bottleneck shifts to NFD‐101. Since the annual throughput is still below the desired amount of 27 000 kg/year, addition of an extra Nutsche filter to eliminate the current bottleneck is the next logical step. Figure 47.5 shows the results of that scenario. In this scenario, the first Nutsche filter (NFD‐101) is used for the first three filtration procedures (P‐3, P‐5, and P‐7), and the second filter (NFD‐102) handles the last two filtration procedures (P‐9 and P‐11). Under these conditions the process cycle time goes down to 48.6 hours, resulting in 162 batches per year and annual throughput of 28 042 kg, which meets the production objective of the project. The red arrows of Figure 47.5 represent the flow of material through the equipment for the first batch.
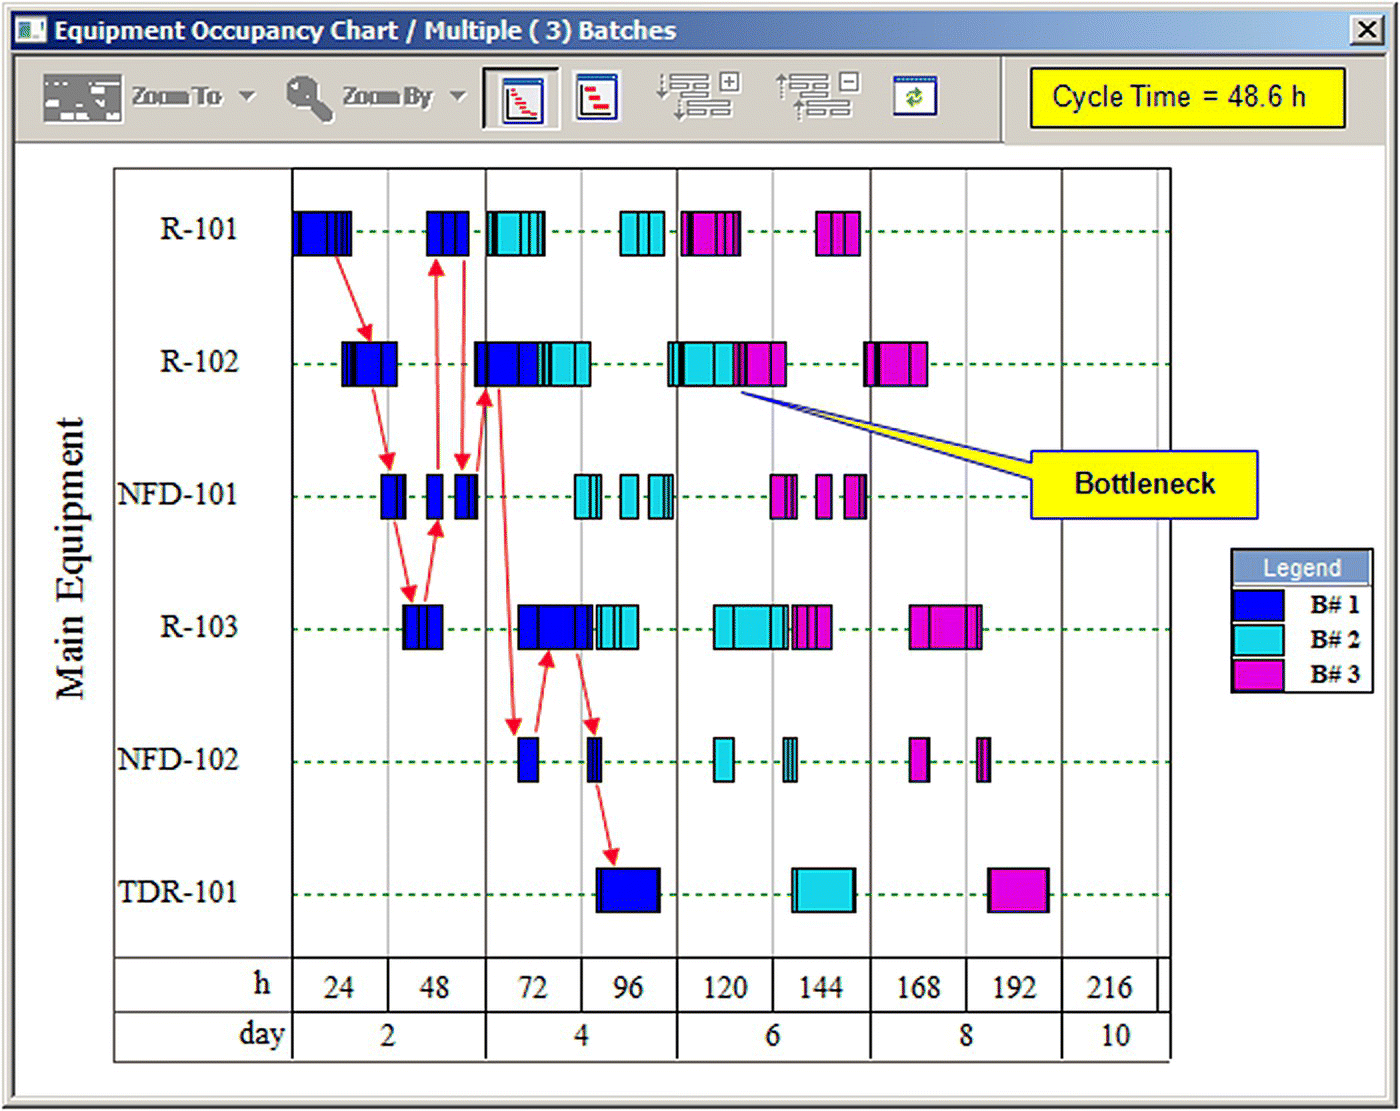
FIGURE 47.5 Equipment occupancy chart for the case with three reactors and two filters.
Debottlenecking projects that involve installation of additional equipment provide an opportunity for batch size increases that can lead to substantial throughput increase. More specifically, if the size of the new reactor (R‐103) is selected to accommodate the needs of the most demanding vessel procedure (based on volumetric utilization) in a way that shifts the batch size bottleneck to another procedure, then, that creates an opportunity for batch size increase. Additional information on debottlenecking and throughput increase options can be found in the literature [13, 14].
47.3.3 Cost Analysis
Cost analysis and project economic evaluation is important for a number of reasons. If a company lacks a suitable manufacturing facility with available capacity to accommodate a new product, it must decide whether to build a new plant or outsource the production. Building a new plant is a major capital expenditure and a lengthy process. To make a decision, management must have information on capital investment required and time to complete the facility. To outsource the production, one must still do a cost analysis and use it as a basis for negotiation with contract manufacturers. A sufficiently detailed computer model can be used as the basis for the discussion and negotiation of the terms. Contract manufacturers usually base their estimates on requirements of equipment utilization and labor per batch, which is information that is provided by a good model. SuperPro Designer performs thorough cost analysis and project economic evaluation calculations and estimates capital as well as operating costs. The cost of equipment is estimated using built‐in cost correlations that are based on data derived from a number of vendors and literature sources. The fixed capital investment is estimated based on total equipment cost using various multipliers, some of which are equipment specific (e.g. installation cost), while others are plant specific (e.g. cost of piping, buildings, etc.). The approach is described in detail in the literature [12, 15]. The rest of this section provides a summary of the cost analysis results for this example process.
Table 47.2 shows the key economic evaluation results for this project. Key assumptions for the economic evaluations include (i) a new plant will be built and dedicated to the manufacturing of this product, (ii) the entire direct fixed capital is depreciated linearly over a period of 12 years, (iii) the project lifetime is 15 years, and (iv) 27 000 kg of final product will be produced per year.
TABLE 47.2 Key Economic Evaluation Results
| Total capital investment | $19.5 million |
| Plant throughput | 27 000 kg/year |
| Manufacturing cost | $8.6 million/year |
| Unit production cost | $318/kg |
| Selling price | $450/kg |
| Revenues | $12.2 million/year |
| Gross margin | 29.3% |
| Taxes (40%) | $1.1 million/year |
| IRR (after taxes) | 14.0% |
| NPV (for 7% discount interest) | $8.5 million |
For a plant of this capacity, the total capital investment is around $19.5 million. The unit production cost is $318/kg of product, which satisfies the project's objective for a unit cost of under $330/kg. Assuming a selling price of $450/kg, the project yields an after‐tax internal rate of return (IRR) of 14% and a net present value (NPV) of $8.5 million (assuming a discount interest of 7%).
Figure 47.6 breaks down the manufacturing cost. The facility‐dependent cost, which primarily accounts for the depreciation and maintenance of the plant, is the most important item accounting for 35.74% of the overall cost. This is common for high‐value products that are produced in small facilities. This cost can be reduced by manufacturing the product at a facility whose equipment has already been depreciated. Raw materials are the second most important cost item accounting for 32.12% of the total manufacturing cost. Furthermore, if we look more closely at the raw material cost breakdown, it becomes evident that quinaldine, hydroquinone, and isopropanol make up more than 80% of this cost (see Table 47.3). If a lower‐priced quinaldine vendor could be found, the overall manufacturing cost would be reduced significantly.
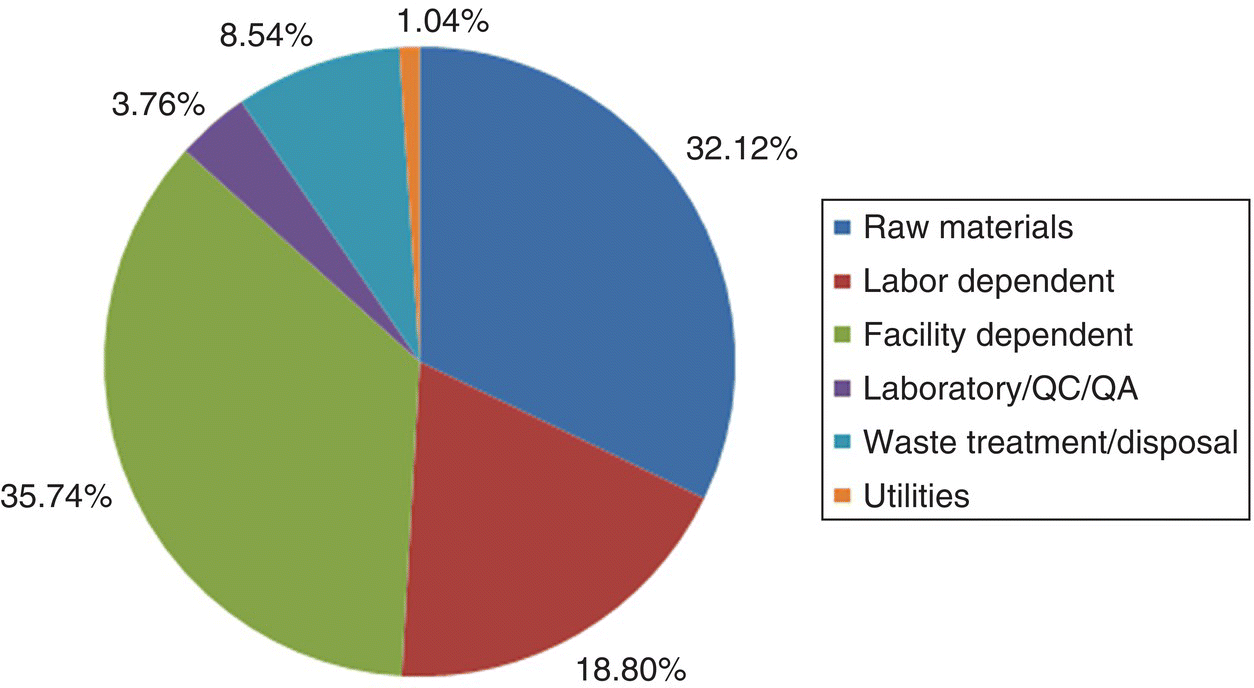
FIGURE 47.6 Manufacturing cost breakdown.
TABLE 47.3 Raw Material Requirements and Costs
| Bulk Material | Unit Cost ($/kg) | Annual Amount (kg) | Annual Cost ($) | % |
| Carbon tetrachloride | 0.80 | 77 581 | 62 065 | 2.25 |
| Quinaldine | 60.00 | 23 187 | 1 391 215 | 50.40 |
| Water | 0.10 | 564 944 | 56 494 | 2.05 |
| Chlorine | 3.30 | 13 965 | 46 083 | 1.67 |
| Na2CO3 | 6.50 | 16 389 | 106 528 | 3.86 |
| NaOH (50% w/w) | 0.15 | 31 905 | 4 786 | 0.17 |
| Methanol | 0.24 | 86 308 | 20 714 | 0.75 |
| Hydroquinone | 18.00 | 26 746 | 481 427 | 17.44 |
| Sodium hydroxide | 2.00 | 11 569 | 23 138 | 0.84 |
| HCl (37% w/w) | 0.17 | 33 942 | 5 770 | 0.21 |
| Isopropanol | 1.10 | 348 214 | 383 035 | 13.88 |
| Charcoal | 2.20 | 2 473 | 5 440 | 0.20 |
| Nitrogen | 1.00 | 173 393 | 173 393 | 6.28 |
| Total | 1 466 376 | 2 760 088 | 100.00 |
Labor is the third important cost item accounting for 18.8% of the overall cost. The program estimates that 12 operators are required to run the plant around the clock supported by 3 QC/QA scientists. This cost can be reduced by increasing automation or by locating the facility in a region of low labor cost.
47.4 UNCERTAINTY AND VARIABILITY ANALYSIS
Process simulation tools typically used for batch process design, debottlenecking, and cost estimation employ deterministic models. They model the “average” or “expected” situation commonly referred to as the base case or most likely scenario. Modeling a variety of cases can help determine the range of performance with respect to key process parameters. However, such an approach does not account for the relative likelihood of the various cases. Monte Carlo simulation is a practical means of quantifying the risk associated with uncertainty in process parameters [16]. In a Monte Carlo simulation, uncertain input variables are represented with probability distributions. A simulation calculates numerous scenarios of a model by repeatedly picking values from a user‐defined probability distribution for the uncertain variables. It then uses those values in the model to calculate and analyze the outputs in a statistical way in order to quantify risk. The outcome of this analysis is the estimation of the confidence by which desired values of KPIs can be achieved. Inversely, the analysis can help identify the input parameters with the greatest effect on the bottom line and the input value ranges that minimize output uncertainty.
In batch pharmaceutical processing uncertainty can emerge in operation‐ or market‐related parameters. Process times, equipment sizes, material purchasing, and product selling prices are common uncertain variables. Performing a stochastic analysis early on in the design phase increases the model's robustness and minimizes the risk of encountering unpleasant surprises later on.
For models developed in SuperPro Designer, Monte Carlo simulation can be performed by combining SuperPro Designer with Crystal Ball from Oracle Corporation (Redwood Shores, CA). Crystal Ball is an Excel add‐in application that facilitates Monte Carlo simulation. It enables the user to designate the uncertain input variables, specify their probability distributions, and select the output (decision) variables whose values are recorded and analyzed during the simulation. For each simulation trial (scenario), Crystal Ball generates random values for the uncertain input variables selected in frequency dictated by their probability distributions using the Monte Carlo method. Crystal Ball also calculates the uncertainty involved in the outputs in terms of their statistical properties, mean, median, mode, variance, standard deviation, and frequency distribution.
Scenario 3, analyzed in Section 47.3.3, meets the production and cost objectives of the project (27 000 kg/year of API for <$330/kg) based on the assumed operating parameters and material unit costs. If the variability related to process parameters and uncertainty related to cost parameters can be represented with probability distributions, then, Monte Carlo simulation can estimate the certainty with which the project objectives can be met. For this exercise, a normal distribution was assumed for the price of quinaldine, which is the most expensive raw material, with a mean value equal to that of the base case ($60/kg).
The annual throughput (or number of batches per year) is determined by the process cycle time. Since procedure P‐8 that utilizes vessel R‐102 is the time bottleneck, any variability in the completion of P‐8 leads to uncertainty in the annual throughput. Variability in the completion of P‐8 can be caused by variability in the operations of P‐8 as well as by variability in the operations of procedures upstream of P‐8. Common sources of process time variability in chemical manufacturing include:
- Fouling of heat transfer areas that affect duration of heating and reaction operations.
- Fouling of filters that affect duration of filtration operations.
- Presence of impurities in raw materials that affect reaction rates.
- Off‐spec materials that require rework.
- Random power outages and equipment or utility failures.
- Differences in skills of operators that affect setup and operation of equipment.
- Availability of operators.
Triangular probability distributions were assumed for the duration of the two main reaction operations and the filtration steps that precede P‐8 (Table 47.4). Even though variability distributions were assigned to specific operations, it may be deemed more accurate to assume that they account for the composite variability of their procedures. If this type of analysis is done for an existing facility, historical data should be used to derive the probability distributions. Crystal Ball has the capability to fit experimental data.
TABLE 47.4 The Input Parameters Used for the Monte Carlo Simulation and Their Variation
| Variable | Base Case Value | Distribution | Variation and Range |
| Quinaldine cost | 60 ($/kg) | Normal | SD = 10 [30–90] |
| Chlorination reaction time (in P‐1) | 6 h | Triangular | [4–8] |
| Condensation reaction time (in P‐2) | 6 h | Triangular | [4–8] |
| Cloth filtration flux in P‐3, P‐5, P‐7, and P‐9 | 200 (L/m2·h) | Triangular | [150–250] |
The two decision variables considered in this study are the number of batches that can be processed per year and the unit production cost. These are KPIs important for production planning and project economics. The output variables, of the combined SuperPro Designer–Crystal Ball simulation, are quantified in terms of their mean, median, mode, variance, and standard deviation. These results are shown in Figures 47.7 and 47.8 for the “unit production cost” and the “number of batches,” respectively. Based on the assumptions for the variation of the input variables, we note that average values (mean/median/mode) calculated for the decision variables satisfy the objective. The certainty analysis reveals that we can meet the unit production cost goal (unit cost of under $330/kg) with a certainty of 89.6% (Figure 47.7). The certainty of meeting the production volume goal (of 27 000 kg or 156 batches) is only 82.4% (Figure 47.8). Such findings constitute a quantification of the risk associated with a process and can assist the management of a company in making decisions on whether to proceed or not with a project idea.
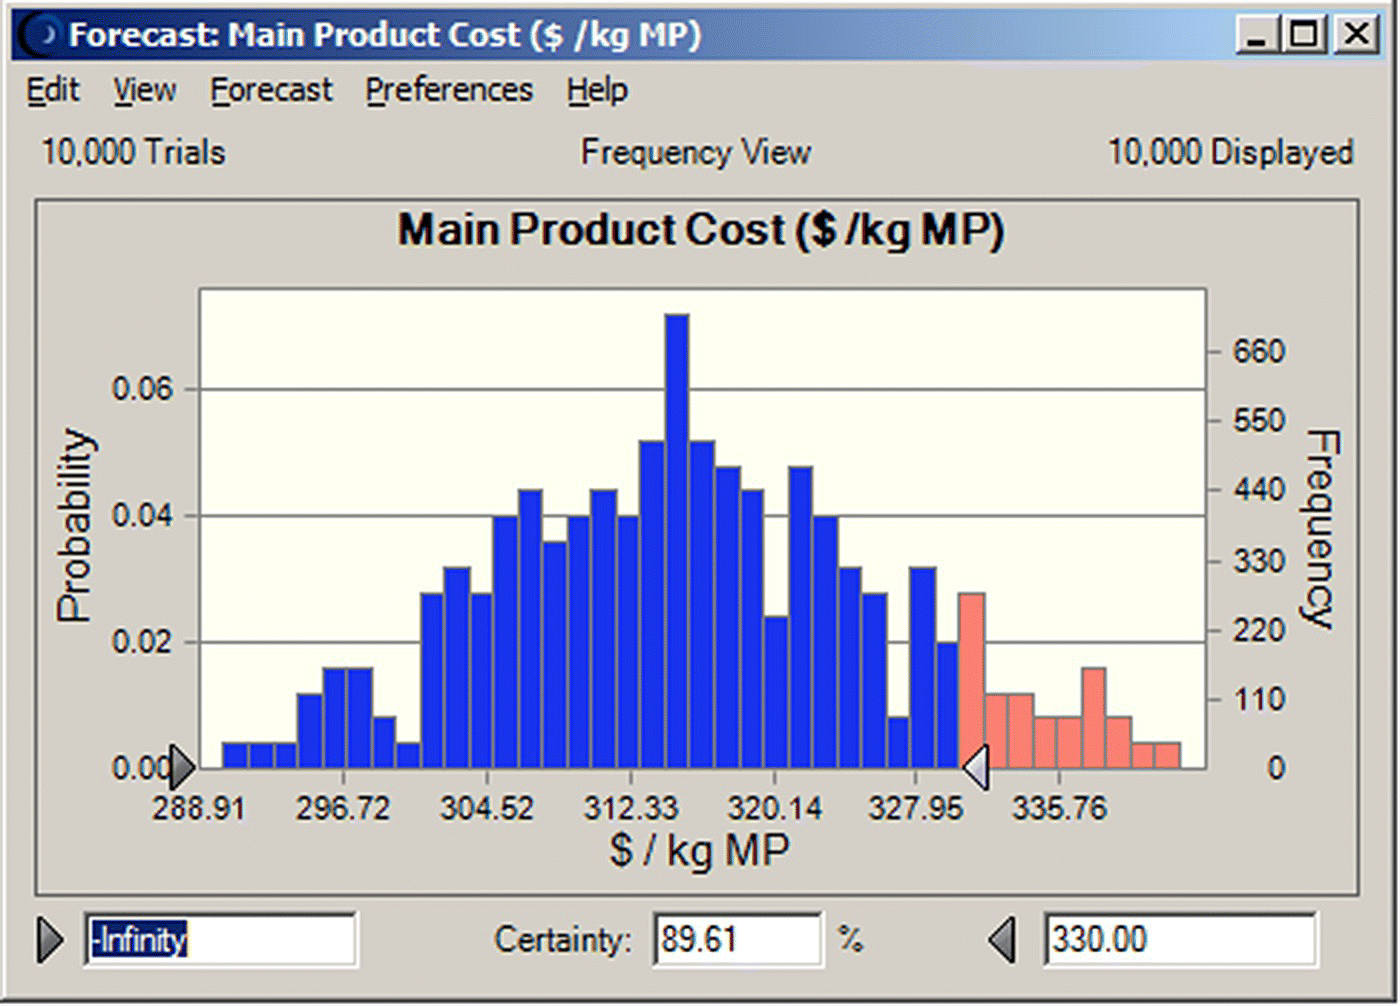
FIGURE 47.7 Probability distribution of the unit production cost (10 000 trials) (mean = 315.52, median = 315.03, SD = 10.49, range = 290.19–342.25).
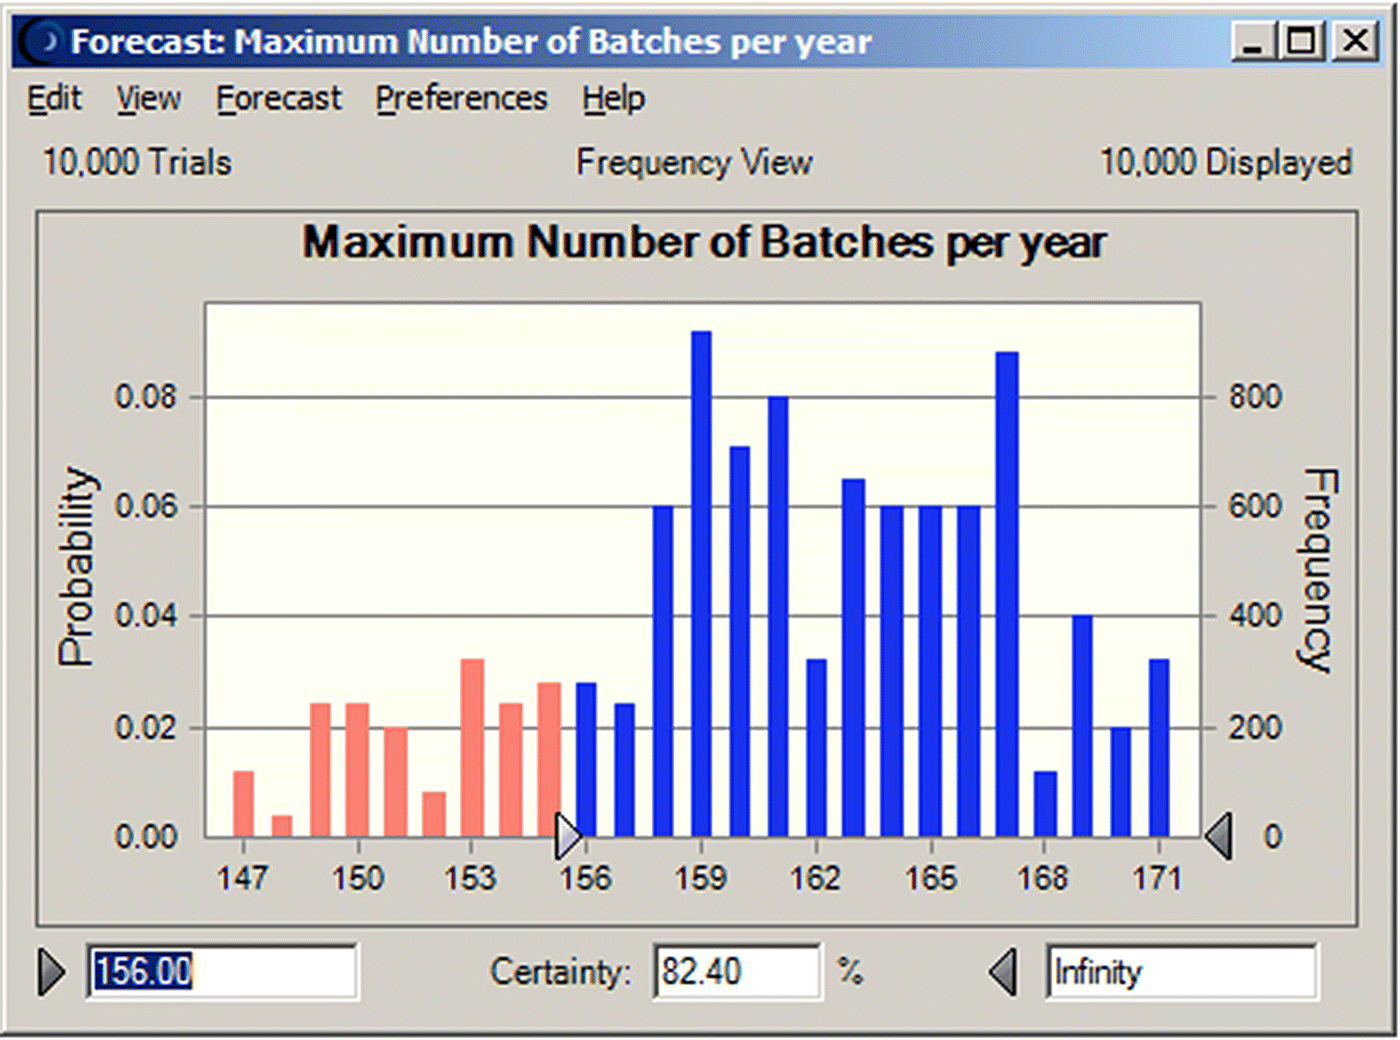
FIGURE 47.8 Probability distribution of the annual number of batches (10 000 trials) (mean = 161.0, median = 161, mode = 159, SD = 5.72, range = 147–171).
The dynamic sensitivity charts provide useful insight for understanding the variation of the process. They illustrate the impact of the input parameters on the variance (with respect to the base case) of the final process output, when these parameters are perturbed simultaneously. This allows us to identify which process parameters have the greatest contribution to the variance of the process and thus focus on them for process improvement. The sensitivity analysis for the maximum number of batches per year is displayed in Figure 47.9. The flux of the filtration operations has the greatest impact on the number of batches and consequently the annual throughput. If the management of the company is seriously committed to the annual production target, it would be wise to allocate R&D resources to the optimization of the filtration operations.
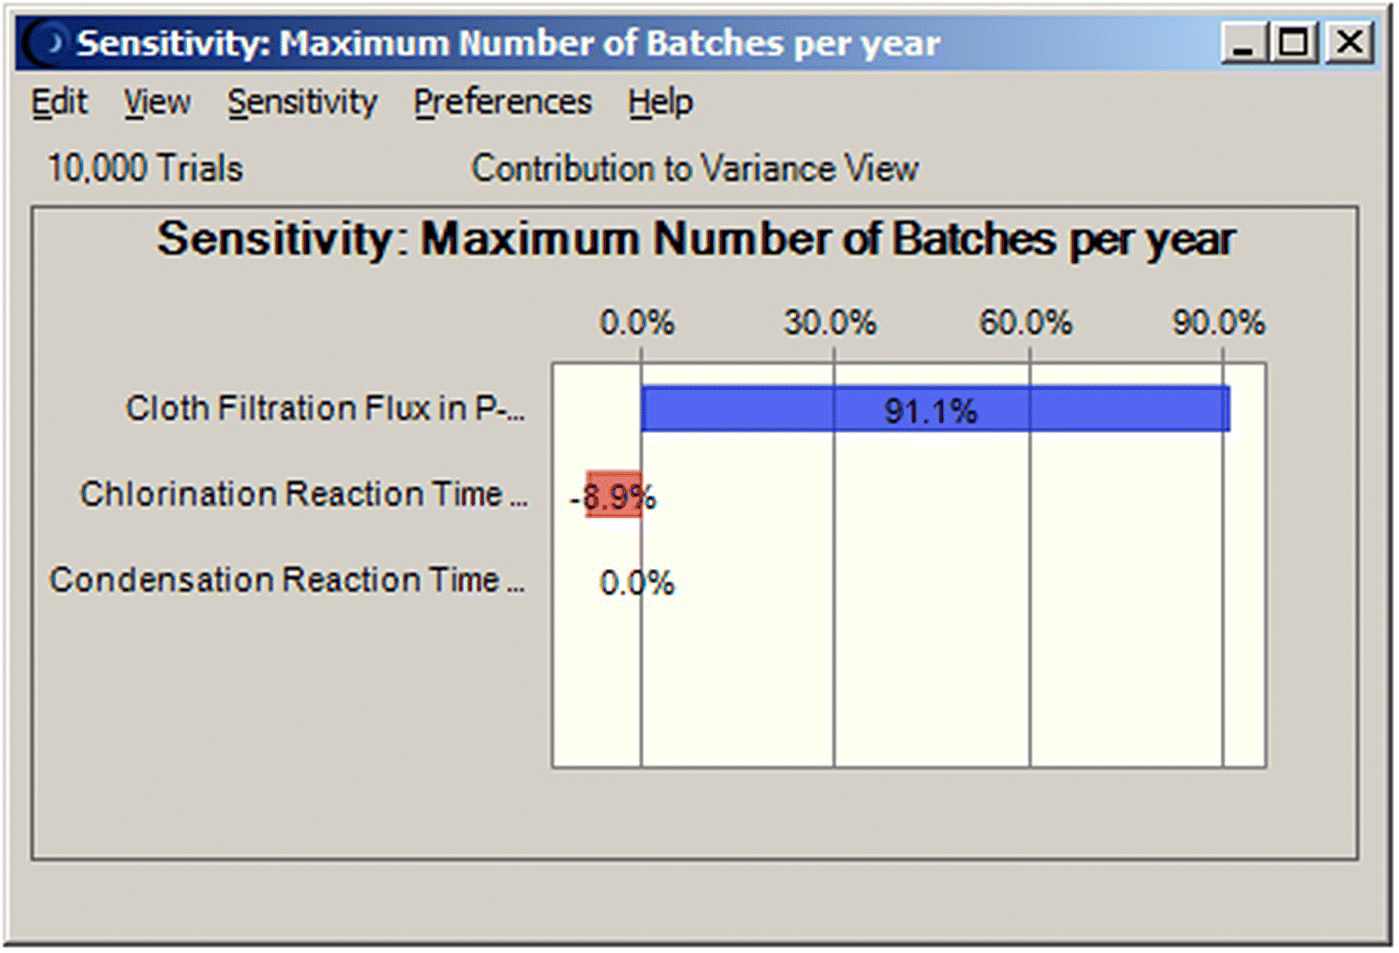
FIGURE 47.9 Contribution of uncertain parameters to the variance of the annual number of batches.
47.5 PRODUCTION SCHEDULING
After the process is developed and transferred to a manufacturing facility for clinical or commercial production, it becomes the job of the scheduler to ensure that all the activities are correctly sequenced and that the necessary labor, materials, and equipment are available when needed. The short‐term schedule includes the upcoming production campaigns and may span from a week to several months. The general workflow begins with the long‐term plan, which describes how much of each product should be made over the planning period. The long‐term plan, which is described in Section 47.6, does not include details about process activities. The scheduler uses the plan and knowledge about the process and available equipment and resources to generate a detailed production plan, i.e. the short‐term schedule, and communicate it to the appropriate staff. As the schedule is executed, there may be deviations between the schedule and the actual process execution. For example, tests may need to be redone, operations may take longer than assumed, or equipment may fail. The scheduler must recalculate the production schedule to reflect changes in resource availability and then notify the appropriate staff.
In addition to planning‐and‐scheduling tools, pharmaceutical companies use a variety of other plant systems to enable efficient and reliable manufacturing. ERP/MRP systems keep track of the quantity of resources, such as materials or labor. Manufacturing execution systems (MES) ensure that the process proceeds according to precise specifications. Process control systems interface with the equipment and sensors to carry out steps and to maintain the process parameters according to specification [17]. Short‐term scheduling is often managed manually or with stand‐alone systems, but it could potentially interface with ERP/MRP and even MES programs.
The following examples utilize SchedulePro as a scheduling tool. SchedulePro does not model the detailed material and energy balances of a process; it is mainly concerned with the time and resources that tasks consume. If a user is interested in detailed process modeling as well as scheduling, he/she can generate the process model in SuperPro Designer, perform the material and energy balances there, and then export the model as a recipe to SchedulePro for a thorough capacity planning or scheduling analysis in the context of a multiproduct facility. Relative to SuperPro, SchedulePro provides a variety of scheduling enhancements:
- The rigidity of recipe execution is relaxed with the introduction of “flexible shifts,” which may delay the start of an operation, and “interruptibility,” which may break the execution of an operation (if the resources it requires are not available).
- For every procedure, an equipment pool can be defined to represent the list of alternative equipment units that could potentially host that procedure.
- Auxiliary equipment (including pools of equipment) can be assigned to operations.
- Materials supplied or generated through operations can be linked to supply, intermediate, or receiving storage units.
The inclusion of this additional information in the production model is motivated mainly by the needs of the pharmaceutical/biotech industry where the manufacturing bottlenecks are often related to the use of auxiliary equipment (e.g. CIP skids, transfer panels) or to support activities (e.g. cleaning, buffer preparation), which tend to have flexible execution.
With the product recipes, facilities, and resources defined, simulation of a production plan in SchedulePro can proceed through the definition and scheduling of campaigns. A campaign is defined as a series of batches of a given recipe, leading to the production of a given quantity of product. A series of campaigns organized in a prioritized list constitute the production plan. As a finite capacity tool, SchedulePro attempts to schedule production of campaigns while respecting capacity constraints stemming from resource unavailability (e.g. facility or equipment outages) or availability limitations (e.g. equipment can only be used by one procedure at a time). Conflicts (i.e. violations of constraints) can be resolved by utilizing alternative resources declared as candidates within equipment pools, introducing delays or breaks if this flexibility has been declared in the corresponding operations, or moving the start of a campaign or batch to a time where the required resources are available. The automatically generated schedule can subsequently be modified by the user through local or global interventions in every scheduling decision. Through a mix of automated and manual scheduling, users can formulate a production plan that is feasible and satisfies their production objectives.
47.6 CAPACITY ANALYSIS AND PRODUCTION PLANNING
The short‐term scheduler usually starts with a rough long‐term production plan that is based on product demand, estimated plant capacity, and/or inventory constraints. Since these long‐term plans generally do not require all the resource and timing details associated with short‐term scheduling, production planners can create their long‐term plans in systems with less scheduling functionality, such as an ERP tool. Alternatively, a scheduling tool with simple recipes can be an effective planning system. Regardless of the specific planning system used, an automated link between planning and scheduling can streamline both the planning process and the scheduling process. For example, the scheduler may download campaign information with estimated dates from the planning system. As the schedule progresses, the scheduler uploads revised date and production information to the planning system. This type of integration saves time and reduces the potential for human error during the planning‐and‐scheduling cycle.
In order to generate the initial production plan, it is important to consider the approximate plant capacity. Capacity is a measure of how much product a manufacturing system can make. The amount of product manufactured in a given time period (hour, day, week, etc.) or the time required to produce a given quantity of product are the most intuitive and commonly used measures of capacity. The capacity of a manufacturing system should, on average, exceed demand. However, excess capacity is costly and undesirable [19]. Increasing capacity to meet demand might require capital investments in equipment and buildings or an extension of the manufacturing uptime (through labor overtime or additional shifts). Effective capacity is the actual capacity achieved in practice. The effective capacity is usually less than the nominal plant capacity due to equipment maintenance, unexpected breakdowns, scheduling inefficiencies, labor unavailability, and other factors.
The need for an estimate of the plant capacity arises in different supply chain management activities, including aggregate planning (i.e. generating feasible long‐range or medium‐range production plans that can satisfy expected lumped demand for a range of aggregate products), inventory management, batch sizing, and operation scheduling. Depending on the complexity of the production system, the range of different products produced, and the diversification of their routings (recipes), the level of difficulty in estimating a plant's capacity can vary from trivial to formidable. The capacity of a single‐product batch plant depends only on the batch size, the cycle time, and the allocation of production time. If greater capacity is required, then either the production time should be extended or the cycle time reduced by removing bottlenecks. However, in multiproduct or multipurpose facilities with complex material flows, multiple equipment used in parallel, shared resources, and sequence‐dependent changeover and cleaning times, the estimation of the capacity is far from trivial. In fact, in these cases, capacity estimates emerge through the same activities that capacity analysis is supposed to serve, i.e. planning and scheduling. In other words, only after specific production planning and scheduling scenarios have been laid out can capacity be estimated. Therefore, capacity analysis is interlinked with the production planning and scheduling activities, providing important data to carry out these activities and simultaneously emerging as their outcome. This is the reason why, in this section, capacity analysis and production planning are treated simultaneously.
Both production planning and capacity analysis, in different contexts, have been the subject of intense research and industrial activity for many years. It is now recognized that there is no solution to these problems that can fit all cases; there is too much variability in the problem structure for a single solution to cover all aspects. The differences between process industries and discrete manufacturing industries have also been investigated, and the applicability in the process industries of the methods developed mainly for discrete manufacturing has been questioned (e.g., see Refs. [20–22]). Furthermore, pharmaceutical manufacturing facilities have complex requirements because they are typically multipurpose plants equipped with multiple production lines that share utilities, labor resources, and auxiliary equipment such as CIP skids, transfer panels, delivery lines, and occasionally main equipment. In addition, production is typically campaigned, and considerable changeover time is often required between campaigns of different products. API synthesis, in particular, is characterized by complex material flows and the need to handle and store a variety of required intermediates.
Simulation is an appropriate tool to cope with the complexity of production planning and capacity analysis in pharmaceutical manufacturing. Rather than attempting to formalize a single model and come up with a single solution (as optimization‐based methods do), simulation allows the planner to formulate and analyze different scenarios and select the one that best fits the objectives and constraints of the problem. Such “what‐if” analyses can generate feasible production plans utilizing the available capacity or provide justifications for facility expansions and/or outsourcing of production. The types of capacity analysis questions that can be answered using simulation will be demonstrated in this section with the use of the software tool SchedulePro.
47.6.1 Simulating the Production Plan
Production planning involves assigning key facility resources to processing tasks. A simulation‐based approach can be used to support both planning/capacity analysis and scheduling activities. The level of detail included in the simulation model is the only difference between the two. In planning, the recipe representations are coarse, products may be lumped in aggregates with similar production recipes, and only the most basic resources are considered. As a result, a high‐level planning model may be created very quickly. In scheduling, recipes are expanded to their fullest detail, products are differentiated, and all potentially limiting resources are included. The following example will demonstrate the use of simulation for planning and the types of what‐if scenarios that can be investigated under different assumptions and objectives.
47.7 SUMMARY
Process simulation and production scheduling tools play an important role throughout the life cycle of product development and commercialization. In process development, process simulation tools are becoming increasingly useful as a means to analyze, improve, communicate, and document processes. During the transition from development to manufacturing, they facilitate technology transfer and process fitting. In manufacturing, production scheduling tools play a valuable role by generating production schedules based on an accurate estimation of plant capacity, thus minimizing late orders and reducing inventories. Such tools also facilitate capacity analysis and debottlenecking tasks. The pharmaceutical industry has begun making significant use of process simulation and scheduling tools. Increasingly, universities are incorporating the use of such tools in their curricula. In the future, we can expect to see increased use of these technologies and tighter integration with other enabling IT technologies, such as supply chain tools, MES, batch process control systems, process analytics tools (PAT), and so on. The result will be more robust processes and efficient manufacturing, leading to more affordable medicines.
REFERENCES
- 1. Lainez, J.M., Schaefer, E., and Reklaitis, G.V. (2012). Challenges and opportunities in enterprise‐wide optimization in the pharmaceutical industry. Computers and Chemical Engineering 47: 19–28.
- 2. Papavasileiou, V., Koulouris, A., Siletti, C.A., and Petrides, D. (2007). Optimize manufacturing of pharmaceutical products with process simulation and production scheduling tools. Chemical Engineering Research and Design 85 (A7): 1–12.
- 3. Petrides, D.P., Calandranis, J., and Cooney, C.L. (1996). Bioprocess optimization via CAPD and simulation for product commercialization. Genetic Engineering News 16 (16): 24–40.
- 4. Petrides, D.P., Koulouris, A., and Lagonikos, P.T. (2002). The role of process simulation in pharmaceutical process development and product commercialization. Pharmaceutical Engineering 22 (1): 1.
- 5. Hwang, F. (1997). Batch pharmaceutical process design and simulation. Pharmaceutical Engineering 17: 28–43.
- 6. Thomas, C.J. (2003). A design approach to biotech process simulations. BioProcess International 1 (10): 2–9.
- 7. Petrides, D.P. and Siletti, C.A. (2004). The role of process simulation and scheduling tools in the development and manufacturing of biopharmaceutical. In: Proceedings of the 2004 Winter Simulation Conference (ed. R.G. Ingalls, M.D. Rossetti, J.S. Smith and B.A. Peters), 2046–2051. Piscataway, NJ: IEEE Service Center.
- 8. Plenert, G. and Kirchmier, B. (2000). Finite Capacity Scheduling: Management, Selection, and Implementation. New York: Wiley.
- 9. Lakerveld, R., Heider, P.L., Jensen, K.D. et al. (2017). End to end continuous manufacturing: integration of unit operations. In: Continuous Manufacturing of Pharmaceuticals (ed. P. Kleinebudde, J. Khinast and J. Rantanen). Hoboken, NJ: Wiley.
- 10. Gerogiorgis, D.I. and Jolliffe, H.G. (2015). Continuous pharmaceutical process engineering and economics: investigating technical efficiency, environmental impact and economic viability. Chimica Oggi 33 (6): 29–32.
- 11. Parshall, J. and Lamb, L. (2000). Applying S88: Batch Control from a User's Perspective. Research Triangle Park: ISA.
- 12. Intelligen (2007). Chapter 2 of the User's Guide of SuperPro Designer. http://www.intelligen.com/demo (accessed 22 October 2018).
- 13. Petrides, D., Koulouris, A., and Siletti, C. (2002). Throughput analysis and debottlenecking of biomanufacturing facilities, a job for process simulators. BioPharm International 15: 28–34.
- 14. Tan, J., Foo, D.C.Y., Kumaresan, S., and Aziz, R.A. (2006). Debottlenecking of a batch pharmaceutical cream production. Pharmaceutical Engineering 26: 72–82.
- 15. Harrison, R.G., Todd, P., Rudge, S.R., and Petrides, D.P. (2003). Bioseparations Science and Engineering. New York: Oxford University Press.
- 16. Achilleos, E.C., Calandranis, J.C., and Petrides, D.P. (2006). Quantifying the impact of uncertain parameters in the batch manufacturing of active pharmaceutical ingredients. Pharmaceutical Engineering 26: 34–40.
- 17. Abel, J. (2008). Enterprise knowledge management for operational excellence. Pharmaceutical Engineering 28 (2): 1–6.
- 18. Lainez, J.M., Reklaitis, G.V., and Puigjaner, L. (2010). Linking marketing and supply chain models for improved business strategic decision support. Computers and Chemical Engineering 34: 2107–2117.
- 19. Sipper, D. and Bulfin, R. (1997). Production: Planning, Control and Integration. Singapore: McGraw‐Hill.
- 20. Crama, Y., Pochet, Y., and Wera, Y. (2001). A Discussion of Production Planning Approaches in the Process Industry, CORE Discussion Papers, Center for Operations Research and Econometrics, vol. #2001042. Louvain‐la‐Neuve: Université Catholique de Louvain.
- 21. Kallrath, J. (2002). Planning and Scheduling in the Process Industry. OR Spectrum 24: 219–250.
- 22. Schuster, E.W. and Allen, S.J. (1995). A New Framework for Production Planning in the Process Industries. APICS Conference Proceedings 38: 31–35.
